Aliya Thaseen*![]() | Sheshikala Martha
| Sheshikala Martha![]()
© 2025 The authors. This article is published by IIETA and is licensed under the CC BY 4.0 license (http://creativecommons.org/licenses/by/4.0/).
OPEN ACCESS
Perilous and difficult-to-detect lung cancer poses a significant health threat. Because of the gender-neutral lethality, it is especially important to check for nodules as soon as possible. This has led to the development of a number of strategies for identifying lung cancer in its earliest stages. Lung image analysis and segmentation are among the first steps taken in the war against cancer. Manually segmenting medical images is a time-consuming challenge for radiation oncologists. Accurate segmentation of lung Magnetic Resonance Imaging (MRI) and feature extraction and selection models for lung tumor identification are presented in this research. In recent years, numerous methods have been developed for diagnosing lung cancer, with the vast majority relying on MRI scan images. This study provides further evidence supporting the higher diagnostic accuracy of MRI scan images. Consequently, cancer diagnosis based on MRI scans predominates. To determine if the tumor on the lung is benign or malignant, many statistical and textural features are retrieved from the segmented image. There is a symmetric expanding path that recovers the required information and a contracting path that extracts high-level data. This research proposes a Linked Pixel Edge Segmentation with Least Correlated Weight Factor (LPES-LCWF) using machine learning for Lung Tumor Detection. When compared to other models, the findings show that the suggested model does a better job of segmentation and generating feature vectors.
MRI image, edge segmentation, lung identification, lung image segmentation, cancer detection, LPES-LCWF model
The worldwide death toll from cancer is rising at an alarming rate. According to the most up-to-date estimates from Global Cancer Statistics, 20.1 million new cases of cancer will be identified in humans by 2025. In 2020, cancer was responsible for the deaths of 9.96 million people. Lung cancer segmentation has been the subject of extensive research, making it a major field of inquiry [1]. Surgical restraint, radiation, chemotherapy, thermotherapy, and immunotherapy are only a few of the numerous options for managing cancerous tumors and improving patients' quality of life [2]. Among cancers, 12.5% are lung cancers, making it the second most prevalent. Furthermore, about 22% of all cancer-related fatalities worldwide are attributed to it [3].
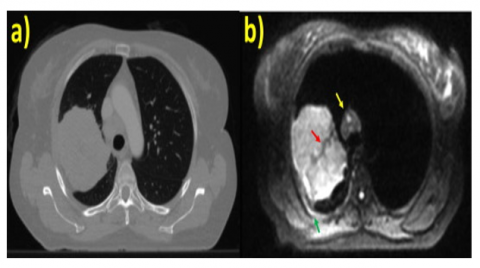
Non-Small Cell Lung Cancer (NSCLC) account for the 85% of lung malignancies while SCLCs account for only 12-15%. Early diagnosis and treatment is a key factor to improving the overall five-year survival rate for lung cancer, which is due to the disease's invasiveness and heterogeneity [4]. In order to lower mortality rates, more money must be invested in the medical field [5], and new methods must be created for early cancer diagnosis [6]. Accuracy is essential when using segmentation results for lung cancer diagnosis. Radiologists typically use manual segmentation [7], despite the fact that it can produce inaccurate results because to variability among observers and inconsistency [8]. Automatic segmentation of MRI scan images of lung cancer is a critical tool for addressing this problem. The normal and cancer MRI image is shown in Figure 1.
Figure 1. (a) Normal MRI image (b) Cancer MRI image
Models trained using deep learning have recently shown remarkable proficiency in a variety of AI and computer vision-related niche tasks. Deep learning has shown promising results in the medical field when applied to the segmentation challenge of lung cancer. One area where algorithms based on deep learning have excelled is in the auto-segmentation of medical images [9]. Without any intervention from a human, deep learning models can learn feature representation and apply the high-dimensional generalization they've acquired to finish segmentation tasks. When dealing with massive datasets, it might be challenging to implement deep learning structures [10].
Using fewer datasets does not improve the results of deep learning models. Adding new types of data, such as medical photographs, might be challenging [11]. The exorbitant price of medical imaging equipment and the need to protect patient privacy make this a necessity. Other medical problems have been helped by applying deep learning to the domains of identification, segmentation, and classification [12]. To stop the spread of cancer, automatic detection and diagnosis utilizing deep learning in Magnetic Resonance Imaging (MRI) scans is essential. A popular area of research in computer vision right now is medical image segmentation [13]. One of the most important and difficult subfields of image processing is introduced in this article. Significant advancements and remarkable results have been achieved in medical image segmentation since the implementation of deep learning and deep convolutional network architectures.
One of the main points of this research is to figure out how to use computer vision and image processing to spot lung cancer. Algorithmic techniques from the field of image processing, such as preprocessing, feature extraction [14], segmentation, edge detection [15], and region-based identification, are used. Parameter values based on features are compared to the spectrum of values employed in clinical practices. By comparing the data, the precise position of the tumour can be determined. MRI images are considered as input and display disordered features alongside the location of the affected area [16]. This has led to the emergence of medical analysis as a new and exciting area of study that has the potential to enhance both the efficiency with which diseases may be detected and the accuracy with which they can be treated [17]. Digitally detecting and diagnosing a patient's disease is the major focus of the Computer Aided Diseases Diagnosis system [18]. Such a technology would analyze patient images and provide doctors with a detailed report on what they see, speeding up the process by which they can decide how to treat their patients. Various imaging modalities are used in the medical profession, including MRI, CT, X-ray, mammography, ultrasound, etc.
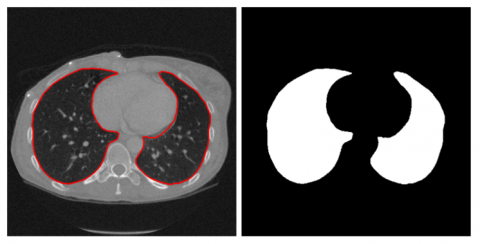
X-rays are commonly recommended by specialists for the detection of skeletal-related disorders such arthritis, fractures, bone cancer, tumours in the tissue of the bones, spinal cord injuries, and so on. Components of this type of image processing include picture acquisition, improvement, categorization, edge detection, Region Detection, categorization, data analysis [19], and so on. Since the image needs to be scaled into a square matrix while retaining uniformity, and the undesired pixel values need to be accurately eliminated, pretreatment of data is important. In order to quickly and accurately pinpoint the area of interest in an MRI image [20], image segmentation is a crucial step. As a result, there are numerous subcategories that may be created from these segmentation techniques, such as threshold-based, region-based, edge-based, pattern-based, wavelet-based, intensity-based, adaptive threshold-based segmentation approaches, etc. The lung image segmentation is shown in Figure 2.
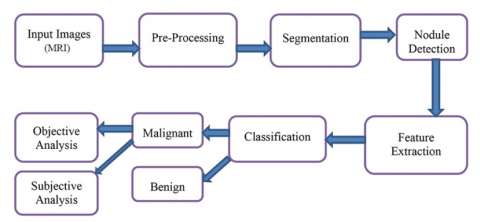
Image segmentation has several applications, including robotic vision, object recognition, and medical imaging [21]. When it comes to diagnosing lung diseases such as lung cancer, tuberculosis, pneumonia, and pulmonary emphysema, MRI is currently the method of choice [22]. The quantity and complexity of medical images continue to increase. This is why the use of computers to aid with tasks like image processing and analysis is so important when dealing with medical images [23]. The original FCM approach is effective for noise-free image segmentation but fails when dealing with images that contain noise, outliers, or other imaging distortions. The general process of lung tumor detection is shown in Figure 3.
Figure 2. Lung image segmentation
Figure 3. General process of lung cancer detection
Before the model for prediction can be trained, however, a feature selection procedure must be run to exclude unnecessary and unreliable features. A predictive model is trained using two datasets: a training dataset and a test dataset, all of which come from the patient cohort. Model improvement relies heavily on the impartial information provided by the independent test set [24]. The radiomic features that are retrieved are commonly divided into four classes: shape, first-order features, second-order features, and higher-order features [25]. The morphological features of the Region of Interest (ROI) are represented by the shapes within it. The intensity distribution inside the ROI can be described with first-order features, which are straightforward observations of the voxel values [26]. Second order features, also known as texture features, describe the connections between individual voxels within a ROI. Applying filters to the ROI or image while extracting features might create higher-order features. This research proposes a Linked Pixel Edge Segmentation with Least Correlated Weight Factor using machine learning for Lung Tumor Detection. A groundbreaking model in lung tumor diagnosis, the LPES-LCWF integrates machine learning, optimizes weight factors, and detects edges. The model lowers false positives and optimizes feature selection through the use of least correlated weight factors, and it excels at exact tumor border delineation with its superior pixel linking algorithms and continuous edge tracking capabilities. Machine learning allows for complex pattern detection and ongoing model improvement when combined with supervised and deep learning architectures. Enhanced accuracy in detecting tiny cancers, decreased false positive rates, and more precise tumor boundary characterization are some of the significant practical benefits that result from these technological aspects. Thanks to its enhanced processing techniques and decreased overhead, the model exhibits amazing computing efficiency, rendering it suitable for real-world clinical applications. Its architecture is capable of handling multiple MRI protocols and picture quality levels with ease, and it consistently performs well across a wide range of patient demographics. In terms of patient care, the model improves radiologists' diagnostic support, allows for more accurate tumor measures, and makes treatment planning easier.
The use of medical imaging in actual patient care has been expanding in the last several years. Radiographs of the lungs are crucial for medical diagnosis. The precision with which surgeons can remove a tumor depends on their knowledge of its precise location, volume, and size. Consequently, computer-aided design (CAD) software is crucial for managing and interpreting numerous images of lung tumors. Using a hybrid attention mechanism and parallel deep learning, Hu et al. [2] proposed a method for segmenting images of lung tumors that could handle the complexity and self-adaptation of such images. Identifying lung parenchyma was aided by early stages of image processing. As part of a hybrid attention mechanism, the pictures were subsequently fed into a DenseNet module. There are four possible approaches to the verification that include adjusting the quantity of dense blocks used in the convolution. The long-awaited realization of the perfect network layout has arrived.
A computer-aided detection system (CAD) for breast malignancies is meaningless without automated segmentation of breast ultrasound pictures. By combining a feature pyramid nonlocal network (FPNN) with transform modal ensemble learning (TMEL), Tang et al. [3] were able to effectively separate breast tumors from ultrasound pictures. The FPNN combines the nonlocal module with the feature pyramid network to fuse multilayer features while addressing long-range dependencies. The TMEL is also employed to direct two iFPNNs that extract specific tumor-related properties. Dataset-Cairo University and Dataset-Merge, two publicly available datasets, were important in making this possible.
Chronic NSCLC accounts for 84% of all lung cancer diagnosis. In order to differentiate between the two kinds of NSCLC, adenocarcinoma (ADC) and squamous cell carcinoma (SqCC), Bicakci et al. [4] conducted a thorough investigation into the application of deep learning-based classification methods. Eighteen F-FDG PET scans were administered to 94 study participants' tumors in a total of 1457 separate slices. The function of non-tumor regions in cancer subtype categorization was investigated in three experiments using positron emission tomography (PET) images. In these tests, three distinct image types were used to assess convolutional neural network (CNN) models, including the multilayer perceptron (MLP), SqueezeNet, and VGG16/VGG19. There are three types of image segments: first, those that have been cropped to include the cancer; second, those that have been randomly sliced and matched to tumors; and third, the raw slices, which have not been edited in any way. Each model was fine-tuned for diagnostic classification using a combination of optimizers and regularisation methods. We used F-score and area-under-curve (AUC) measures to evaluate the classification models' performance after training and verifying them with stratified 10-fold cross validation. The author draws the conclusion that including peritumoral areas and tissues entirely eliminates the need for manual segmentation and increases model performance based on the data.
The clinical implications of lung tumor segmentation in PET-CT images are substantial, as they facilitate precise diagnosis and treatment. This remains an uphill battle, nonetheless, in the realm of medical image processing. The lung tumor appears to change substantially between PET and CT images as a result of breathing and movement. Lung tumors in PET-CT scans appear to be of varying sizes and shapes, even though they were collected and aligned at around the same time. Despite these obstacles, a modality-specific segmentation network is still the way to go for PET-CT data processing when trying to identify lung tumors. It is possible to use MoSNet in tandem with PET and CT scans to detect lung cancer. In order to train MoSNet to recognize lung tumors in PET and CT scans, the network first learns a representation that is distinct to each modality, which shows how the two scans differ. Then, it learns a representation that is fused between modality, which shows how the two scans share features. In order to reduce the approximative modality gap, Xiang et al. [5] suggest an adversarial technique that utilizes a modality discriminator and a reserved modality-common representation in conjunction with an adversarial objective. The network's representational power is enhanced, allowing for modality-aware segmentation of lung cancer in PET and CT scans.
Tahmasebi et al. [6] created a GPU-based system that can accurately follow tumors in real time, making automated radiation therapy for cancer treatments more successful. In order to make it suitable for use in clinical settings, the authors reimplemented it on a cheap parallel GPU-based computer architecture, which significantly improved the processing performance. It is highly recommended to use GPUs for certain parts of the registration technique, such as computing the similarity metric, because they are well-suited to parallel processing. Utilizing the GPU's significantly quicker shared memory allowed for the rapid generation of the mesh deformation by speeding up the solution of a partial differential equation. Applying the suggested technique to an NVIDIA Tesla K40c GPU resulted in computational acceleration that was almost five times faster than a central processing unit.
Models based on fully convolutional networks (FCNs) and unified neural networks (U-Nets) are now considered to be the best for medical picture segmentation. Although these models work, there are two big problems with them: first, the best depth to use is unknown in advance, so finding an architecture that works takes a long time or using an ensemble of prototypes with different depths doesn't work. Second, the fusion scheme that these models use is too restrictive because of their bypassing connections. As a result, you can only aggregate maps that are the same size in the encoder and decoder sub-networks. Zhou et al. [7] offered three solutions to the issue of unknown network depth: first, a highly flexible feature fusion scheme that uses a redesign of skip connections to aggregate characteristics with different semantic scales at the decoder sub-networks; second, an efficient ensemble of U-Nets with different depths that share an encoder and co-learn simultaneously using deep supervision; and third, UNet++, an architecture that uses this redesign for semantic and instance segmentation.
In order to separate several organs and UDAs from CT images, Jiang et al. [8] created a unique hybrid network called PSIGAN, which combines probabilistic segmentation with image distribution matching. The UDA method uses a new structure discriminator to show how the images and their segmentation are dependent on each other through a joint probability distribution. The ability to automatically segment liver tumors is crucial for improving the detection and management of liver cancer. Annotations at the pixel level have been the basis for many deep learning techniques that have improved picture segmentation in recent times. Nevertheless, due to the extensive annotations that need to be obtained, deep neural networks' performance is limited when applied to medical image segmentation. When presenting data linked to liver cancer, radiologists frequently employ the Couinaud segment because of its usefulness in describing tumor location. A new method for segmenting liver tumors using convolutional networks and annotations from Couinaud segments was introduced by Lyu et al. [9] in their publication. Numbers 1 through 8 placed on images form the Couinaud segments, which each stand for a distinct section of the liver. In order to train a fully supervised tumor segmentation model, the author presented a model called Couinaud Net. This model can estimate pseudo tumour masks using only the Couinaud segment annotations as pixel-wise supervision.
Brain tumour segmentation has attracted the attention of both academics and businesses due of the hope it holds for the future of improved diagnosis and treatment. Present methods, however, frequently disregard clinical practise standards in favour of treating the problem as a simple semantic segmentation exercise. A frequent clinical practice that can uncover areas of cancer that were previously undiscovered is comparing volume data across multiple imaging modalities. After dividing the tumor into its most distinguishable piece, they also search for the other two sections. To segment brain tumors, Zhang et al. [10] first presented a new task-structured network (TS net) built on the task-task structure, and then they presented a new task-structured network (TSBTS net) built on the task-modality structure. The author developed a modality-aware feature embedding method to examine the task-modality relationship by deducing the important weights of the modality data during network training. The author performed tumor area prediction as contingently dependent sub-tasks and embedded this reliance in the network stream to examine the task-task structure.
While detection and segmentation have garnered a lot of attention in computer-assisted lung cancer diagnosis, volume estimation and grading of malignant nodules have gotten comparatively little attention. Furthermore, due to the fact that lung cancer segmentation methods are currently semi-automatic, radiologists are still required to identify the cancerous regions on each slice. This leads to longer wait times for diagnoses and makes them more subjective. The use of conventional convolution in these methods also leads to erroneous segmentation of the cancerous nodule's real boundaries. It is also important to have a system in place that can detect irregularities in screenings and assign a grade to lung cancer based on actual criteria. Enhanced performance in cancer diagnosis, segmentation, volume estimate, grading, and early warning system are described in this study work by Sathe et al. [11]. The system is fully automated and end-to-end and uses five primary models. So that the real shape of the cancerous nodule can be preserved, the traditional convolutional method is tweaked. Segmenting lymph nodes, trachea, and cancer all at once is possible with the use of a focus module and a modified loss function, and it achieves an accuracy of 92.09% while also eliminating redundancy.
One of the deadliest cancers in the world, lung cancer, has a much better prognosis when caught early. Pulmonary nodules are discovered most frequently by CT scans and are an early indicator of lung cancer. More and more medical professionals are turning to computer-aided diagnostic technologies to help them spot illnesses. Pulmonary nodule segmentation accuracy is affected by both internal heterogeneity and external data sources. Jiang et al. [12] propose a new mixed manual feature network to address the segmentation problems of subtle, mixed, adhesion-type, benign, and unclear nodule types by increasing sensitivity and accuracy. This approach incorporates feature information using a multi-dimensional fusion module and a dual-branch network structure.
The way people live their lives now has caused or exacerbated many ailments. Cancer, the deadliest of all cancers, is one of these illnesses. It is possible that early cancer identification made possible by Computer Aided Diagnosis (CAD) technology might save lives. When it comes to finding lung tumors, computed tomography (CT) scans are highly regarded. Location, form, and poor image quality from CT scans are just a few of the challenges that clinicians face when attempting to diagnose malignant cancers. Because of this, deep learning algorithms have a lot of respect among experts. A new model for tumor and nodule segmentation in CT scan images was introduced by Rehman et al. [13] using a convolutional neural network (CNN) approach. The proposed model incorporates pre- and post-processing stages to ensure precise nodule segmentation. Filtering is used in preprocessing to enhance images, and morphological operators are used in postprocessing to fine-tune segmentation. Finally, the active counter method showed that tumors and nodules could be accurately detected.
Although airway segmentation is a major pain to do manually, it is necessary for studying, diagnosing, and prognosing the progression of lung diseases. In an attempt to do away with this time-consuming and subjective human procedure, researchers have proposed methods to automatically split airways using CT images. Certain small-sized airway branches, such bronchus and terminal bronchioles, make automatic segmentation using machine learning models even more challenging. Because voxel values vary and there is a huge data imbalance in airway branches, the computational module is prone to false-negative and discontinuous predictions, especially for groups with different lung illnesses. The attention mechanism has proven capable of segmenting complex structures, and fuzzy logic can reduce uncertainty in feature representations. Since the fuzzy attention layer incorporates fuzzy theory, combining deep attention networks with it should yield a more robust and generalizable solution. In their study, Nan et al. [14] laid out a method for airway segmentation that works. With the use of a comprehensive loss function and a novel fuzzy attention neural network (FANN), it enhances the spatial continuity of airway segmentation. A deep fuzzy set is built upon a set of feature map voxels and a learnable Gaussian membership function. The proposed channel-specific fuzzy attention approach deviates from the existing attention method in order to address the issue of channels with diverse attributes.
The use of automated detection methods, namely nodule segmentation approaches, has recently become popular in lung cancer screening, thanks to developments in computing technology. These techniques distinguish between solid and soft tissues, normal and cancerous nodules, and more by means of thresholding. Recognizing nodules in close proximity to vital lung structures including blood vessels, bronchi, and the pleura is challenging and calls for more sophisticated procedures to enhance the accuracy of diagnoses. According to Gunawan et al. [15], combination processing filters should be used to prepare the data before using one of the modified Convolutional Neural Networks (CNNs) as the classifier. Solid, semi-solid, or ground glass nodule targets with improved filters can be used for low-stage cancer (cancer screening data) or high-stage cancer. Furthermore, two additional investigations addressing juxta-pleural nodules were incorporated; these investigations used three-dimensional domains for pre-processing and classification rather than the conventional two-dimensional domain.
Segmenting the lung parenchyma accurately is critical for computer-aided lung cancer diagnosis. When presented with large, clearly defined regions, existing networks for segmenting lung parenchyma perform admirably. However, when confronted with smaller, less clearly defined regions, they become extremely slow. Zhu et al. [16] proposed an improved network setup to improve segmentation performance of small and fuzzy lung parenchyma sections while maintaining accuracy for big and clear regions. U-Net has been upgraded to become the proposed network. A shape stream branch and multi-scale convolutional blocks are now part of the network. The suggested network takes computed tomography (CT) pictures as input and returns matching binary masks as output. The Open Source Imaging Consortium's Pulmonary Fibrosis Progression dataset provided the major CT images utilized in this study.
In PET images because the process of segmenting sick tissue in these images is tedious, inaccurate, and takes a lot of time. The framework designed by Guan et al. [17] began by selecting whole-body pictures that contain lesion tissue using a differential activation filter, which takes PET image features into consideration. Secondly, a novel neural network with residual connections is suggested for PET image denoising and reconstruction; this network outperforms the standard FCN network in terms of generalization. Lastly, a proprietary density-based clustering approach is employed to differentiate between normal and lesion tissues during lesion tissue segmentation. In comparison to other algorithms, the entire automated system outperforms them in terms of performance and time cost when it comes to screening PET lesion images, denoising images, and segmenting lesion tissues, as demonstrated by tests conducted on real medical PET scans. There is hope for future research and practical use of the framework.
A deterministic result, ignoring the underlying uncertainty, is generally produced by deep learning systems, notwithstanding their success in multi-modality segmentation tasks. In safety-critical clinical applications in particular, the lack of uncertainty could cause overconfidence in forecasts, which could have disastrous results. Because it provides a metric for the certainty of machine choices, uncertainty estimate has been getting a lot of interest as of late. There has been very little research into the uncertainty of multi-modality networks since most of the current uncertainty estimation methods concentrate on single-modality networks. Kang et al. [18] provided the first comprehensive look into multi-modality uncertainty as they pertain to PET/CT tumor segmentation. For this purpose, the author compared four popular uncertainty estimating methods on a number of criteria, such as segmentation accuracy, uncertainty quality, correlation to contradicting information across modalities, and comparison to uncertainties for a single modality. By combining qualitative and quantitative methods, the author was able to better understand the advantages of multi-modality uncertainty, the information they capture, and their correlation with data from individual modalities.
When working with massive labelled datasets, supervised deep learning techniques have achieved state-of-the-art performance. However, due to privacy concerns, high annotation costs, and a lack of medical professionals, medical image analysis faces challenges when trying to access big labeled datasets. In a so-called pretext task, a subfield of self-supervised learning uses unlabeled data to train a network to prioritize a legitimate latent representation of the input. After learning features in earlier tasks, the model applies them to a downstream job with less annotations. Cheke et al. [19] presented PatchLoc, a new kind of pretext task, whose goal is to use an image as a supervisor and determine where a particular patch is located. Using three separate medical datasets, we proved that PatchLoc was effective on a downstream segmentation job.
Among the many obstacles to overcome in the creation of CADs is the automated segmentation of data from multimodality positron emission tomography—computed tomography experiments. Here, methods based on CNNs are seen as cutting. But when they only look at local patterns, these CNN-based approaches struggle to learn the global context or co-learn the complementing PET-CT picture elements. Methods: For the purpose of PET-CT image segmentation, Bi et al. [20] presented a cascaded CNN-transformer network (CCNN-TN). Because TNs may build global context via self-attention and embedding picture patches. By using a cascade of TNs and CNNs, the author was able to learn both the global and local contexts, expanding the TN definition. Additionally, the author included a hyper fusion branch that merges the complementary picture features that were extracted individually in an iterative fashion. Using three datasets, one for soft tissue sarcoma (STS), one for nonsmall cell lung cancer (NSCLC), and one for our method, compared it against the state-of-the-art CNN approaches. To enhance cancer survival prediction, Cai et al. [21] presented a novel computational method called CRESCENT. It is a GCN based on prior knowledge graphs including protein-protein interactions (PPI). In order to forecast whether patients will survive, CRESCENT uses gene expression networks instead of gene expression levels.
When it comes to global mortality rates, lung cancer is among the top one. A key component of early cancer detection is the processing and segmentation of lung images. Radio oncologists have a lengthy and laborious task ahead of them when it comes to medical imaging segmentation. When it comes to cancer, lung cancer is still the killer on a global scale. The key to successful therapy and higher survival rates is early discovery. While there are some benefits to using traditional methods like chest radiography, such as convenience and low cost, there are also some drawbacks, such as a high likelihood of false positives and misdiagnosis when it comes to detecting lung nodules. Detecting lung cancer accurately with current imaging modalities, such as CT and chest radiography, is a substantial issue. A big problem is the high rate of false positives, which causes patients to undergo unneeded tests and follow-up appointments. It is becoming more and more difficult to identify problematic lesions early on because to studies showing that a large percentage of nodules found by CT screening are false positives. Additionally, radiologists frequently face difficulties in differentiating between benign and malignant nodules because of overlapping anatomical components, which adds another layer of diagnostic uncertainty. Globally, lung cancer ranks among the top cancers in terms of incidence and mortality. To improve a patient's chances of survival, lung cancer must be detected early. MRI imaging, which gives a thorough scan of the lung, is a commonly utilized modality for screening and diagnosing lung cancer. There has been much research into using deep learning techniques to aid in the interpretation of MRI images to identify lung cancer, in keeping with the development of computer-assisted systems. There is a strong requirement to perform segmentation of MRI images to consider the relevant portions for accurate detection of lung tumor.
When it comes to clinical applications, the success of current methods for segmenting and extracting features from lung cancer suffers from a number of serious shortcomings. Dealing with the tremendous variety of tumor features is the main obstacle, especially in early-stage detection when benign and malignant nodules can be easily ignored due to small variances. When tumors are situated close to similar-density anatomical features, like blood arteries or the chest wall, traditional segmentation methods frequently over-segment or border leak when trying to contain them. The variable segmentation findings are also caused by the limits of current approaches when dealing with low-contrast pictures, motion artifacts, and MRI scans with varied slice thicknesses. Lung tumors are notoriously diverse, with ground-glass opacity nodules and part-solid nodules being just two examples of the many variations that might throw off automated feature extraction systems that rely on classic intensity-based methods. Additionally, when tumors have irregular or spiculated margins, or if they are of a varied size or location, existing systems frequently do not have strong enough mechanisms to deal with these variations.
For complete feature extraction, there is still a major lack of integration between temporal and multi-modal data. Existing approaches often examine photos independently, overlooking the importance of longitudinal data that could reveal patterns of tumor progression and treatment efficacy. Finding solutions that work for everyone is difficult because imaging techniques and equipment vendors don't agree on how to extract features. Most algorithms are trained on specialized datasets that may not represent the complete range of real-world cases, thus there's a noticeable gap in their capacity to automatically adjust to varied patient populations and varying image qualities. When it comes to processing massive volumetric datasets in real-time clinical situations, existing methods frequently fail to strike a good balance between computational efficiency and accuracy. Since most existing approaches ignore the larger clinical context in favor of imaging features, there is an urgent need to improve the integration of radiomics features with genetic information and clinical metadata. Important for clinical decision-making and treatment planning, there are no reliable ways in the field to measure uncertainty in segmentation and feature extraction.
4.1 Weighted discriminative extreme learning machine design for lung cancer detection by an electronic nose system
All sensors are treated uniformly and their data is utilized consistently when features are extracted. Features obtained from sensors that are unable to detect lung cancer biomarkers will ultimately be useless for classification, though, because not all sensors will have this capability [27]. Thus, it is commendable to use feature selection to further optimize features. To achieve this goal, the TRC algorithm is utilized to evaluate characteristics. The TRC framework is a universal graph-based feature selection tool that finds the best subset-level score rather than maximizing the scores of individual features. To compare the accuracy of feature subsets of different sizes, the WDELM classifier and the TRC method are used in leave-one-out cross validation. By combining the ideas of accuracy with G-mean optimality, we can get the five-feature optimal feature subset. In order to facilitate the subsequent construction of the sensor array, the characteristics are correlated with the WSP2110, MP901, and SP3S-AQ2-01 sensors.
The feature data and the proposed classification method are utilized to construct the discriminant model. Detailed three-dimensional principal component analysis (PCA) diagram showing all features and the features that were selected for study. (a) A full feature principal component analysis (PCA). (b) The attributes that have been specified will undergo principal component analysis (PCA). The effectiveness of the model is evaluated using the leave-one-out cross-validation. The next thing to do is arrange the samples by when they were collected. Next, the model's robustness is tested by using the remaining samples as a training set and the final data as a test set. Using the min-max technique, the data is normalized to remove disparities in feature magnitudes. In addition, the proposed classification method is tested using a gas sensor array with a drift dataset obtained from the UCI machine learning repository [28]. Batch processing is utilized due to the enormous quantity of information contained in this dataset. Class 4 has the smallest sample size overall, yet each of the six classes has its own unique sample size. For this reason, datasets with class 4 data and datasets with data from other classes are used to compare WDELM to other classical algorithms. Every dataset has its data standardized using the z-score method and subjected to tenfold cross validation. After that, for comparison, the average recognition results are displayed.
4.2 Metabolic imaging based sub-classification of lung cancer
For the purposes of this inquiry, three independent experiments were conducted using three distinct datasets. The main dataset for the initial experiment was a series of raw FDG-PET images obtained from the scans, with a resolution of 168 × 168 pixels. A different dataset, including ROIs meticulously extracted from each FDG-PET slice to include tumor and peritumoral tissue, is utilized in the second study. Instead of specifying a typical bounding box size, the boxes were individually cropped to fit the tumor. Because the tumors were not uniform in shape, the number of peritumoral areas differed among slices [29]. In order to ensure that the input photos used by deep learning models are uniform in size, a standard and appropriate picture size is defined. Since further processing wasn't needed for the initial trial, all of the photographs were the same size. We utilized datasets with a maximum subimage size of 64 × 64 pixels, which allowed us to include all tumors in each slice, for the second and third tests. Everyone in the bounding box had their pixel value set to zero in order to achieve zero padding, with the exception of the ROIs in the second experiment and the segmented sections in the last experiment. Ultimately, the datasets were input into the deep learning models, which were subsequently trained and tested.
As part of this technique, nodes are removed from the network at random during training in accordance with a fixed ratio. Finally, this work trained the models' fully-connected layers using the dropout with a ratio of 0.5. These fine-tuned convolutional neural network (CNN) designs take 64 × 64 pictures. Using 64 neurons and varying the number of hidden layers, this research aimed to compare MLP models. Deepening the structure of the MLP model improved its classification performance. Studying the optimal performance of MLP variants with3,7,11, and 15 hidden layers helped reach this objective. There is no known academic study that specifies a minimum or maximum number of neurons that should be used in MLP architectures at this time. The dropout strategy, which maximizes the number of hidden layers by employing alternative values, improves the number of neurons by randomly removing nodes from the network during training based on the 0.5 ratio.
A novel strategy for edge connectivity and feature weighting sets the proposed LPES-LCWF model apart from previous segmentation methods. With its linked pixel methodology, LPES-LCWF prioritizes pixel-level associations, allowing for more precise boundary detection, particularly in cases with delicate tumor margins, in contrast to UNet++'s reliance on skip connections and dense layered architectures. In contrast to fuzzy attention networks, which are great at dealing with uncertainty by softly assigning attention weights, LPES-LCWF's least correlated weight factor introduces a new optimization criterion that reduces false positives and improves tumor detection by eliminating redundant feature dependencies. Edge continuity and correlation-based feature selection are the primary areas of focus for LPES-LCWF, in contrast to CNN-transformer hybrids that use self-attention processes to merge local feature extraction with global context. Because of its expertise, it is better able to deal with the unique computational challenges of lung tumor segmentation, such as accommodating tumors of varied sizes and forms. Another typical problem in lung cancer imaging is tumors with irregular or poorly defined boundaries; this model excels at dealing with these tumors because it places a focus on linked pixel relationships, which other architectures may struggle with. Using least correlated weight factors also helps in cases where there are artifacts or fluctuations in tissue density, making it harder for conventional attention processes or skip connections to differentiate between actual tumor boundaries and noise.
The detection of lung tumor nodules relies in part on lung region extraction because of its improved reliability and accuracy at a reduced computing cost. The pulmonary area can be extracted using multi step procedure. In order to extract specific information from a large image, a procedure called segmentation is used. When processing medical images, segmentation is a common approach. The main purpose of any picture is to help people spot the relevant region and avoid the irrelevant region. Therefore, it separates an image into sections based on the degree to which their components are alike. This appearance can be achieved by adjusting the intensity and texture. By isolating a focus region, diagnostic information that is specific to the issue at hand can be accessed more quickly.
To segment an image, it is divided into smaller sections. An image is segmented after it has been preprocessed so that more information may be gleaned from it. To begin segmenting a picture, a method of edge detection that breaks down an image's border into discrete parts is considered in this research. To continue the segmentation process, a threshold range is applied to the operator to eliminate intensity values below the threshold and retain intensity values above the threshold. The grayscale image is preprocessed based on the gradient magnitude, which consists of the high pixel values along the object's border and the low pixel values in another left region. The resulting segmented image can then be used to extract features. The death rate from lung cancer can be reduced significantly with early identification. Regular MRI chest screenings are recommended for people at high risk for detecting lung cancer. It has been demonstrated that the CAD system is an effective second opinion for doctors in the interpretation of medical imaging data. The three key parts of the typical feature-based CAD workflow are nodule segmentation, feature selection, and inferring clinical assessments.
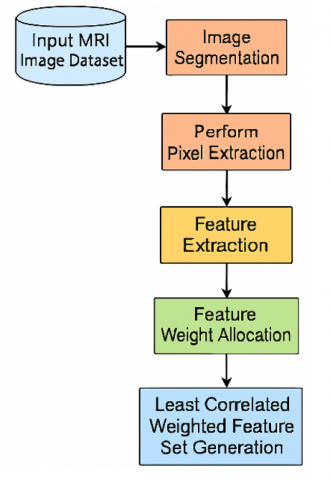
As an input, the MRI lung pictures are taken into account by the suggested model. Processing and segmentation of the photos will follow. Pixel extraction is carried out after the most pertinent parts of the lung picture have been retrieved. A weight allocation is carried out once features are taken from the lung region. The features are given weights according to the dependency model. In order to train the machine to accurately detect lung cancer, we take the features that are least associated and keep them in the feature set.
The proposed model framework is shown in Figure 4.
Nodule size, type, position, count, and emphysema information in MRI scans are common imaging criteria, whereas age, gender, specimen collection date, smoking history, family history of lung cancer, and other clinical variables may be involved. Although these criteria are commonly used to evaluate malignant nodule characteristics, they are subjective and not standardized, thus they may not always give a complete and quantitative picture. This study presents a machine learning-based approach to lung tumor detection called Linked Pixel Edge Segmentation with Least Correlated Weight Factor (LPES-LCWF).
Figure 4. Proposed model framework
Algorithm LPES-LCWF
{
Input: MRI Lung Image Dataset {LIDset}
Output: Feature Set {Fset}
Step 1: Initially, each image from the dataset is loaded, and the image attributes are considered for processing. The image loading from the dataset is performed as
$\begin{aligned} Iset[N]=\sum_{i=1}^N \ getImgattr \left( LID _{set }(i)\right) +\delta(i)\{ set (\theta(i) to 30) + maxIntenity (i)\end{aligned}$
Here, each and every image is loaded from the image dataset and δ is the intensity level of the image considered.
Step 2: After loading each image, segmentation is performed which divides the images into multiple portions. The purpose of segmentation is to transform a MRI image representation into one that is more digestible and informative. Components and boundaries can be found with the help of image segmentation. Assigning a name to each pixel in an image in such a way that pixels having the identical label share attributes is done by segmentation process. Segmenting an image yields a collection of contours that outline the image's boundaries or a series of segments that encompass the full image. Similarity between pixels in a region is measured by their shared possession of a single characteristic or calculated property such as hue, saturation, or texture. The MRI image segmentation process is performed as:
$Icontrast[N]=\sum_{p, q=0}^N pixset_{p q}(p-q)^2$
IEntro $[N]=-\sum_{p, q=0}^N$ pixset$_{p q} \log _2\left(\right.$pixset $\left._{p q}\right)$
$\begin{aligned}Iseg[N]=\prod_{i=0}^N & \frac{\sqrt{\sum_{i=1}^N \max (\delta(i))+\max (Icontrast(i))}}{len(Iset)+IEntro(i)} \\ & +\tau(x, y)-\min (\delta(i))+\sum_{i=0}^N \frac{maxIntensity(i)}{minIntensity(i)} +T h\end{aligned}$
Here, τ is the pixel similarity level of two adjacent pixels x and y. The minimum intensity pixels are removed from the images that are irrelevant. This is the threshold value of the image.
Step 3: The images, after being divided into segments, perform pixel extraction to load all pixels from each segment. The pixel extraction will extract all pixel sets from each segment. The pixel extraction process is performed as
$\begin{gathered}PixSet[N]=\sum_{i=1}^N \frac{G(x, y)}{Iseg(i)}+getIntensity(i) \\ +\max _{i \leq x \leq N}(Iseg(i) * x y\end{gathered}$
Here, G is the model for considering the pixel values from the segments. Each pixel value is considered from the segment set.
Step 4: The purpose of the image processing technique known as edge detection is performed on the extracted feature set that is to locate specific locations within a digital image where there are abrupt contrast shifts for differentiating relevant irrelevant portions of the image segments. The borders of an image are defined as the points where the brightness of the image changes dramatically. The edge detection process is performed as
$\begin{aligned} EdgeSet[N]=\sum_{i=1}^N & getmax(PixSet(i)) \\ & +\frac{simm(pixattr(i, i+1))}{len(Iseg(i))} \\ & +Th\left\{\begin{array}{l}set \leftarrow \operatorname{maxattr}(i)if simm(i)<T h \\ 0 \quad Otherwise \end{array}\right. \\ & if(EdgeSet(i)==0) \quad\end{aligned}$
$\begin{aligned} EdgeSet[N] \leftarrow getmax(PixSet(i)) +\frac{simm(pixattr (i, i+1))}{len(Iseg(i))} \forall maxattr(i)\end{aligned}$
Step 5: The process of converting unstructured data to an assortment of quantifiable qualities that can subsequently be handled without retaining any of the original data's contexts is known as feature extraction. The feature extraction from the relevant segment portion is performed as
$\begin{gathered}Fextr[N]=\sum_{i=1}^N \frac{maxattr(EdgeSet(i))}{len(EdgeSet(i))}+\max (getVal(i, i+1)) \\ +\frac{\beta(EdgeSet(i, i+1))}{\max (simm(EdgeSet(i, i+1))} \\ -minattr(EdgeSet(i))\end{gathered}$
Here β is the model considered for getting the attributes with the similar intensity range that is extracted in numerical format.
Step 6: Each feature in the set of extracted features is given a weight according to its association with the other features in the set, following its extraction from the picture segments. The correlation factor is used to assign the weights. The weight allocation is performed as:
$\begin{aligned} Walloc [N]=\sum_{i=1}^N \max & (\operatorname{corr}(Fextr(i, i+1))) +\frac{\min (diff(F extr(i, i+1)))}{len(F extr(i))} -\max (diff(F extr(i, i+1))) +\max (simm(F extr(i, i+1))\end{aligned}$
The corr() is used to find the correlation relation among the two features, which is repeatedly performed for all the features. Simm() model is used for similarity checking of the features for weight allocation.
Step 7: The Least Correlated Weighted feature vector is generated based on the allocated weights. The feature vector set is generated, which is used to train the machine learning model for lung tumor detection. The feature vector generation process is performed as:
$\begin{gathered}\ Fvect [N]=\prod_{i=1}^N \frac{\sum_{i=1}^N \max ( Walloc ( Fextr (i)))}{ len (\ Walloc )} \\ +\gamma(Walloc (i, i+1))\end{gathered}$
$Fvect$ $[N]=\left\{\begin{array}{c}F vect \leftarrow F extr (i) \ if \min ( diff (i, i+1)) \\ 0 \quad \ Otherwise \end{array}\right.$
$Fvect[N]=\left\{\begin{array}{c}F \text { vect } \leftarrow F extr (i) \ if \ corr (F extr (i)) \\ and \max ( Walloc (i)) \\ 0 \quad \ Otherwise \end{array}\right.$
Here, γ is the method for extracting the maximum weighted features list that is used for training the model.
}
The lung cancer is dreaded in many parts of the world, despite the fact that lung cancer has a relatively high survival rate if discovered in its early stages. The disease known as lung cancer can be fatal. The detection of cancer remains a difficult task for doctors. Unfortunately, neither the precise origin nor a comprehensive cure for cancer has been found. If detected early enough, cancer can be successfully treated. Locating areas of the lung affected by cancer requires the application of image processing techniques including noise mitigation, extraction of features, recognizing damaged regions, and maybe contrasting them with data on previous diagnoses of lung cancer. There are two main categories of cancer cells: benign and malignant. Malignant tumours cause the growth of several cancerous cells deep within a person's lungs, while benign tumours are easily detectable. The key to survival is finding malignant cancer cells when they're still relatively easy to treat. The benign and damaging modules differ in terms of where cancer cells develop and how they look and feel. In order to analyze and make sense of visual data, segmentation is a necessary first step. Several methods have been proposed in the existing literature.
When segmenting an image, each pixel is labeled with a category. In order to do any additional analysis on an image, segmentation must first be performed. Recent developments in imaging and sequencing technologies have allowed for the methodical advancement of clinical research into lung cancer. However, there is a limit to what the human brain can do in terms of effectively handling and making full use of such enormous data sets. Machine learning-based approaches play a significant role in integrating and evaluating these massive and complicated datasets, which have effectively described lung cancer from a variety of viewpoints using the acquired data.
Google Colab development in Python requires a comprehensive setup that begins with basic hardware requirements, including a web browser, a stable internet connection, and minimum 4GB RAM on the local machine, along with a Google account for accessing Google Drive. The platform offers free tier specifications including 12GB RAM, 68GB disk space, and GPU access (NVIDIA K80/T4/P4/V100, subject to availability) with a maximum session duration of 12 hours and an idle timeout of 90 minutes. The software setup involves installing essential Python libraries for data processing (numpy, pandas), visualization (matplotlib, seaborn), machine learning (sklearn, tensorflow, torch, keras), and image processing (cv2, PIL), along with proper configuration of GPU acceleration and memory management tools.
The lung cancer dataset known as the Iraq-Oncology Teaching Hospital/National Center for Cancer Diseases (IQ-OTH/NCCD) was amassed over the course of three months in the fall of 2019 in the aforementioned specialist hospitals. The dataset contains MRI scans of both healthy subjects and patients diagnosed with lung cancer at various stages. The oncologists and radiologists working at the IQ-OTH/NCCD centers annotated the slides used to create the dataset. The dataset is organized into three categories: normal, benign, and malignant. Out of these, 40 cases are classified as malignant, 15 cases as benign, and 55 cases as normal. The original format of the MRI scans was DICOM. The dataset is considered from the link https://www.kaggle.com/datasets/adityamahimkar/iqothnccd-lung-cancer-dataset. This research proposes a Linked Pixel Edge Segmentation with Least Correlated Weight Factor (LPES-LCWF) using machine learning for Lung Tumor Detection. The proposed model is compared with the traditional Weighted Discriminative Extreme Learning Machine Design for Lung Cancer Detection by an Electronic Nose System (WDEL-ENS) and Metabolic Imaging Based Sub-Classification of Lung Cancer (MIbSCLC).
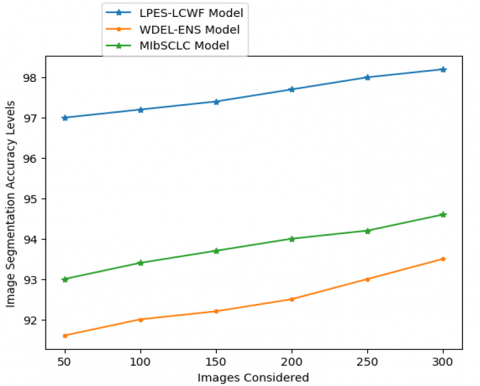
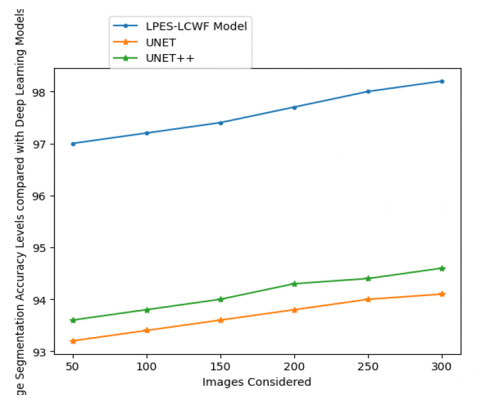
Transforming an image into a set of mask or label representable pixel regions is what image segmentation is all about. If an image is segmented, then only the relevant parts of the image need to be processed, rather than the complete image. The proposed model performs segmentation on MRI images to consider the relevant portion to perform pixel extraction. The Table 1 and Figure 5 shows the Image Segmentation Accuracy Levels of the proposed and existing models and the Image Segmentation Accuracy Levels compared with Deep Learning Models are shown in Table 2 and Figure 6.
Table 1. Image segmentation accuracy levels
|
Images Considered |
Models Considered |
||
|
LPES-LCWF Model |
WDEL-ENS Model |
MIbSCLC Model |
|
|
50 |
97 |
91.6 |
93 |
|
100 |
97.2 |
92 |
93.4 |
|
150 |
97.4 |
92.2 |
93.7 |
|
200 |
97.7 |
92.5 |
94 |
|
250 |
98 |
93 |
94.2 |
|
300 |
98.2 |
93.5 |
94.6 |
Figure 5. Image segmentation accuracy levels
Figure 6. Image segmentation accuracy levels compared with deep learning models
Table 2. Image segmentation accuracy levels compared with deep learning models
|
Images Considered |
Models Considered |
||
|
LPES-LCWF Model |
UNET |
UNET++ |
|
|
50 |
97 |
93.2 |
93.6 |
|
100 |
97.2 |
93.4 |
93.8 |
|
150 |
97.4 |
93.6 |
94 |
|
200 |
97.7 |
93.8 |
94.3 |
|
250 |
98 |
94 |
94.4 |
|
300 |
98.2 |
94.1 |
94.6 |
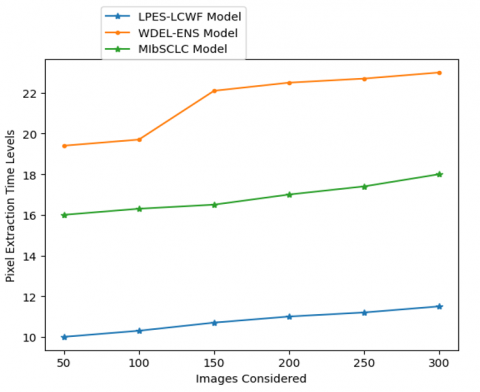
Image data is segmented into useful and useless parts throughout the processing phase. On the image segments, the pixel extraction is applied. In order to detect edges, the collected pixels will undergo a pixel similarity check. The pixel extraction time levels of the proposed and existing models are shown in Table 3 and Figure 7.
Table 3. Pixel extraction time levels
|
Images Considered |
Models Considered |
||
|
LPES-LCWF Model |
WDEL-ENS Model |
MIbSCLC Model |
|
|
50 |
10 |
19.4 |
16 |
|
100 |
10.3 |
19.7 |
16.3 |
|
150 |
10.7 |
22.1 |
16.5 |
|
200 |
11 |
22.5 |
17 |
|
250 |
11.2 |
22.7 |
17.4 |
|
300 |
11.5 |
23 |
18 |
Figure 7. Pixel extraction time levels
Figure 8. Edge detection accuracy levels
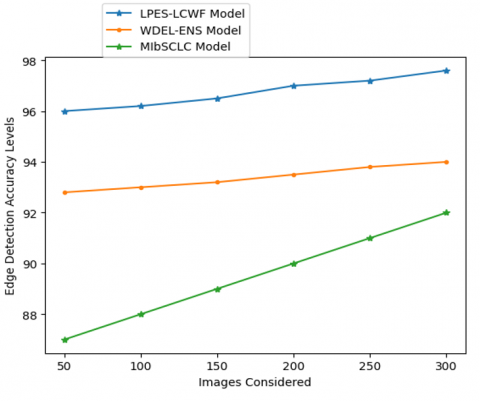
Table 4. Edge detection accuracy levels
|
Images Considered |
Models Considered |
||
|
LPES-LCWF Model |
WDEL-ENS Model |
MIbSCLC Model |
|
|
50 |
96 |
92.8 |
87 |
|
100 |
96.2 |
93 |
88 |
|
150 |
96.5 |
93.2 |
89 |
|
200 |
97 |
93.5 |
90 |
|
250 |
97.2 |
93.8 |
91 |
|
300 |
97.6 |
94 |
92 |
Table 5. Edge detection accuracy levels compared with deep learning models
|
Images Considered |
Models Considered |
||
|
LPES-LCWF Model |
UNET |
UNET++ |
|
|
50 |
96 |
93 |
93.4 |
|
100 |
96.2 |
93.3 |
93.8 |
|
150 |
96.5 |
93.5 |
94 |
|
200 |
97 |
93.8 |
94.3 |
|
250 |
97.2 |
94 |
94.6 |
|
300 |
97.6 |
94.2 |
94.8 |
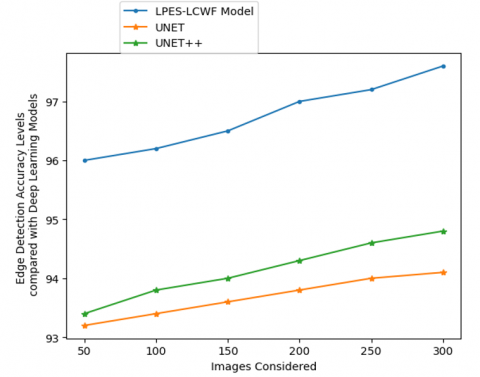
Image processing algorithms are often tasked with locating the edges of objects in MRI images. The way it works is by sensing when there are abrupt changes in light levels. Edge detection is used for picture segmentation and data extraction in domains including computer vision, machine vision, and image analysis. The edge detection accuracy levels of the existing and proposed models are depicted in Table 4 and Figure 8. Table 5 and Figure 9 show the edge detection accuracy levels compared with deep learning models.
Figure 9. Edge detection accuracy levels compared with deep learning models
Figure 10. Feature extraction time levels
Table 6. Feature extraction time levels
|
Images Considered |
Models Considered |
||
|
LPES-LCWF Model |
WDEL-ENS Model |
MIbSCLC Model |
|
|
50 |
13.4 |
17 |
21 |
|
100 |
13.7 |
17.2 |
21.6 |
|
150 |
14 |
17.5 |
22 |
|
200 |
14.3 |
17.8 |
22.4 |
|
250 |
14.7 |
18.2 |
23 |
|
300 |
15 |
18.5 |
24 |
Table 7. Feature extraction time levels compared with deep learning models
|
Images Considered |
Models Considered |
||
|
LPES-LCWF Model |
UNET |
UNET++ |
|
|
50 |
13.4 |
16 |
17 |
|
100 |
13.7 |
16.4 |
17.3 |
|
150 |
14 |
16.6 |
17.6 |
|
200 |
14.3 |
17 |
17.8 |
|
250 |
14.7 |
17.3 |
18 |
|
300 |
15 |
17.5 |
18.2 |
Table 8. Feature weight allocation time levels
|
Images Considered |
Models Considered |
||
|
LPES-LCWF Model |
WDEL-ENS Model |
MIbSCLC Model |
|
|
50 |
17 |
19.5 |
25.8 |
|
100 |
17.3 |
19.8 |
26 |
|
150 |
17.8 |
20 |
26.2 |
|
200 |
18 |
20.3 |
26.5 |
|
250 |
18.4 |
20.5 |
26.7 |
|
300 |
18.6 |
21 |
27 |
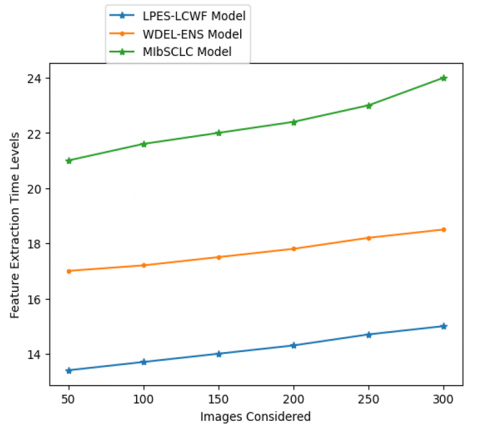
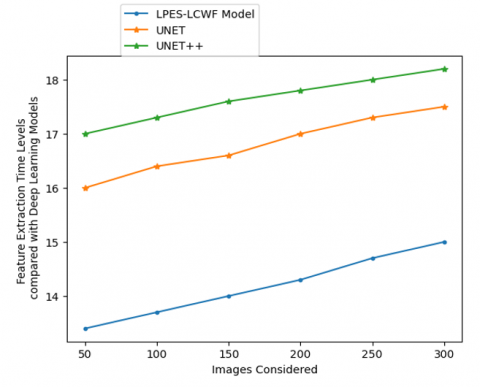
By eliminating unnecessary information, feature extraction cleans up the dataset. In the end, data reduction aids model construction with less machine effort and boosts the pace of machine learning's learning and generalization phases. Table 6 and Figure 10 represent the feature extraction time levels of the proposed and existing models. Table 7 and Figure 11 show the feature extraction time levels compared with deep learning models.
Figure 11. Feature extraction time levels compared with deep learning models
Figure 12. Feature weight allocation time levels
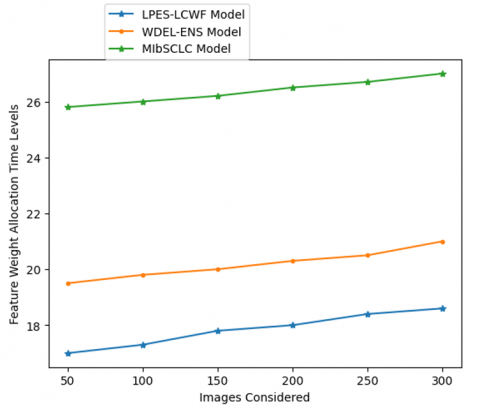
The extracted features will undergo weight allocation. The weights are allocated based on the correlation factor. The weakly correlated features are allocated with highest weight. The training is performed based on the allocated weights. The Feature Weight Allocation Time Levels of the existing and proposed models are shown in Table 8 and Figure 12.
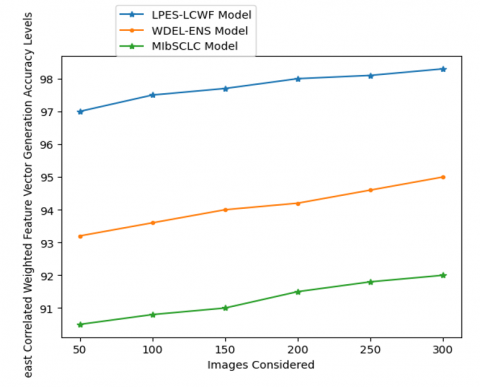
Table 9 represents the accuracy levels of least correlated weighted feature vector generation, and Table 10 represents the overall comparison of the proposed model with traditional models. The proposed model, from the weights allocated to the extracted features, generates the least correlated weighted feature set. The final feature vector is used to train the machine learning model for accurate lung cancer detection. The least correlated weighted feature vector generation accuracy levels of the existing and proposed models are shown in Table 9 and Figure 13. Table 10 presents the overall comparison of the proposed model with the traditional models.
Table 9. Least correlated weighted feature vector generation accuracy levels
|
Images Considered |
Models Considered |
||
|
LPES-LCWF Model |
WDEL-ENS Model |
MIbSCLC Model |
|
|
50 |
97 |
93.2 |
90.5 |
|
100 |
97.5 |
93.6 |
90.8 |
|
150 |
97.7 |
94 |
91 |
|
200 |
98 |
94.2 |
91.5 |
|
250 |
98.1 |
94.6 |
91.8 |
|
300 |
98.3 |
95 |
92 |
Table 10. Overall Comparison
|
Metrics Considered |
Models Considered |
||
|
LPES-LCWF Model |
WDEL-ENS Model |
MIbSCLC Model |
|
|
Dice similarity coefficient |
0.82 |
0.85 |
0.89 |
|
Jaccard index |
0.74 |
0.79 |
0.82 |
|
Sensitivity |
0.97 |
0.91 |
0.88 |
|
Specificity |
0.96 |
0.93 |
0.87 |
|
Precision |
0.98 |
0.94 |
0.89 |
Figure 13. Least correlated weighted feature vector generation accuracy levels
Lung cancer is the primary killer of people in several regions. Many studies have been proposed as potential solutions to this problem, but none of them have worked so far since they all use the same approach to the problem of lung cancer, which is to divide the data into categories and then analyze those categories. Extensive experiments have been conducted to enhance segmentation and classification results. This motivated us to develop an MRI imaging-based, lung cancer diagnostic system. Segmentation refers to the process of separating an input image into a collection of visually distinct areas, where the union of any two neighboring parts does not result in a visually confusing mode. There have been many different approaches to segmentation put forth. The field of medicine has made extensive use of image segmentation for disease diagnosis in recent years. The proposed technology provides a new way to analyze MRI scans for the detection of lung cancer. This research proposes a Linked Pixel Edge Segmentation with Least Correlated Weight Factor using machine learning for Lung Tumor Detection. The proposed method is effective enough to aid radiologists and doctors in the fight against lung cancer, with extremely promising segmentation and feature set generation outcomes. The proposed model considers the highly weighted feature vector set to train the machine learning model. The proposed model, when tested on MRI images, generates the most important feature set to train the model for accurate lung tumor prediction. The proposed model achieves 98.3% accuracy in weighted feature set generation. In the future, the proposed model can be applied with hybrid optimization techniques that reduce the feature set further for enhancing the tumor prediction rate.
[1] Zhao, L., Qian, J., Tian, F., Liu, R., Liu, B., Zhang, S., Lu, M. (2021). A weighted discriminative extreme learning machine design for lung cancer detection by an electronic nose system. IEEE Transactions on Instrumentation and Measurement, 70: 1-9. https://doi.org/10.1109/TIM.2021.3084312
[2] Hu, H., Li, Q., Zhao, Y., Zhang, Y. (2021). Parallel deep learning algorithms with hybrid attention mechanism for image segmentation of lung tumors. IEEE Transactions on Industrial Informatics, 17(4): 2880-2889. https://doi.org/10.1109/TII.2020.3022912
[3] Tang, P., Yang, X., Nan, Y., Xiang, S., Liang, Q. (2021). Feature pyramid nonlocal network with transform modal ensemble learning for breast tumor segmentation in ultrasound images. IEEE Transactions on Ultrasonics, Ferroelectrics, and Frequency Control, 68(12): 3549-3559. https://doi.org/10.1109/TUFFC.2021.3098308
[4] Bicakci, M., Ayyildiz, O., Aydin, Z., Basturk, A., Karacavus, S., Yilmaz, B. (2020). Metabolic imaging based sub-classification of lung cancer. IEEE Access, 8: 218470-218476. https://doi.org/10.1109/ACCESS.2020.3040155
[5] Xiang, D., Zhang, B., Lu, Y., Deng, S. (2023). Modality-specific segmentation network for lung tumor segmentation in PET-CT images. IEEE Journal of Biomedical and Health Informatics, 27(3): 1237-1248. https://doi.org/10.1109/JBHI.2022.3186275
[6] Tahmasebi, N., Boulanger, P., Yun, J., Fallone, G., Noga, M., Punithakumar, K. (2020). Real-time lung tumor tracking using a CUDA enabled nonrigid registration algorithm for CT. IEEE Journal of Translational Engineering in Health and Medicine, 8: 1-8. https://doi.org/10.1109/JTEHM.2020.2989124
[7] Zhou, Z., Siddiquee, M.M.R., Tajbakhsh, N., Liang, J. (2020). UNet++: Redesigning skip connections to exploit multiscale features in image segmentation. IEEE Transactions on Medical Imaging, 39(6): 1856-1867. https://doi.org/10.1109/TMI.2019.2959609
[8] Jiang, J., Hu, Y. C., Tyagi, N., Rimner, A., et al. (2020). PSIGAN: Joint probabilistic segmentation and image distribution matching for unpaired cross-modality adaptation-based CT segmentation. IEEE Transactions on Medical Imaging, 39(12): 4071-4084. https://doi.org/10.1109/TMI.2020.3011628
[9] Lyu, F., Ma, A.J., Yip, T.C.F., Wong, G.L.H., Yuen, P.C. (2021). Weakly supervised liver tumor segmentation using couinaud segment annotation. IEEE Transactions on Medical Imaging, 41(5): 1138-1149. https://doi.org/10.1109/TMI.2021.3132905
[10] Zhang, D., Huang, G., Zhang, Q., Han, J., Han, J., Wang, Y., Yu, Y. (2020). Exploring task structure for brain tumor segmentation from multi-modality MR images. IEEE Transactions on Image Processing, 29: 9032-9043. https://doi.org/10.1109/TIP.2020.3023609
[11] Sathe, P., Mahajan, A., Patkar, D., Verma, M. (2024). End-to-end fully automated lung cancer screening system. IEEE Access, 12: 108515-108532. https://doi.org/10.1109/ACCESS.2024.3435774
[12] Jiang, W., Zhi, L., Zhang, S., Zhou, T. (2024). A dual-branch framework with prior knowledge for precise segmentation of lung nodules in challenging CT scans. IEEE Journal of Biomedical and Health Informatics, 28(3): 1540-1551. https://doi.org/10.1109/JBHI.2024.3355008
[13] Rehman, A., Harouni, M., Zogh, F., Saba, T., Karimi, M., Alamri, F.S., Jeon, G. (2024). Detection of lungs tumors in CT scan images using convolutional neural networks. IEEE/ACM Transactions on Computational Biology and Bioinformatics, 21(4): 769-777. https://doi.org/10.1109/TCBB.2023.3315303
[14] Nan, Y., Del Ser, J., Tang, Z., Tang, P., et al. (2024). Fuzzy attention neural network to tackle discontinuity in airway segmentation. IEEE Transactions on Neural Networks and Learning Systems, 35(6): 7391-7404. https://doi.org/10.1109/TNNLS.2023.3269223
[15] Gunawan, R., Tran, Y., Zheng, J., Nguyen, H., Carrigan, A., Mills, M.K., Chai, R. (2024). Combining multistaged filters and modified segmentation network for improving lung nodules classification. IEEE Journal of Biomedical and Health Informatics, 28(9): 5519-5527. https://doi.org/10.1109/JBHI.2024.3405907
[16] Zhu, L., Cai, Y., Liao, J., Wu, F. (2024). Lung parenchyma segmentation based on U-Net fused with shape stream. IEEE Access, 12: 29238-29251. https://doi.org/10.1109/ACCESS.2024.3365577
[17] Guan, P., Yu, K., Wei, W., Tan, Y., Wu, J. (2024). Big data analytics on lung cancer diagnosis framework with deep learning. IEEE/ACM Transactions on Computational Biology and Bioinformatics, 21(4): 757-768. https://doi.org/10.1109/TCBB.2023.3281638
[18] Kang, S., Kang, Y., Tan, S. (2024). Exploring and exploiting multi-modality uncertainty for tumor segmentation on PET/CT. IEEE Journal of Biomedical and Health Informatics, 28(9): 5435-5446. https://doi.org/10.1109/JBHI.2024.3397332
[19] Cheke, R., Eising, C., Denny, P., van de Ven, P. (2024). PatchLoc: Embedded patch localization pretext task for tumor segmentation in medical images. IEEE Access, 12: 66845-66857. https://doi.org/10.1109/ACCESS.2024.3399628
[20] Bi, L., Fu, X.H., Liu, Q.F., Song, S.L., Feng, D.D., Fulham, M., Kim, J. (2024). Co-learning multimodality PET-CT features via a cascaded CNN-transformer network. IEEE Transactions on Radiation and Plasma Medical Sciences, 8(7): 814-825. https://doi.org/10.1109/TRPMS.2024.3417901
[21] Cai, H., Liao, Y., Zhu, L., Wang, Z., Song, J. (2024). Improving cancer survival prediction via graph convolutional neural network learning on protein-protein interaction networks. IEEE Journal of Biomedical and Health Informatics, 28(2): 1134-1143. https://doi.org/10.1109/JBHI.2023.3332641
[22] Long, C., Xu, H., Shen, Q., Zhang, X. (2020). Diagnosis of the Coronavirus disease (COVID-19): rRT-PCR or CT? European Journal of Radiology, 126. https://doi.org/10.1016/j.ejrad.2020.108961
[23] Jiang, J., Hu, Y.-C., Liu, C.-J., Halpenny, D. (2019). Multiple resolution residually connected feature streams for automatic lung tumor segmentation from CT images. IEEE Transactions on Medical Imaging, 38(1): 134-144. https://doi.org/10.1109/TMI.2018.2857800
[24] Dong, X., Lei, Y., Wang, T., Thomas, M., et al. (2019). Automatic multiorgan-segmentation in thorax CT images using U-net-GAN. Medical Physics, 46(5): 2157-2168. https://doi.org/10.1002/mp.13458
[25] Mu, R., Zeng, X. (2019). A review of deep learning research. KSII Transactions on Internet and Information Systems, 13(4): 1738-1764. https://doi.org/10.3837/tiis.2019.04.001
[26] El-Regaily, S.A., Salem, M.A.M., Aziz, M.H.A. (2017). Lung nodule segmentation and detection in computed tomography. In Proceedings of the 7th International Conference on Intelligent Computing and Information Systems, Cairo, Egypt, pp. 257-269. https://doi.org/10.1109/INTELCIS.2017.8260029
[27] Mukherjee, S., Huang, X., Bhagalia, R.R. (2017). Lung nodule segmentation using deep learned prior based graphcut. In Proceedings of the 2017 IEEE International Symposium on Biomedical Imaging, Melbourne, VIC, Australia, pp. 178-199. https://doi.org/10.1109/ISBI.2017.7950733
[28] Wang, S., Zhou, M., Gevaert, O. (2017). A multi view deep convolutional neural networks for lung nodule segmentation. In Proceedings of the 39th Annual International Conference of the IEEE Engineering in Medicine and Biology Society, Jeju, Korea (South), pp. 2232-2245. https://doi.org/10.1109/EMBC.2017.8037182
[29] Hesamian, M.H., Jia, W., He, X., Kennedy, P. (2019). Deep learning techniques for medical image segmentation: Achievements and challenges. Journal of Digital Imaging, 32(4): 582-596. https://doi.org/10.1007/s10278-019-00227-x