V. Ramya*![]() | R. Jayaparvathy
| R. Jayaparvathy![]()
© 2025 The authors. This article is published by IIETA and is licensed under the CC BY 4.0 license (http://creativecommons.org/licenses/by/4.0/).
OPEN ACCESS
Diagnosing diabetic retinopathy (DR) is essential to keeping patients' vision intact. Since the fovea and optic disc (OD) are significant retinal factors, it is important to recognize them, but because these procedures are intricate, there is a risk of overfitting, complexity, and errors. Hence introduced the Intensified U-Net framework (IUNetA), which locates using retinal images' optic disc and fovea to address DR. With a Wiener filter for noise reduction and skip connections for low-level image information, the architecture comprises of an encoder, decoder, skip connections, and a special Atrous Convolution Double Residual Block (ACDRB). To solve the semantic gap issue, a Cocktail Attention Block (CAB) is incorporated into the skip connection. Channel compression is achieved via a 1x1 convolution layer. In order to alleviate the vanishing gradient issue, the decoder block uses encoded feature maps to retrieve segmented object information. The tangent function is then used to calculate the final output. Especially, the analysis is carried out by IDRID dataset, the IUNetA attains the accuracy as 99.9%, IoU attained 89.17%, Sensitivity attained 90% and Dice Similarity Coefficient (DSC) attained 99.14% when compared to Prior models. Thus, the overall architecture is accurately segmented and localized the optic disc and fovea in the DR.
diabetic retinopathy (DR), intensified UNet architecture (IUNetA), optic disc (OD), fovea, filter, cocktail attention block (CAB)
Globally, diabetic retinopathy (DR) is an extremely typical reason for vision degradation. It ranks among the most prevalent factors in avoidable blindness and vision disability [1]. For the screening and identification of several retinal disorders, including DR, Macular Edoema (ME), age-related macular degeneration (AMD), and glaucoma, it is crucial to understand the conditions of the optic disc (OD) and fovea (the macula centre) in the retinal image [2, 3]. The OD is the area where the vasculature starts, collects, or converges because it is the most significant component in the retina [4]. Although the OD size changes from person to person, the disc's width (80-100 pixels) remains fairly constant for a typical fundus image [5]. Additional retinal components, such as the macula and fovea can be easily located by using the OD as a landmark [6].
Anatomical structure location can aid in the automated recognition of additional functional structures. For instance, OD localization has historically been employed as an indicator for identifying the fovea [7]. The macula is the region of the fundus that has the highest number of cones, the visual system's color receptors. It looks darker than the remainder of the retinal backdrop [8]. The enormous fundus image area makes it difficult to identify OD and fovea centres with accuracy. In human pose estimation tasks, N heat maps representing the human body's main joints are produced by a Convolutional Neural Network (CNN) after training, which can be linked to the issue of locating the centres of the OD and fovea [9]. The detection of the OD allows for the estimation of other factors, such as vessel breadth or tortuosity, based on its location and radius. The vessels must typically be near to the OD when quantifying key characteristics from an image of the fundus in order to be taken into account for parameter computation. Identifying the right or left eye from whence the image was taken would also be possible using OD detection [10].
For the purpose of identifying DR-related lesions in the color retinal fundus images, researchers have created a number of automatic algorithms over the past two decades [11]. Divided the OD and fovea into segments using automatic methods has been suggested in numerous studies. Many various types of methods depending on active contour, watershed transformation, morphological operation, template, etc. have been proposed as a result of extensive research into methods for searching the FOVEA and OD [12]. Previous research used the linear regression to locate the OD's location in retinal pictures. A simple approach that combined pre-processing and dictionary matching was used in the research. But it displayed a poorer result [13].
Additionally, a number of localization techniques using the binary mask's geometric centre as their centre after first segmenting the OD and Fovea. However, the effectiveness of these Conventional methods largely depends on the binary mask's representation of the object's form [14]. The model is trained using only a few ground facts and the bounding-box level labels in the conventional approach. However, in completely supervised semantic segmentation, a lot of effort is required to label the ground truth [15]. The segmentation of OD and OC is necessary to determine the Cup to Disc Ratio value, but conventional methods require more time and don't produce reliable results. In order to effectively identify glaucoma, automated OC and OC segmentation is crucial [16]. The earlier techniques use polar transformation as the initial step with unknown values. They cannot take advantage of all supervisory signals integrating the extracted features because the hyper parameter is not the best for effective training and segmentation assessment [17]. Hence, a novel framework is necessary to develop for mitigate the difficulties in the DR.
The significant contribution of the work is enumerated as follows
The article is organized as follows for the remaining portion: The Introduction is covered in Section 1, the Related Works of the Existing Methods are illustrated in Section 2, the Proposed Method is presented in Section 3, the Results of the Proposed Method are discussed in Section 4, and the Article is concluded in Section 5.
Wang et al. [18] offered the U-Net model, a classical CNN-based coarse-to-fine deep learning framework, to precisely recognize the OD. The segmentation outcomes from the complete image were divided into two distinct groups after the grayscale vessel density maps and colour fundus images were used to independently train this network. A region of the local image (disc candidate area) was found by combining the outcomes using an overlap approach, and for further segmentation, it was then added to the U-Net model. Due to the impact of parapapillary atrophy, subjective bias, and vessel density maps, the OD's position is not sufficiently indicated in the ground truth for the OD in color fundus images.
Bhatkalkar et al. [19] offered an entirely novel CNN design in order to precisely separate the OD in fundus images. The encoder and decoder are connected by means of a novel attention module, DeepLab v3+ and U-Net models' fundamental architectures are modified in order to achieve the highest level of accuracy. To improve the performance of these designs even more, employ conditional random fields that are fully related. However, adding attention gates to the U-Net architecture increases the computational complexity of the model, which can lead to longer training times and higher memory requirements.
Tang et al. [20] offered HBA-U-Net: a hierarchical bottleneck attention-enhanced U-Net backbone. In order emphasize retinal anomalies that might be crucial for segmentation of the OD and fovea in the degenerating retina, the network is made up of self-attention, channel attention, and relative-position attention are combined and improved in this unique bottleneck attention block. However, requires a large number of annotated images, which can be difficult to obtain in medical applications. This can lead to overfitting, where the model memorizes specific image features instead of learning to generalize to new images.
Yadav et al. [21] offer a cascaded two-stage U-Net network with compressed versions of both networks for intra-retinal layer segmentation (CCU-INSEG). The division of retinal tissue from optical coherence tomography OCT B-scans is carried out by the first network. The second network accurately separates 8 intra-retinal layers. The model size as well as parameters in the first and second networks are reduced by 392 and 26 times, respectively, through the compression of U-Net. Even so, the technique achieves nearly identical accuracy to U-Net without requiring more processing power or Storage resource limitations. Introduced Laplacian-based outlier identification using adaptive non-linear interpolation for layer surface cavity filling during the post-processing step. However, the generalizability, controlling longitudinal data, and particular restricted situations of retinal features are still limited.
Bengani et al. [22] proposed a new deep learning model that makes use of semi-supervised learning and transfer learning to autonomously segment the OD in images of the retinal fundus. The Kaggle dataset for DR contains a significant number of unlabeled fundus images, which are used to train a convolutional autoencoder (CAE) to autonomously acquire features. By recreating the input images, the autoencoder (AE) becomes a pre-trained network as it gathers more characteristics from the unlabeled images. Next, a network for segmentation is created using the pre-trained autoencoder network. Next, utilizing retinal fundus images and the corresponding OD ground truth images from the DRISHTI GS1 and RIM-ONE datasets, the segmentation network is trained using transfer learning. However, the pre-trained CAE model could not be used to perform other tasks, such as segmenting the vessels or the fovea or identifying illnesses.
Wang et al. [23] offered a deep learning technique for macula fovea identification on ultra-wide field fundus (UWF) images. Using approaches based on U shape network (U-Net) and Fully Convolutional Networks (FCN), 1800 training fundus images (before increasing process), 400 validation images (before amplifying process), and 100 test images (before amplifying process) are employed. The fovea was marked by three qualified ophthalmologists. The investigation of a technique comes from the anatomical perspective. This method is based on the spatial arrangement of the OD centre and macula fovea in the UWF. Based on the expertise of ophthalmologists, a set of criteria for this technique are established and proven to be efficient. There are probably a few variations among the OD-fovea distance guidelines for UWF with various eye diseases, however, taking into account the high max error and the degree of dispersion of this technique.
Bilal et al. [24] proposed a novel, two-stage structure for automatic DR classification. Two distinct U-Net models were used in the initial phase to segment the OD and blood vessels (BV) during preprocessing. The improved retinal images obtained from the OD and BV extraction process are then fed into the transfer learning-based model VGGNet in the second step, which detects DR by detecting biomarkers for retinal haemorrhages (HM), exudates (EX), and microaneurysms (MA). However, it has not enhanced the classification performance and cannot be used to diagnose other eye illnesses like cataracts and glaucoma.
David et al. [25] offered an enhanced design known as U-Net to segment retinal vessels. By incorporating the traditional U-Net incorporates a substantial square and a multiscale input layer in order to increase image segmentation accuracy, the offered traditional U-Net enables the use of all available spatial setting information. Retinal vessel segmentation is the process of separating the arteries in retinal images. Dense image values can be used to measure blood artery density. The real worth of eye blood vessels for medical diagnostics is being built, in large part, through the use of data augmentation and analytics. The automated segmentation of retinal arteries by the proposed method shows a lot of promise. However, the supplied picture may have noise sensitivity, which might result into inaccuracies in the segmentation results.
Skouta et al. [26] proposed a modified CNN-U-Net architecture for the detection of retinal HM in fundus images. For segmentation and identification of potential locations with retinal HM, the proposed U-Net was trained using a GPU and the IDRiD dataset. Then utilized preprocessing to increase the data and improve the quality of images, which are crucial for describing the intricate features needed for the segmentation task. However, DR becomes regenerative if the HM become more complicated.
Xiong et al. [27] anticipated a weak label based Bayesian U-Net that uses annotations based on the Hough transform to separate the ODs in fundus images. In order to do this, develop a probability graphical model and investigate a Bayesian strategy using the U-Net framework. Estimating the OD filter and updating the weights of the Bayesian U-Net are done as part of the model's optimization using the expectation-maximization method, respectively. However, the segmentation precision attained is still less accurate than that of models taught using expert-manually annotated ground truth labels.
As a result, retinal characteristics are still restricted, the OD's position is not sufficiently highlighted, and the computational cost of adding attention is increased by the need for a large number of annotated images, which can lead to overfitting. It is impossible to segment the arteries, the fovea, or diagnose diseases effectively, as variations in the OD-Fovea distance guidelines for different eye diseases and the lack of enhanced classification further complicate the diagnosis. HM are complex, segmentation precision is lower, and noise in the input image causes errors. Furthermore, prior methods such as hierarchical bottleneck attention blocks, cascaded two-stage networks, and weak-label-based models face challenges like generalizability, noise sensitivity, and excessive computational complexity. These limitations emphasize the necessity for a robust and efficient approach that not only addresses the segmentation and localization of retinal features like the OD and fovea but also enhances the overall accuracy and adaptability of DR detection. Hence, a novel IU-NetA framework is proposed to overcome these challenges by mitigating overfitting, improving segmentation precision, and optimizing computational efficiency.
3.1 Basic U-Net
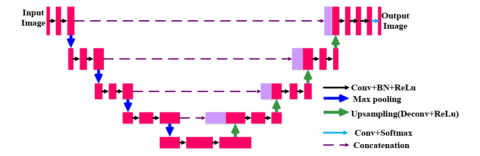
The U-Net architecture is a popular and effective paradigm for segmenting medical images. It has a U-shaped design made up of an encoder path and a symmetric decoder path. The model can record both local information and information about the overall context because of this U-shaped design which is shown in Figure 1. Convolutional and pooling layers are utilized in the encoder route to gradually downscale the input image, which aids in the process of extracting prominent features and gathering contextual data. Each down-sampling step shrinks the feature maps' spatial size while increasing their depth. To enable data to move from the encoder to the decoder, skip connections are introduced. The relevant layers among the encoder and decoder routes are directly connected by these links. The encoder's superior resolution characteristics can be obtained by the decoder due to skip connections and act as a shortcut for the gradient flow during training. The decoder path performs up-sampling of the feature maps using deconvolution layers or up-sampling followed by convolutional layers. The feature maps' spatial resolution is gradually restored by this procedure while retaining the contextual information learned by the encoder. Skip connections combine the feature maps of the encoder and decoder; this refines the segmentation outcome. Figure 1 illustrates the U-Net architecture [28].
Figure 1. U-Net architecture
3.2 Intensified UNet framework
The retina's MA, HM, hard EX, and soft EX are indicative of DR, a major cause of blindness or visual impairment. Important anatomical features for diagnostic evaluations on fundus pictures of the eyes include the OD and fovea. Researchers have solved segmenting these structures' challenges which can result in overfitting, computational complexity, and inaccuracies by utilizing machine learning and deep learning techniques. It is challenging to distinguish the OD and fovea precisely because of their proximity to other retinal structures. To address these challenges, an intensified UNet framework has been proposed, which involves using a Wiener filter to preprocess the information in order to eliminate speckle noise, extract features, and locate the OD and fovea. The ACDRB is used by the encoder and decoder in the Proposed IUNetA in place of the convolution layer. The encoder and decoder also include a skip connection. While skip connections integrate low-level picture information from the encoder unit with high-level image features from the decoder unit, the ACDRB retrieves dense features without raising parameters. To address the problem of semantic gaps, the skip connection is coupled with the CAB. On maps of features with many channels, the SE block is used to highlight key channels, giving a higher weight to channels with significant semantic information. Channel compression is achieved via a 1×1 convolution layer. From the encoding feature maps, the decoder block retrieves segmented object information; each segment includes the ACDRB and the up-sampling layer. Rather than using the sigmoid function, which has gradient limits and may result in vanishing gradient issues, the final output is obtained via the tangent function. The tangent function has a wider range for faster learning and grading, making it more useful for localizing the OD and fovea. Thus, the overall architecture is segmented and localized the OD and fovea in the DR. Figure 2 depicts the process flow of the IUNet architecture. The Wiener filter will be discussing in the below section.
Figure 2. Process flow of the IUNetA
3.2.1 Wiener filter
A low-pass filter called the Wiener filter can be used in many situations to improve signals that have been weakened by noise. The statistical method used to develop the filter makes the assumption that the signal and noise are stationary linear stochastic processes with well-defined spectral properties. This approach achieves an ideal balance in the tradeoff between bias and variance, which leads to its higher performance. Alternatively stated the Wiener filter is an adaptive filter that determines the neighborhood's mean and variance before applying less smoothing when variation is high and more smoothing when variation is low.
The error between the original signal and the predicted signal is reduced by the filter. The error measure for an uncorrupted picture $i$ and an estimated image $\hat{\imath}$ is as follows is given by Eq. (1):
$e^2=E\left\{(i-\hat{\imath})^2\right\}$ (1)
where, the argument's anticipated value is denoted by $E\{.\}$. Consequently, the task of determining the quadratic error function's minimum simplifies the process of generating an estimated image. In order to do this, the frequency domain is employed, and the subsequent presumptions are made: The noise and image have no correlation, a zero mean, and a linear function that diminishes the intensity levels in the estimated picture. The error function's minimum is provided when these requirements are met is given as Eq. (2):
$\hat{F}(a, b)=\left[\frac{H^*(a, b) S_i(a, b)}{S_i(a, b)|H(a, b)|^2+S_i(a, b)}\right] G(a, b)$ (2)
where, $\hat{F}(a, b)$ is the frequency domain estimated image, $H(a, b)$ is the degradation function transform, $G(a, b)$ is the deteriorated image transform, $H^*(a, b)$ is the complex conjugate of $H(a, b)$, and $S_i(a, b)=|H(a, b)|^2$ is the nondegraded image power spectrum. The magnitude of the complex value squared is the result of multiplying a complex value by its conjugate, according to the filter's general principle. Consequently, the Eq. (3) is given by:
$\begin{aligned} & \hat{F}(a, b) & =\left[\frac{1}{H(a, b)} \frac{|H(a, b)|^2}{|H(a, b)|^2+S_\eta(a, b) / S_i(a, b)}\right] G(a, b)\end{aligned}$ (3)
where, the noise power spectrum is represented by $S_\eta(a, b)=$ $|N(a, b)|^2$. Since the power spectrum of the non-degraded picture is often unknown, the expression $S_\eta(a, b) / S_i(a, b)$ is substituted by a constant K. Images that have suffered from constant power additive noise can be improved with the Wiener filter while they are being processed digitally. The Wiener filter is often preferred for noise reduction due to its adaptive nature, which allows it to adjust based on the local characteristics of the image, providing effective noise removal without sacrificing important details. Unlike the Gaussian filter, which applies uniform smoothing across the entire image and may blur edges, the Wiener filter smooths areas with less variation while preserving high-variation regions. This makes it more effective in scenarios where noise characteristics are not uniform, particularly in the presence of additive white Gaussian noise (AWGN). The bilateral filter is capable of preserving edges better than the Gaussian filter, which is computationally more expensive and may not perform as well in high-noise conditions. Wiener filter outperforms the Gaussian filter in terms of noise reduction while maintaining the quality of the image. Additionally, while the bilateral filter is useful for edge preservation, its computational cost and lower efficiency in dealing with noise across varying regions make the Wiener filter a more practical choice for many applications. Therefore, the Wiener filter's ability to balance noise reduction and computational efficiency, especially in diverse noise environments, justifies its selection over other preprocessing techniques. Its parameters, including the noise's power and the neighborhood's size, effectively eliminate noise in the DR image. The IUNetA will be discussing in the upcoming section.
3.2.2 IUNetA
The IUNet-A architecture comprises an encoder, a decoder, and skip connections, where conventional convolution layers are replaced by the proposed ACDRB modules. The encoder block extracts multi-scale contextual features by progressively encoding the raw input images. The ACDRB incorporates max-pooling, batch normalization, and a ReLU layer to extract dense features without increasing the number of parameters. The contracting path (on the left) and the expanding path (on the right) of ACDRB have the equal number of residual blocks. Every step of the contracting path has an ACDRB, and down sampling is done using a 2×2 max pooling layer with a step size of 2. To ensure that minimize the size of the image without losing any important information, the convolution layer uses a predefined kernel to execute the convolution process. The kernel's receptive field determines the resultant layer of convolution. The region that the kernel sees to produce the output is known as the receptive field. Eq. (4) provides the discrete convolution process is given below:
$(F * k)(q)=\sum_{u+v=q} F(u) k(v)$ (4)
Discrete functions, like $F$ and $K$, are frequently represented as sequences. The values of these functions at indices u and v , respectively, are denoted as $F(u)$ and $k(v)$. These two functions' convolution is represented by $(F * k)(q)$.
By using the predetermined gaps in the convolution procedure, an Atrous convolution aims to expand the receptive field. Let "* $m$ " be the convolution operator for the dilation factor of " $m$ ". As a result, Eq. (5) gives the dilated convolution operation.
$\left(F *{ }_m k\right)(q)=\sum_{u+m v=q} F(u) k(v)$ (5)
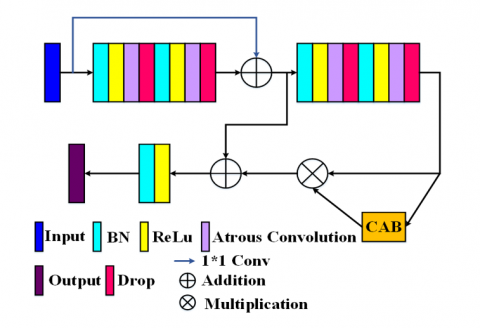
A kernel of size $i \times i$ is expanded to a size of $i+(i-1)(r-1)$ in Atrous convolution, where r is the Atrous rate. By enabling flexible multiscale information aggregation, it maintains the same resolution. The kernels' ability to expand their field of view and include a broader background is made possible by Atrous convolution. While Atrous convolution produces dense feature extraction, ordinary convolution produces sparse feature extraction. It is feasible to extract dense features without adding more parameters because, even as the filter size grows, only non-zero values will be computed. With the same number of parameters needed as a regular convolution, dilated convolutions allow exponentially larger receptive fields without sacrificing resolution. The receptive field grows with the square of the rising rate when the Atrous convolution rate is increased exponentially on subsequent layers. With the Atrous convolution rate's exponential growth, accuracy may be increased on both a qualitative and quantitative level. The research findings suggest that the network performs better when the Atrous convolution rate is consistently set to 2 on all levels. With an Atrous rate of 2, substitute the Atrous convolutional layer for each of the conventional convolutional layers. Figure 3 shows the ACDRB is given below:
Figure 3. ACDRB
Meanwhile, skip connections have been added to combine high-level image features from the decoder unit along with low-level image information from the encoder unit. In order to eliminate the semantic gap problem proposed the CAB is concatenated with the conventional skip connection which aggregates the feature map of the encoder and decoder. Up sampling using transposed convolution Regaining the image's spatial information is the purpose of transposed convolution. Convolution can be used to carry out the transposed convolution procedure. The transposed convolutional layer spreads out each point in the input picture over the output image to carry out the up sampling process. Up sampling is applied in the transposed convolution between the input image's rows and columns, as well as by padding the same. Eq. (6) provides the dimension of the output image produced by the transposed convolution:
$\begin{aligned} \ { out }=(n-1) \times & \ { stride }+ { kernel size } \\ & -2 \times { padding }\end{aligned}$ (6)
where, ' $n$ ' is the input picture size. For instance, an output image of $32 \times 32$ will be produced if the input image has the dimensions $16 \times 16$, stride $=2$, padding $=$ same, and kernel size of $2 \times 2$. Therefore, the transposed convolution layer in the suggested design doubles the size of the output picture to that of the input image concatenating with the feature maps from the contracting path that are weighted by CAB . Additionally, a $1 \times 1$ convolution layer is used for channel compression. The encoded feature maps yield the segmented object information using a decoder block. As a consequence, the up-sampling layer and ACDRB are included in each unit of the decoder block. The final output is taken from the tangent function instead of using Sigmoid function limits in the gradients at the function's extreme ends are extremely small because the input values are compressed by the sigmoid function into a small range between 0 and 1 . As a result, backpropagation may encounter the vanishing gradient problem, in which the gradients are too fragile and slow to converge or even prohibit the neural network from effectively learning. So, utilize the tangent function which increasing its potential value and it provides a larger range for quicker learning as well as grading, it will be more effective to localize the OD and fovea. The CAB will be discussing in the below section.
3.2.3 CAB
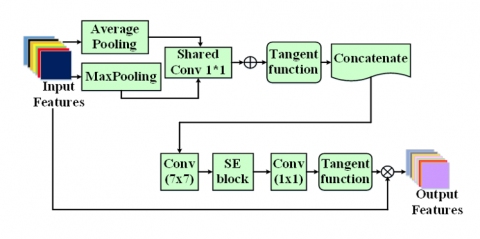
For feed-Forward CNNs, an attention module called a CAB can be incorporated to enhance representation performance. In CAB, which consists of a series of channels and spatial modules with squeeze and excitation that have been strategically created to highlight the relative aspects, several attentional module types are represented in addition to traditional attentional modules. Eventually, unimportant features are suppressed along the channel and spatial axes, respectively. Also, recent research revealed that deep CNNs' performance may be greatly enhanced by the channel attention method. Nonetheless, the majority of techniques aimed at improving performance invariably make the model more complicated. the squeeze and excitation block's dimensionality reduction process by using 1D convolution in the Efficient Channel Attention (ECA) module, which significantly decreases the model's complexity while preserving exceptional performance. Figure 4 depicts the CAB is shown above. The section that follows will discuss the IUNetA's findings.
Figure 4. CAB
Conversely, in ECA, average-pooling alone is utilized to aggregate spatial data; in contrast, max-pooling gathers additional crucial information regarding distinguishing object features in order to deduce a more precise channel-wise attention. Thus, to get more precise channel-wise attention, use both average pooling and maximum pooling while aggregating the geographical information.
Traditionally, input features $F \epsilon R^{H \times W \times C}$ using averagepoling and max-pooling on a channel basis can produce, $F_{M P} \epsilon R^{1 \times 1 \times C}$ and $F_{A P} \epsilon R^{1 \times 1 \times C}$ correspondingly, for example, at the c -th channel of the Eqs. (7) and (8) is given below:
$\begin{gathered}F_{M P}^c={Max}\left(F^c(i, j)\right), 0<c<C<i<H, 0<j \\ <W\end{gathered}$ (7)
$F_{A P}^c=\frac{1}{H \times W} \sum_{u=1}^H \sum_{j=1}^W F^c(i, j), 0<c<C$ (8)
where, $p^c(.)$ denotes the c-th channel's pixel value at a certain location, ${Max}(.)$ yields the maximum number, and H, W, and C stand for the height, width, and number of channels of the input feature F, respectively. A shared weight 1D convolutional layer receives the two descriptors after which it creates a channel attention map $M^c \in R^{1 \times 1 \times c}$. After that, CAB merging the feature vectors using channel-wise addition that were produced by the common 1D convolution. To put it briefly, the channel attention map is determined by Eq. (9):
$M(F)=\tan \left(\operatorname{Conv1D}\left(F_{A P}\right)+\operatorname{Conv} 1 D\left(F_{M P}\right)\right)$ (9)
where, the tangent function is shown by tan (.) and the 1 D convolutional layer is represented by Conv1D ().
In CAB used the spatial and channel attention with squeeze and excitation that reduced the computational complexity. The SE block, which has demonstrated strong optimization performance on several DCNNs, is a standard channel attention block that might include each channel's importance. Due to the SE block's popularity, it is now used to emphasize crucial channels on multi-channel feature maps. To make it easier to recognize, the channels with important semantic information are given a larger weight.
3.3 Localization
This subsection presents the qualitative and quantitative results for optic disk (OD) and fovea center localization using retinal images. The optic disk, the visible portion of the optic nerve head within the retina, is characterized by its oval shape and brightness compared to the surrounding retina. Pigmentation variations in normal eyes can cause differences in the appearance of the optic disk. In fundus images, many blood vessels intersect the optic disk, making it a crucial landmark for retinal analysis. Accurate localization of the optic disk is essential for distinguishing it from other retinal structures, such as EX and cotton wool spots. Optic disk localization involves finding the approximate center of the disk or enclosing it within a specific region, such as a circle or square. This task is complicated by distractors, such as the edges of blood vessels or large exudate lesions. Early methods localized the optic disk by identifying the largest cluster of bright pixels. These intensity-based algorithms were simple, fast, and effective in normal retina images with few pathologies. However, they struggled in images with yellow or white lesions, as intensity changes in these areas could mimic the brightness of the optic disk. For the proposed approach, a 2D heat map with a Gaussian-shaped intensity distribution is used for localization, with the peak of the heat map positioned at the center of the optic disk (OD) and the fovea. The IUNetA model is trained as a regression network using these heat maps, where the predicted OD and fovea center coordinates are determined by computing the argmax of the pixel values in the predicted heatmap. This approach offers a shape-independent localization method, which overcomes the limitations of earlier methods that were susceptible to noise, low contrast, and artifacts.
To address challenges presented by complex retinal images, the proposed IUNetA employs the ACDRB and CAB for reliable feature extraction and improved localization accuracy. The model is trained using 2D heatmaps centered on the ground-truth coordinates of the optic disk (OD) and fovea centers. Since the datasets provide only the coordinates of the OD and fovea centers, spherical 2D Gaussian heatmaps are generated and centered on these coordinates to train IUNetA. These heatmaps feature a bell-shaped intensity distribution, with the center representing the maximum intensity at the given coordinate. The intensity decreases following a Gaussian distribution, extending to ±3σ, where σ is the standard deviation of the Gaussian distribution.
Performance measures, comparison analysis, and the proposed architecture for findings are provided in this section. The proposed models were trained on various platforms using Python and Tensorflow together with the Keras Applications DL modules. There are 516 images with a resolution of 4288x2848 in the IDRiD collection. Retinal specialists at an eye facility in Nanded, Maharashtra, India, took these images. Pixel-level annotation for common DR abnormalities such as MA, soft exudates (SE), hard exudates (EX), OD and HM has produced a binary mask for a few colored fundus pictures. In addition, each of the 516 images has its DR severity graded. The dataset has two folders: One folder as segmentation comprises of 295 images for training and 149 images for testing and another folder as localization, which consists of 413 for training and 103 for testing. The dataset split ratio for proposed IUNetA is trained and tested as 60:40 for 50 epochs.
With a batch size of 32 and a learning rate of 0.0001, the neural networks were trained using the Adam optimizer without the inclusion of decay techniques. The dimension of the input image is 256×256 pixels with kernel size as 3. The loss was computed using the dice coefficient, one of the often-used loss functions in U-Net.
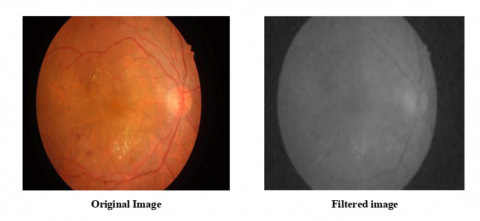
Figure 5 depicts a preprocessed image that has undergone noise reduction using a Wiener filter. Wiener filters take signal and noise properties into account while estimating the original, noise-free picture from a noisy version. The filter's efficacy is determined on the amount of noise and the quality of the image.
Figure 5. Preprocessed image
Figure 6 displays the Segmented image for OD using the proposed IUNetA. When contrast to pixels that are falsely positive or falsely negative, the IUnetA generates an OD mask that has a very high count of actual positive pixels. This illustrates the accuracy of the segmented OD border when compared to the datasets' real OD boundaries. The segmented OD results qualitatively demonstrate that the skip connection that is being suggested to make up for the encoder's lost spatial information prevents the OD borders from displaying blocky or checkerboard results. With extremely few false-positive and false-negative areas, the IUNetA can reliably extract the OD borders even when several types of lesions are present in certain pictures.
Figure 6. Segmented image for OD
Figure 7 depicts the OD centre localization using the proposed IUNetA. With the great spatial resolution of the original fundus images, the outcomes are typically considered adequate for centre localization. Intensified U-Net locates the optic disc centre in retinal pictures with accuracy. To capture finely detailed patterns and features, it makes use of several layers and feature extraction. The network detects the optic disc centre even in poor or weakened images by adjusting to noise, occlusions, and image quality.
Figure 7. OD centre localization
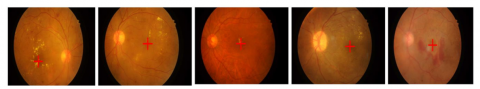
Figure 8 depicts the Fovea centre localization using the proposed IUNetA. The localization of the fovea centre with the IUNetA has produced remarkable outcomes. By using the sophisticated features of the IUNetA, the system is able to accurately and robustly identify the fovea center's precise position in retinal pictures. The reliability of fovea centre localization has been significantly improved by the IUNetA’s ability to capture minute details and complicated elements within the pictures, as well as its capability to manage complex fluctuations in image quality.
Figure 8. Fovea centre localization
To evaluate the model's performance using several measures, including sensitivity, IoU, DSC and accuracy. Using a range of measures, overfitting and inadequate parameter tuning were discovered after the model was constructed. The section below provides a description of the performance metrics.
Accuracy: A statistics measure called accuracy that evaluates the accuracy to which the real or anticipated value coincides with the observed or predicted value. To calculate accuracy, multiply the outcome by 100 and divide the total number of forecasts by the number of accurate forecasts.
${ Accuracy }=\frac{T N+T P}{T P+T N+F P+F N}$
Intersection over Union (IoU): Intersection over union is a frequently used measure in object identification algorithms to evaluate localization accuracy and compute localization faults. To calculate IoU, the overlap between the ground truth and anticipated annotations is divided by their union. By dividing the intersection of two sets by their union, the similarity between two sets is computed.
$IoU=\frac{T P}{T P+F P+F N}$
Sensitivity: The measure employed to evaluate a model's predictive power for true positives in each accessible category is called sensitivity. Sensitivity is calculated as the ratio of true positive results to the total of true positive and false negative results.
$Sensitivity =\frac{T P}{T P+F N}$
Dice Similarity Coefficient (DSC): The DSC measures the similarity between two sets, commonly used in segmentation tasks. It ranges from 0 (no overlap) to 1 (perfect overlap), calculated by taking twice the intersection of the sets divided by the sum of their sizes. This metric is crucial for evaluating segmentation accuracy, especially in medical imaging.
$D S C \cdot=\frac{2 \times T P}{2 \times T P+F P+F N}$
The proposed IUNetA, which reduced the overfitting, complexity errors, and inconsistency enhanced the resolution that accuracy attained 99.9%, IoU attained 89.17%, sensitivity attained 90%, and a DSC attained 99.14%. Based on these performance metrics, the DR of the optic and fovea was accurately segmented and localized by the model. Table 1 depicts the performance metrics of proposed method.
Table 1. Performance metrics of proposed architecture
|
Metrics |
Performance (%) |
|
Accuracy |
99.9 |
|
Intersection Over Union (IoU) |
89.17 |
|
Sensitivity |
90 |
|
DSC |
99.14 |
Table 2 presents the performance analysis of the model by varying the training and testing data split ratios, evaluated using accuracy, Intersection over Union (IoU), sensitivity, and Dice coefficient (DSC). The 90:10 split achieves the highest accuracy (99.9%) and DSC (99.14%), demonstrating superior overall performance, although it’s IoU (89.17%) and sensitivity (90%) are comparatively lower. The 80:20 split shows a strong balance across metrics, with an accuracy of 98.08%, the highest IoU (97.45%), sensitivity (97.32%), and a DSC of 93.52%. The 70:30 split yields slightly lower accuracy (92.72%) but maintains a high IoU (93.72%) and DSC (93.42%), though its sensitivity (91.62%) is slightly reduced. The 60:40 split performs well with an accuracy of 97.08%, an IoU of 92.53%, and a DSC of 95.32%, but its sensitivity (97.12%) is the highest among all splits. Overall, the 90:10 split is the most accurate, while the 80:20 split offers the best IoU and sensitivity balance.
To compare the performance metric as Accuracy, IoU, Sensitivity and DSC for the proposed architecture with Prior models such as Modified U-Net [26], End-to-End encoder-decoder network (DRUNet) [14], FFU-Net (Feature Fusion U-Net) [29], Deep Lab v3 [30], DR ResNet [31], and implemented U-Net.
Table 2. Performance analysis by varying training and testing data size
|
Training and Testing Percentage |
Accuracy |
Intersection Over Union (IoU) |
Sensitivity |
Dice Coefficient (DSC) |
|
60:40 |
97.08 |
92.53 |
97.12 |
95.32 |
|
70:30 |
92.72 |
93.72 |
91.62 |
93.42 |
|
80:20 |
98.08 |
97.45 |
97.32 |
93.52 |
|
90:10 |
99.9 |
89.17 |
90 |
99.14 |
Table 3. Comparing the suggested architecture's performance to earlier models
|
Models |
Accuracy (%) |
IoU (%) |
Sensitivity (%) |
DSC (%) |
|
Modified U-Net |
98.68 |
76.61 |
80.49 |
86.51 |
|
DRUNet |
99.7 |
84.5 |
89.9 |
- |
|
FFU-Net |
- |
84.14 |
87.55 |
91.3 |
|
Deep lab v3 |
98 |
86 |
87 |
86 |
|
DR ResNet+ |
98.29 |
- |
- |
98.98 |
|
Implemented U-Net |
98.93 |
62.01 |
65.87 |
97.98 |
|
Proposed IUNetA |
99.9 |
89.17 |
90 |
99.14 |
The Table 3 compares segmentation models based on accuracy, IoU, sensitivity, and Dice coefficient, highlighting the superior performance of the proposed IUNetA model, which achieves the highest metrics: 99.9% accuracy, 89.17% IoU, 90% sensitivity, and 99.14% Dice coefficient. While DRUNet also performs well with 99.7% accuracy, 84.5% IoU, and 89.9% sensitivity, and FFU-Net demonstrates strong segmentation abilities with 84.14% IoU, 87.55% sensitivity, and a Dice coefficient of 91.3%, they fall short of IUNetA. Deep Lab v3 achieves high IoU (86%), sensitivity (87%), and Dice (86%) but lower accuracy (98%). Models like Modified U-Net and Implemented U-Net exhibit good accuracy, but struggle with lower IoU and sensitivity, while DR ResNet+reports a high DSC (98.98%) but omits IoU and sensitivity. Overall, IUNetA stands out as the most effective model across all metrics.
From the above analysis, in existing network Overfitting and computational complexity result from inadequately highlighting the position of the optic disc. Segmentation is impeded by limited retinal features and differences in OD-Fovea distance standards. The proposed IUNetA utilize the Wiener filter to reduce the noise, and ACDR block consists of additional layer with CAB skip connection extracts the deep features that reduced the overfitting and complexity which segmented and localized the optic disc and fovea. The proposed IUNetA attained maximum accuracy, high IoU and Sensitivity when compared to prior models. The proposed IUNetA framework incorporates the Adam optimizer, which efficiently adjusts learning rates and accelerates convergence, making it well-suited for handling large-scale datasets and high-resolution images. The adaptive nature of Adam prevents stagnation in local minima and optimizes computational efficiency. Additionally, the use of ACDRB ensures effective feature extraction without significantly increasing memory requirements. To further enhance scalability, strategies such as batch normalization can be employed. These optimizations enable the architecture to maintain performance and accuracy even with extensive datasets and higher-resolution retinal images. Thus the proposed IUNetA outperforms better than existing networks which accurately segmented and localized the Optic disc and fovea in the DR.
In this article, the analysis of the Proposed IUNetA utilized IDRID dataset and initiates with the Wiener filter for preprocessing, which improves the quality of the retinal images by successfully removing small quantities of noise. Subsequently, the encoder and decoder units of the proposed IUNetA are strengthened by the ACDRB. With its sophisticated combination of batch normalization, ReLU layers, and max-pooling which maximized feature extraction while keeping the number of parameters adequate. In order to close the semantic gap between high-level and low-level picture features, proposed the CAB, that combines channel and spatial attention with a squeeze-and-excitation technique. The proposed IUNetA not only improves recognition but also lowers computing complexity. Furthermore, include a tangent function for the output in order to speed up learning and mitigate the vanishing gradient issue which was more effective to localize the optic disc and fovea. Notably the proposed architecture attained maximum accuracy of 99.99%, IoU of 89.17% and Sensitivity of 90% when compared to prior models. Thus, the overall architecture which outperforms better also accurately segmented and localized the optic disc and fovea in the DR. In Future, explore sophisticated attention systems that can adjust to particular structures and aspects of images. Provide attention blocks that dynamically adjust to various image areas for improved feature extraction and localization.
The authors would like to thank Dhanalakshmi College of Engineering for supporting this work.
[1] Ratanapakorn, T., Daengphoonphol, A., Eua-Anant, N., Yospaiboon, Y. (2019). Digital image processing software for diagnosing diabetic retinopathy from fundus photograph. Clinical Ophthalmology (Auckland, NZ), 13: 641. https://doi.org/10.2147/OPTH.S195617
[2] Zheng, S., Zhu, Y., Pan, L., Zhou, T. (2019). New simplified fovea and optic disc localization method for retinal images. Journal of Medical Imaging and Health Informatics, 9(4): 847-855. https://doi.org/10.1166/jmihi.2019.2665
[3] Saranya, K., Lakshmanan, N., Mathivanan, S., Logeshwaran, M. (2023). Deep learning based algorithm for detection of diabetic retinopathy. International Research Journal of Education and Technology, 5(3): 174-180.
[4] Huang, Y., Zhong, Z., Yuan, J., Tang, X. (2020). Efficient and robust optic disc detection and fovea localization using region proposal network and cascaded network. Biomedical Signal Processing and Control, 60: 101939. https://doi.org/10.1016/j.bspc.2020.101939
[5] Mohan, N.J., Murugan, R., Goel, T., Roy, P. (2020). Optic disc segmentation in fundus images using operator splitting approach. In 2020 Advanced Communication Technologies and Signal Processing (ACTS), Silchar, India, pp. 1-5. https://doi.org/10.1109/ACTS49415.2020.9350504
[6] Dietter, J., Haq, W., Ivanov, I.V., Norrenberg, L.A., Völker, M., Dynowski, M., Röck, D., Ziemssen, F., Leitritz, M.A., Ueffing, M. (2019). Optic disc detection in the presence of strong technical artifacts. Biomedical Signal Processing and Control, 53: 101535. https://doi.org/10.1016/j.bspc.2019.04.012
[7] Carmona, E.J., Molina-Casado, J.M. (2021). Simultaneous segmentation of the optic disc and fovea in retinal images using evolutionary algorithms. Neural Computing and Applications, 33(6): 1903-1921. https://doi.org/10.1007/s00521-020-05060-w
[8] Romero-Oraá, R., García, M., Oraá-Pérez, J., López, M.I., Hornero, R. (2020). A robust method for the automatic location of the optic disc and the fovea in fundus images. Computer Methods and Programs in Biomedicine, 196: 105599. https://doi.org/10.1016/j.cmpb.2020.105599
[9] Bhatkalkar, B.J., Nayak, S.V., Shenoy, S.V., Arjunan, R.V. (2021). FundusPosNet: A deep learning driven heatmap regression model for the joint localization of optic disc and fovea centers in color fundus images. IEEE Access, 9: 159071-159080. https://doi.org/10.1109/ACCESS.2021.3127280
[10] Ali, A., Wan Zaki, W.M.D., Hussain, A., Hashim, N., Mohd Isa, W.N. (2022). Vessel masking and Hough transform for optic disc localisation from retinal images. F1000Research, 11: 181. https://doi.org/10.12688/f1000research.73390.1
[11] Basavaraju, N.S., Ganesarathinam, S. (2021). Early detection of diabetic retinopathy using K-Means clustering algorithm and ensemble classification approach. International Journal of Intelligent Engineering and Systems, 14(16): 488-497. https://doi.org/10.22266/ijies2021.1231.43
[12] Kim, G.Y., Lee, S.H., Kim, S.M. (2021). Automated segmentation and quantitative analysis of optic disc and fovea in fundus images. Multimedia Tools and Applications, 80(16): 24205-24220. https://doi.org/10.1007/s11042-021-10815-1
[13] Kanjanasurat, I., Purahong, B., Pintavirooj, C., Satayarak, N., Benjangkaprasert, C. (2020). Blood vessel extraction and optic disk localization for diabetic retinopathy. In Proceedings of the 2020 10th International Conference on Biomedical Engineering and Technology, New York, United States, pp. 112-116. https://doi.org/10.1145/3397391.3397425
[14] Hasan, M.K., Alam, M.A., Elahi, M.T.E., Roy, S., Martí, R. (2021). DRNet: Segmentation and localization of optic disc and Fovea from diabetic retinopathy image. Artificial Intelligence in Medicine, 111: 102001. https://doi.org/10.1016/j.artmed.2020.102001
[15] Lu, Z., Chen, D. (2020). Weakly supervised and semi-Supervised semantic segmentation for optic disc of fundus image. Symmetry, 12(1): 145. https://doi.org/10.3390/sym12010145
[16] Veena, H.N., Muruganandham, A., Kumaran, T.S. (2022). A novel optic disc and optic cup segmentation technique to diagnose glaucoma using deep learning convolutional neural network over retinal fundus images. Journal of King Saud University-Computer and Information Sciences, 34(8): 6187-6198. https://doi.org/10.1016/j.jksuci.2021.02.003
[17] Feng, Y., Li, Z., Yang, D., Hu, H., Guo, H., Liu, H. (2022). Polarformer: Optic disc and cup segmentation using a hybrid CNN-Transformer and polar transformation. Applied Sciences, 13(1): 541. https://doi.org/10.3390/app13010541
[18] Wang, L., Liu, H., Lu, Y., Chen, H., Zhang, J., Pu, J. (2019). A coarse-to-Fine deep learning framework for optic disc segmentation in fundus images. Biomedical Signal Processing and Control, 51: 82-89. https://doi.org/10.1016/j.bspc.2019.01.022
[19] Bhatkalkar, B.J., Reddy, D.R., Prabhu, S., Bhandary, S.V. (2020). Improving the performance of convolutional neural network for the segmentation of optic disc in fundus images using attention gates and conditional random fields. IEEE Access, 8: 29299-29310. https://doi.org/10.1109/ACCESS.2020.2972318
[20] Tang, S., Qi, Z., Granley, J., Beyeler, M. (2021). U-Net with hierarchical bottleneck attention for landmark detection in fundus images of the degenerated retina. In Ophthalmic Medical Image Analysis: 8th International Workshop, OMIA 2021, Held in Conjunction with MICCAI 2021, Strasbourg, France, pp. 62-71. https://doi.org/10.1007/978-3-030-87000-3_7
[21] Yadav, S.K., Kafieh, R., Zimmermann, H.G., Kauer-Bonin, J., Nouri-Mahdavi, K., Mohammadzadeh, V., Shi, L., Kadas, E.M., Paul, F., Motamedi, S., Brandt, A.U. (2021). Deep learning based intraretinal layer segmentation using cascaded compressed U-Net. MedRxiv, 2021-11. https://doi.org/10.1101/2021.11.19.21266592
[22] Bengani, S., Angel, A.J.J., Vadivel, S. (2021). Automatic segmentation of optic disc in retinal fundus images using semi-supervised deep learning. Multimedia Tools and Applications, 80(3): 3443-3468. https://doi.org/10.1007/s11042-020-09778-6
[23] Wang, H., Yang, J., Wu, Y.Y., Du, W.C., Fong, S., Duan, Y.T., Yao, X.P., Zhou, X.S., Li, Q.Q., Lin, C., Liu, J., Huang, L. (2021). A fast lightweight based deep fusion learning for detecting macula fovea using ultra-Widefield Fundus images. Preprints. https://doi.org/10.20944/preprints202108.0469.v1
[24] Bilal, A., Sun, G., Mazhar, S., Imran, A., Latif, J. (2022). A transfer learning and U-Net-based automatic detection of diabetic retinopathy from fundus images. Computer Methods in Biomechanics and Biomedical Engineering: Imaging & Visualization, 10(6): 663-674. https://doi.org/10.1080/21681163.2021.2021111
[25] David, S.A., Mahesh, C., Kumar, V.D., Polat, K., Alhudhaif, A., Nour, M. (2022). Retinal blood vessels and optic disc segmentation using U‐Net. Mathematical Problems in Engineering, 2022(1): 8030954. https://doi.org/10.1155/2022/8030954
[26] Skouta, A., Elmoufidi, A., Jai-Andaloussi, S., Ouchetto, O. (2022). Hemorrhage semantic segmentation in fundus images for the diagnosis of diabetic retinopathy by using a convolutional neural network. Journal of Big Data, 9(1): 78. https://doi.org/10.1186/s40537-022-00632-0
[27] Xiong, H., Liu, S., Sharan, R.V., Coiera, E., Berkovsky, S. (2022). Weak label based Bayesian U-Net for optic disc segmentation in fundus images. Artificial Intelligence in Medicine, 126: 102261. https://doi.org/10.1016/j.artmed.2022.102261
[28] Huang, Y., Preuhs, A., Lauritsch, G., Manhart, M., Huang, X., Maier, A. (2019). Data consistent artifact reduction for limited angle tomography with deep learning prior. In International workshop on machine learning for medical image reconstruction, pp. 101-112. https://doi.org/10.1007/978-3-030-33843-5_10
[29] Xu, Y., Zhou, Z., Li, X., Zhang, N., Zhang, M., Wei, P. (2021). FFU‐Net: Feature fusion U‐Net for lesion segmentation of diabetic retinopathy. BioMed Research International, 2021(1): 6644071. https://doi.org/10.1155/2021/6644071
[30] Shaukat, N., Amin, J., Sharif, M., Azam, F., Kadry, S., Krishnamoorthy, S. (2022). Three-Dimensional semantic segmentation of diabetic retinopathy lesions and grading using transfer learning. Journal of Personalized Medicine, 12(9): 1454. https://doi.org/10.3390/jpm12091454
[31] Baba, S.M., Bala, I., Dhiman, G., Sharma, A., Viriyasitavat, W. (2024). Automated diabetic retinopathy severity grading using novel DR-ResNet+Deep learning model. Multimedia Tools and Applications, 83(28): 71789-71831. https://doi.org/10.1007/s11042-024-18434-2