Zihao Zhu![]()
© 2025 The author. This article is published by IIETA and is licensed under the CC BY 4.0 license (http://creativecommons.org/licenses/by/4.0/).
OPEN ACCESS
Colorectal cancer remains one of the leading causes of morbidity and mortality worldwide, posing a serious threat to human health. Colonoscopy is considered the gold standard for colorectal cancer diagnosis, and adenoma detection rate (ADR) is a critical quality indicator of colonoscopic procedures. However, accurate detection is challenging due to the complex intestinal structure under colonoscopy, the presence of interfering elements such as foam, residue, and feces, and the diverse sizes and subtle features of adenomatous polyps. Moreover, most existing AI-based detection models are computationally intensive and too slow for real-time application. To address these challenges, this study proposes a real-time colorectal adenoma detection method based on an improved single-stage object detection network, YOLOv5. To mitigate issues like false negatives and false positives in intermediate video frames caused by motion blur or camera defocus, the original algorithm is enhanced by integrating motion information and a sequential bounding-box matching post-processing module. This improves recall in video-based detection by correcting missed detections in intermediate frames. Performance validation on the public ImageNet VID dataset shows a 5.93% increase in mAP, while experiments on colonoscopy video datasets demonstrate a 20.47% improvement in recall rate.
deep learning, Convolutional Neural Network (CNN), YOLOv5, real-time detection, attention mechanism, adenomatous polyps
Colorectal cancer has maintained a high incidence and mortality rate globally, posing a serious threat to human life and health. In clinical practice, most colorectal cancers evolve from colorectal adenomas. Early detection and removal of adenomatous polyps have important clinical significance for the prevention or cure of colorectal cancer. Colonoscopy is the gold standard for diagnosing colorectal cancer. An important evaluation index to measure the quality of colonoscopy is the ADR. Evidence-based medical studies have shown that for every 1% increase in ADR, the incidence of colorectal cancer is reduced by 3%–6%. Therefore, effectively improving ADR can potentially reduce the risk of colorectal cancer. However, in clinical practice, physicians are often affected by subjective factors such as lack of experience and visual fatigue, which lead to missed detections and false detections during examinations. Thus, constructing a real-time auxiliary detection model for adenomas under colonoscopy has great significance for improving ADR and reducing the incidence of colorectal cancer.
Object detection is a deep learning implementation aimed at finding target objects in images. After the computer identifies the target object, it marks the position with rectangular boxes and outputs the category of the target. Early object detection was performed on static images. In early studies, Karkanis et al. [1] used traditional machine learning algorithms to extract color and texture features of adenomatous polyps in colonoscopy images, achieving a sensitivity of 90% and an accuracy of 95%. In 2014, Fu et al. [2] segmented superpixel digestive endoscopy images to detect colorectal adenomas, analyzed color histograms of different pixel values, and synthesized multi-scale color features, eventually achieving a diagnostic accuracy of 90.2%. In 2019, Zhu et al. [3] developed a CAD system using Convolutional Neural Network (CNN), which applied image enhancement and transfer learning methods to detect the invasion depth of early colorectal cancer, achieving a sensitivity of 76.47% and an accuracy of 89.16%, effectively reducing physicians’ misestimation of invasion depth. However, with the continuous optimization of medical resources and the automation of medical equipment in China, traditional image-based object detection is difficult to meet the needs of highly automated medical applications. Therefore, the demand for object detection in medicine has shifted from static images to dynamic videos, and the requirement for real-time detection has been further increased.
With the rise of deep learning, more researchers have applied deep learning methods to object detection, continuously updating object detection technology and optimizing networks, thereby improving detection speed and accuracy. This allows object detection networks to match the frame rate of videos and transition from detecting static images to detecting videos, marking the beginning of real-time detection. Since deep learning algorithms can automatically extract object features, several deep learning models based on CNNs [4] have been applied to real-time detection of colorectal adenomas. In 2020, Qadir et al. [5] used 20 colonoscopy videos from the public dataset CVC-Clinic to validate their method. When processing the current frame of the video, they used information from the preceding and following frames to analyze the temporal dependency between consecutive frames and determine whether there is a true positive result in the current frame. The final results showed that the model’s accuracy and recall were improved by 16% and 10%, respectively, compared to the original network. In 2017, Zhang et al. [6] realized real-time detection of adenomatous and hyperplastic polyps using deep CNNs. They collected an experimental dataset of 1930 images under random lighting, zoom, and optical magnification conditions, with 1104 non-polyp images, 263 hyperplastic polyp images, and 563 adenomatous polyp images. The experiment yielded accuracy, recall, and mean average precision of 87.3%, 87.6%, and 85.9%, respectively. In 2020, Ma et al. [7] modified the network model to re-input the false positives identified by the original network for repeated learning and outputting results. After several iterations, the false positive rate was significantly reduced. The model was evaluated on 11,954 colonoscopy video frames from the CVC-Clinic Video DB dataset, and the accuracy of the model was improved by about 2% compared to the original network.
However, the above studies still have certain limitations: (1) In order to improve detection accuracy, the network depth is continuously increased and recognition steps are added, resulting in a significant decrease in detection speed and affecting real-time performance; (2) Current studies mostly use static images or carefully selected colonoscopy videos as datasets for training and validating deep learning models. However, in actual clinical diagnosis, there are many uncertain factors such as bowel preparation, withdrawal time, and colonoscopy equipment, which may reduce the performance of computer-aided systems. To address these problems, this paper proposes a real-time detection method for colorectal adenomas based on an improved single-stage object detection network YOLOv5, aiming to improve ADR in colonoscopy and effectively assist physicians in adenoma screening.
2.1 Continuous frame image object detection method fused with motion information
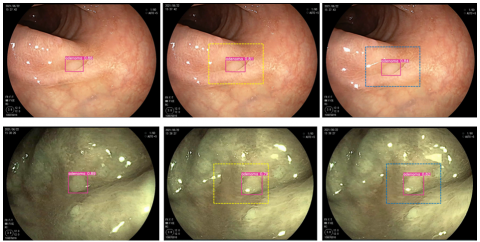
Since adenomatous polyps under colorectal endoscopy appear on the display screen as the scope is withdrawn, their movement speed is relatively slow, and the movement distance between adjacent frames is relatively limited. Therefore, in a group of video frames containing the same object, as long as the algorithm detects the object in one of the frames and gives a high confidence score, the approximate range where the object will appear in the next frame can be inferred based on the object’s maximum movement distance. Figure 1 shows an example of detection box judgment using motion information.
In Figure 1, image (a) is the current frame where the target has been detected with a high confidence score. According to the maximum movement speed of the adenomatous polyp in the field of view, the approximate range where the target appears in the next frame is judged, i.e., the yellow dashed box in (b). When the target appears within this range in the next frame, and the target obtains a certain confidence score, it can be largely determined that the target is the same as the one detected in the previous frame. Then, the detection box position in (b) is used to estimate the approximate position of the detection box in (c), i.e., the blue dashed box in (c). This process continues until all frames containing the target are traversed. Fusing object motion information can, to a certain extent, eliminate the occurrence of false detection and missed detection when the algorithm performs object detection on videos. This mechanism is called the post-processing error correction mechanism. The elimination of missed detection of objects is shown in Figure 2.
(a) Detection result of current frame (b) Prediction of next frame (c) Prediction of third frame
Figure 1. Example of detection box judgment using motion information
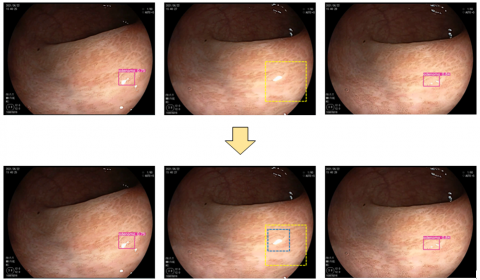
(a) Previous frame (b) Frame with missed detection (c) Next frame
Figure 2. Motion information fusion mechanism for eliminating missed object detection
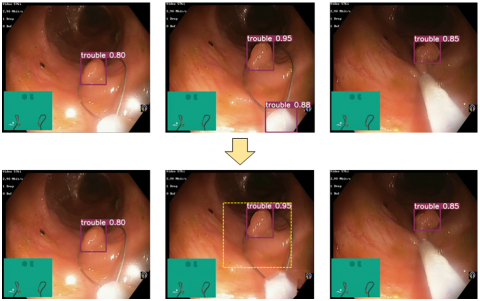
(a) Previous frame (b) Frame with false detection (c) Next frame
Figure 3. Motion information fusion mechanism for eliminating false object detection
When a frame with missed detection of a target occurs in a sequence group containing the same target, the algorithm fused with motion information can calculate the range where the target should appear in that frame based on the position of the target in the previous frame and the maximum movement distance of the target. This range is used as the detection box of the target. As shown in Figure 2, the target is not detected in (b). According to the detection results in (a) and (c), it can be judged that the target must exist in (b). Therefore, (b) is a frame with missed detection. According to the position in (a), the approximate position range of the target in (b) can be judged, i.e., the yellow dashed box in the figure, and it is used as the detection box of the adenoma in frame (b). It is not difficult to see from the figure that the blue dashed box is the true position of the adenoma. It can be seen that this method has a certain effect in eliminating missed detections.
In addition, this method also performs very well in eliminating false detections. The elimination of false detection situations is shown in Figure 3.
Since the prediction box given by motion information is calculated based on the target’s movement speed and represents the maximum movement range of the target, when the target appears in the previous frame, it can only appear within the predicted range in the next frame. If a target appears in a single frame but is not within or exceeds the predicted range, it proves that the target is a false detection and needs to be excluded. As shown in Figure 3, a false detection target appears at the bottom of (b), and this target does not appear in the inferred area from (a), nor does it appear in the next frame (c). Therefore, this target is a result of a false detection generated by the algorithm. It is filtered out by the algorithm during the post-processing process. It can be seen that this method can play a positive role in eliminating false detections.
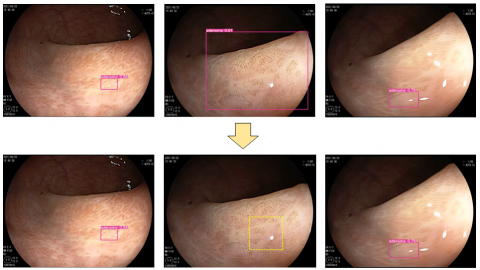
In addition to reducing false detections and missed detections of targets by the algorithm, this method also helps in correcting the boundary position of detection boxes, which can help the algorithm to more accurately recognize targets and obtain higher accuracy of detection boxes. Figure 4 shows an example in which the algorithm fused with motion information repositions an inaccurately located boundary box to make it more precise.
(a) Previous frame (b) Frame with inaccurate detection box (c) Next frame
Figure 4. Boundary box positioning after motion information fusion
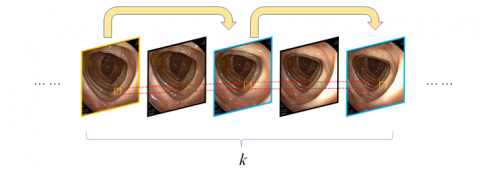
Figure 5. Principle of frame-skipping detection implementation
As can be seen from the above figure, the original algorithm produces an inaccurately positioned boundary box as shown in image (b). However, based on the detection box information in (a), it can be inferred that the appearance range of the detection box in (b) is within the yellow box. Therefore, the original detection boundary box can be shrunk to the size of the predicted box and used as the target detection box of the frame, thus correcting the boundary position of the detection box in each frame.
2.2 Frame-skipping detection transmission algorithm
For colorectal endoscopy videos, the movement of the scope is relatively slow, and there is a large amount of repetitive information in the video. The movement amplitude of the target is small. To address this issue, this study adopts a frame-skipping detection method [8], where the frame sequence is fully permutated and then odd-numbered frames are selected for detection. This can greatly improve the detection speed of the algorithm. The specific implementation scheme is shown in Figure 5.
Table 1. Frame-skipping detection algorithm
|
Pseudocode of Frame-Skipping Detection Algorithm |
|
Input: Video clip containing k consecutive frames {t₁, t₂, ..., tₖ} |
|
Output: Target detection results of the video |
|
1. Initialize key frame $k=1$ |
|
2. $f_1=N_{\text{feat }}\left(I_1\right)$ |
|
3. $y_1=N_{\text{task }}\left(f_1\right)$ |
|
4.for $i=2$ to $k$ do |
|
5. if $i$ is odd then then |
|
6. $M_{k \rightarrow i}=F\left(I_k, I_i\right)$ |
|
7. $f_i=D\left(f_k, T\left(M_{k \rightarrow i}\right)\right)$ //Feature propagation |
|
8. $y_i=N_{\text {task }}\left(f_i\right)$ |
|
9. endif |
|
10.endfor |
|
11. Initialize B as the set of all detection boxes in the k frames |
|
12.do |
|
13. Sequence selection to obtain the detection box sequence $B^{s e q}$ and the corresponding scores $B^{\text {seq′ }}$ |
|
14. for $i=2$ to $k$ do |
|
15. if $i$ is even then then |
|
16. if both $B_{i-1}^{s e q}$ and $B_{i+1}^{s e q}$ exist, then |
|
17. $B_i^{\text {seq }}=\operatorname{average}\left(B_{i-1}^{\text {seq }}, B_{i+1}^{\text {seq }}\right)$ // Generate detection result |
|
18. else if $B_{i-1}^{\text {seq }}>0.85$ |
|
19. $B_i^{\text {seq }}=B_{i-1}^{\text {seq }}$ |
|
20. $B_{i+1}^{s e q}=B_{i-1}^{s e q}$ |
|
21. else if $B_{i+1}^{\text {seq }}>0.85$ |
|
22. $B_i^{s e q}=B_{i+1}^{s e q}$ |
|
23. $B_{i-1}^{\text {seq }}=B_{i+1}^{\text {seq }}$ |
|
24. endif |
|
25. endif |
|
26. endfor |
|
27. Remove $B^{s e q}$ from B |
|
28.while $B^{\text {seq }}$ is empty |
|
29.Return detection results $\left\{y_i\right\}$ |
First, arrange the input video containing k frames in sequence, {t₁, t₂, …, tₖ}, and then extract the odd-numbered frames in the video as detection frames according to Eq. (1). If the video consists of an odd number of frames, the odd-numbered frames are extracted as detection frames; if the video consists of an even number of frames, then both the odd-numbered frames and the last frame are extracted as detection frames, while the remaining frames are non-detection frames. In the figure, the frame with the yellow border is the first frame where the target appears and is also called the key frame. For the key frame, features are extracted using Nfeat and detection is performed using Ntask. The odd-numbered frames tᵢ (i=3,5,7,…) with blue borders in the figure are called non-key detection frames. The features of the non-key frames are obtained from the detection of the key frame, and then detection is performed using Ntask. The even-numbered frames tᵢ (i=2,4,6,…) with black borders are non-detection frames. Non-detection frames do not undergo feature extraction or target detection. The detection boxes of targets in these frames are estimated based on the positions of the targets in the preceding and following detection frames (as shown by the green detection boxes in the figure).
$t_i=\left\{\begin{array}{cc}t_1, t_3, \ldots, t_k & k=2 a+1 \\ t_1, t_3, \ldots, t_{k-1}, t_k & k=2 a\end{array}\right.$ (1)
The pseudocode for the implementation of the frame-skipping detection algorithm is shown in Table 1.
3.1 Experimental environment
This experiment was run on a workstation with the Ubuntu 18.04 operating system (Dell Precision 5820 high-performance deep learning tower workstation). Its core configuration includes an Intel Core i7-7800 ×1, NVIDIA RTX 2080Ti ×2, and 128GB DDR4 RAM. The monitor used is an AOC Loire Series 4K medical image display. The deep learning framework used is Python 3.8.5 and PyTorch 1.6.0. The initial parameter settings during the training process are as follows: batch size is set to 32, learning rate is 0.01, the number of training epochs is set to 200, and the learning rate is halved every 100 epochs. The momentum parameters of the ADAM optimizer β₁, β₂, and ε are set to 0.5, 0.999, and 0.001 respectively.
3.2 Dataset
The dataset is divided into two parts. The first part comes from the video data of colorectal endoscopy surgeries in the Department of Gastroenterology of the hospital from June 2021 to September 2021. After screening, 26 video clips from 26 patients were retained. The resolution of all video clips is 1920×1080, and the frame rate is consistently 25 FPS. Each corresponding endoscopy report for these videos contains at least one adenomatous polyp. The second part is used to verify the generalization ability of the improved algorithm, and the ImageNet VID video dataset [9] was obtained from the Internet. This dataset contains a total of 30 classes, and the specific categories are shown in Table 2.
The advantage of this dataset lies in its large number of data samples. As shown in Table 3, the training set contains 3862 video clips and 1,122,397 images, with an average of about 129 videos and 37,400 images per category. Large sample data is beneficial for network training and feature learning.
Table 2. Object categories of ImageNet VID video dataset
|
Airplane |
Antelope |
Bear |
Bicycle |
Bird |
Bus |
|
Car |
Cattle |
Dog |
Domestic_cat |
Elephant |
Fox |
|
Giant_panda |
Hamster |
Horse |
Lion |
Lizard |
Monkey |
|
Motorcycle |
Red_panda |
Rabbit |
Sheep |
Snake |
Squirrel |
|
Tiger |
Train |
Turtle |
Watercraft |
Whale |
Zebra |
Table 3. Sample distribution of ImageNet VID dataset
|
Video Object Detection Dataset |
Number of Videos |
Number of Images |
|
Training Set |
3862 |
1122397 |
|
Validation Set |
555 |
176126 |
|
Test Set |
937 |
315175 |
3.3 Real-time detection evaluation metrics
In the real-time detection of adenomatous polyps in colorectal endoscopy, both detection accuracy and detection speed are very important. In order to maximally reflect the detection accuracy and speed of the improved algorithm, and to reduce the false detection rate and missed detection rate during detection while improving the detection speed, this study selects precision (P), recall (R), F1 score, F2 score, mean average precision when IoU is 0.5 (mAP@0.5), and frames per second (FPS) as performance evaluation metrics of the network. The definitions of precision and recall are as follows [10-15]:
$\mathrm{P}=\frac{T_P}{T_P+F_P} \times 100 \%$ (2)
$\mathrm{R}=\frac{T_P}{T_P+F_N} \times 100 \%$ (3)
where, TP is true positive, representing the number of correctly detected adenomas; FP is false positive, representing the number of non-adenomatous tissues mistakenly identified as adenomas; FN is false negative, representing the number of adenomas that were not correctly detected. However, in practical detection processes, precision and recall alone are not sufficient to prove that the network performance is optimal. Therefore, it is necessary to combine both to calculate the F1 score and F2 score, to measure the comprehensive performance of the algorithm in terms of precision and recall, thereby verifying the overall performance of the network. Generally speaking, the F1 score indicates that both precision and recall are equally important, while the F2 score indicates that recall is more important than precision, emphasizing more on the completeness of detection.
$F_1=2 \times \frac{P \times R}{P+R}$ (4)
$F_2=5 \times \frac{P \times R}{4 P+R}$ (5)
Mean Average Precision (mAP) represents the overall performance of the algorithm. The calculation method is: draw the R-P curve with IoU=0.5 on the coordinate axis, and the area under the resulting curve is mAP@0.5. The specific formula is given below. Since this experiment focuses on the target detection of adenomas under colorectal endoscopy, mAP = AP.
$m A P=A P=\int_0^1 p(R) d R$ (6)
Frames Per Second (FPS) represents the detection speed of the algorithm. The higher the FPS of the algorithm, the more frames it can detect per second, and the better it can detect videos with high refresh rates.
4.1 Experimental settings and result analysis on ImageNet VID video dataset
This experiment is based on the further improvement of the YOLOv5s network, so that it can achieve better performance in video object detection. Therefore, the improved YOLOv5s network is used as the control group. A total of 5 sets of experiments (Test) are set to verify the algorithm optimization module proposed in this study. The specific settings are as follows:
Since this experiment uses the public ImageNet VID dataset, the performance of the algorithm is mainly evaluated in terms of mAP and detection speed. The results are shown in Table 4 and Table 5. Table 4 mainly shows the performance difference in detection speed between the control group and the improved algorithm; Table 5 mainly shows the mAP of each group of algorithms for dynamic detection of objects in videos, i.e., the difference in accuracy. From the data in Table 4, comparing experiments T1, T2, and T3, it is not difficult to see that after integrating motion information and the two post-processing matching mechanisms, Seq-NMS and Seq-Bbox, the detection speed of the algorithm has suffered a certain loss. The FPS dropped by about 20–40, which may be due to the increased computational load caused by the introduction of new modules. However, comparing experiments T2, T3, T4, and T5, it can be seen that after integrating frame skipping detection into the algorithm, due to the mechanism of this module, the algorithm can reduce half of the detection frames during video object detection. Therefore, the detection speed of the algorithm can be nearly doubled.
From the data in Table 5, it can be seen that the dataset contains a total of 30 categories. The best results for single-category object detection in the table are marked in bold. For single-category object detection in videos, the best performance is achieved by group T3, with the highest AP value for 20 categories. The next best group is T5, which achieves the highest AP value for 9 categories. The common feature of groups T3 and T5 is that both integrate motion information and the Seq-Bbox post-processing mechanism. It can be seen that compared with Seq-NMS, Seq-Bbox can bring more significant performance improvement to the algorithm’s detection results. This may be because the mechanism of Seq-NMS is to establish links between the detected object boxes in a sequence of frames. For objects that are not detected, it is impossible to establish effective links between frames, and thus the detection accuracy of such objects cannot be improved. Seq-Bbox, on the other hand, uses bilinear interpolation for the intermediate frames during detection, which can realize the detection of sparse objects and improve the recognition rate of missed detections. Compared with the control group T1, the mAPs of the other four groups are all higher than T1, which proves that the post-processing mechanism has a certain optimization effect on video object detection results. Considering the results of detection speed and accuracy from all five experiments, T5 achieves a good balance between speed and accuracy improvement. Therefore, this group of algorithms is used to validate on colorectal endoscopy video data, to observe the difference between its performance and the control group in detecting adenomatous polyps, and to further verify the feasibility of applying the proposed method in this study to the real-time detection of adenomatous polyps.
Table 4. Speed performance differences of the algorithms on ImageNet VID
|
Group |
Detection Time (FPS) |
|
T1 |
87 |
|
T2 |
64 |
|
T3 |
53 |
|
T4 |
112 |
|
T5 |
106 |
Table 5. Accuracy performance differences of the algorithms on ImageNet VID
|
Category Method |
Airplane |
Antelope |
Bear |
Bicycle |
Bird |
Bus |
Car |
Cattle |
|
T1 |
0.8203 |
0.7895 |
0.8513 |
0.6533 |
0.6936 |
0.7964 |
0.6377 |
0.7004 |
|
T2 |
0.827 |
0.7962 |
0.8528 |
0.6732 |
0.7036 |
0.8154 |
0.6543 |
0.7697 |
|
T3 |
0.8368 |
0.8093 |
0.8543 |
0.6974 |
0.7285 |
0.8324 |
0.6715 |
0.7937 |
|
T4 |
0.8254 |
0.7933 |
0.8672 |
0.6654 |
0.6987 |
0.8253 |
0.6577 |
0.7152 |
|
T5 |
0.8302 |
0.7999 |
0.8754 |
0.6898 |
0.7322 |
0.8285 |
0.673 |
0.7635 |
|
Category Method |
Dog |
Domestic_cat |
Elephant |
Fox |
Giant_panda |
Hamster |
Horse |
Lion |
|
T1 |
0.7018 |
0.8104 |
0.7168 |
0.8593 |
0.9035 |
0.7963 |
0.6283 |
0.6007 |
|
T2 |
0.7082 |
0.8365 |
0.7547 |
0.8849 |
0.9187 |
0.8281 |
0.6714 |
0.6498 |
|
T3 |
0.7356 |
0.8633 |
0.7633 |
0.9036 |
0.9354 |
0.8466 |
0.6835 |
0.6833 |
|
T4 |
0.6933 |
0.8247 |
0.7364 |
0.8754 |
0.9336 |
0.8157 |
0.6533 |
0.6288 |
|
T5 |
0.7254 |
0.871 |
0.7616 |
0.9075 |
0.9287 |
0.84 |
0.6694 |
0.6624 |
|
Category Method |
Lizard |
Monkey |
Motorcycle |
Rabbit |
Red_panda |
Sheep |
Snake |
Squirrel |
|
T1 |
0.7659 |
0.4190 |
0.7536 |
0.6177 |
0.8270 |
0.6387 |
0.7060 |
0.4953 |
|
T2 |
0.7900 |
0.4736 |
0.7963 |
0.6694 |
0.8572 |
0.6954 |
0.7366 |
0.5591 |
|
T3 |
0.8250 |
0.5118 |
0.8360 |
0.7030 |
0.8995 |
0.7190 |
0.7698 |
0.6088 |
|
T4 |
0.7893 |
0.4493 |
0.7746 |
0.6480 |
0.8462 |
0.6780 |
0.7492 |
0.5760 |
|
T5 |
0.8136 |
0.513 |
0.8277 |
0.6982 |
0.8824 |
0.7062 |
0.7736 |
0.6127 |
|
Category Method |
Tiger |
Train |
Turtle |
Watercraft |
Whale |
Zebra |
mAP |
|
|
T1 |
0.8617 |
0.7466 |
0.6668 |
0.5715 |
0.6034 |
0.8480 |
0.7160 |
|
|
T2 |
0.9216 |
0.7698 |
0.7384 |
0.6338 |
0.6217 |
0.8677 |
0.7492 |
|
|
T3 |
0.9215 |
0.8192 |
0.7968 |
0.6521 |
0.6418 |
0.9159 |
0.7753 |
|
|
T4 |
0.8500 |
0.7580 |
0.6841 |
0.6070 |
0.6180 |
0.8590 |
0.7365 |
|
|
T5 |
0.9176 |
0.8064 |
0.7754 |
0.6354 |
0.6482 |
0.9038 |
0.7691 |
|
4.2 Experiment settings and result analysis on colonoscopy videos
For the object detection of colonoscopy videos, this paper evaluates the algorithm's performance comprehensively using five metrics: Precision, Recall, mAP, F1 Score, and FPS under IoU thresholds of 0.5, 0.6, and 0.7 for adenomatous polyp detection. The experimental results are presented in Table 6.
From the data in the table, it can be observed that the four improved algorithms outperform the original algorithm (T1) in overall performance. The most significant improvement is seen in the Recall of the T3 group, where Recall increased by 20.68% when the IOU was 0.7. This is due to the original algorithm often missing intermediate frames during adenoma detection in colonoscopy videos, caused by issues like dynamic blur or camera defocus. After adding Seq-Bbox in YOLOv5 and incorporating the motion state information of adenomas, the algorithm establishes Tubelets in the target frame sequence by using detection results from preceding and subsequent frames. This mechanism significantly reduces the missed detections in intermediate frames during detection. With the improved algorithm's recall rate increased, the F1 score of the T3 group improved significantly compared to the control group (T1), with a 13.72% increase when the IOU was 0.7. However, compared to the 93 FPS of the T1 group, the FPS of the T3 group dropped to 61. The T5 group, which added a frame-skipping detection mechanism based on the T3 group, improved the detection speed from 61 FPS to 109 FPS. In terms of detection accuracy, when IOU was 0.7, the Precision of the T5 group decreased by 0.18%, Recall decreased by 0.21%, mAP decreased by 0.64%, and the F1 score decreased by 0.7%, nearly maintaining the detection accuracy of the T3 group. This ensured a balance between detection speed and accuracy, achieving improvements in both speed and accuracy.
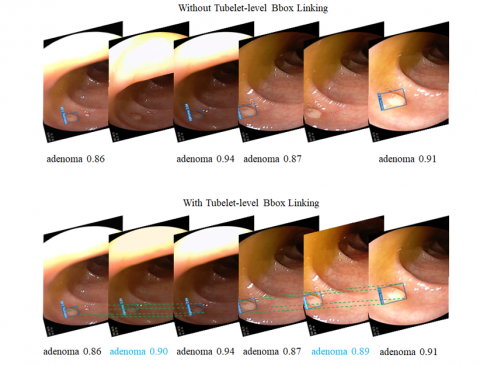
Figure 6 shows an example of how the Seq-Bbox mechanism supplements the anchor for missed intermediate frames during adenoma detection in colonoscopy videos by establishing Tubelet Bbox links. The images are frames extracted from the T1 and T5 group detection videos.
From the top of Figure 6, the detection result without the Tubelet Bbox link from the original network shows a missed detection in the intermediate frame when detecting a polyp in two directions. This leads to an increased miss detection rate, which reduces the recall rate for adenomas. However, with the improved algorithm, the Tubelet Bbox link is established between adjacent frames. This link uses bilinear interpolation to locate the detection box in the intermediate frame. After generating the detection box, the motion information of the adenoma is matched, and the bounding box is shrunk to increase the IOU with the Ground Truth, improving the accuracy of detection. The final detection box confidence is averaged from the detection boxes of the previous and next frames.
Table 6. Results of the improved method for colonoscopy video detection
|
Method |
IOU |
Precision |
Recall |
mAP |
F1 score |
FPS |
|
T1 |
0.5 |
0.9376 |
0.8115 |
0.8656 |
0.8700 |
93 |
|
0.6 |
0.9241 |
0.7633 |
0.8322 |
0.8360 |
||
|
0.7 |
0.9030 |
0.7150 |
0.7857 |
0.7981 |
||
|
T2 |
0.5 |
0.9435 |
0.8966 |
0.9130 |
0.9195 |
66 |
|
0.6 |
0.9322 |
0.8743 |
0.9065 |
0.9023 |
||
|
0.7 |
0.9184 |
0.8682 |
0.8886 |
0.8926 |
||
|
T3 |
0.5 |
0.9681 |
0.9526 |
0.9572 |
0.9603 |
61 |
|
0.6 |
0.9580 |
0.9477 |
0.9436 |
0.9528 |
||
|
0.7 |
0.9388 |
0.9218 |
0.9240 |
0.9353 |
||
|
T4 |
0.5 |
0.9336 |
0.8821 |
0.9074 |
0.9071 |
118 |
|
0.6 |
0.9152 |
0.8643 |
0.8853 |
0.8890 |
||
|
0.7 |
0.9031 |
0.8366 |
0.8536 |
0.8686 |
||
|
T5 |
0.5 |
0.9677 |
0.9428 |
0.9433 |
0.9551 |
109 |
|
0.6 |
0.9541 |
0.9336 |
0.9350 |
0.9437 |
||
|
0.7 |
0.9370 |
0.9197 |
0.9176 |
0.9283 |
Figure 6. Anchor supplementation via Seq-Bbox mechanism
This paper addressed the problem of missed and false detections in intermediate frames when using the YOLOv5 network for adenoma detection in colonoscopy videos. First, a method was proposed to fuse motion information from consecutive frames to enhance the target detection effect. This method estimates the approximate position of the target in the next frame by calculating the target's movement distance, and experimental validation showed that it improved the results of missed and false detections in consecutive frame target detection. In addition, this method can effectively locate the boundaries of the detection box, improving detection accuracy. Then, two post-processing methods for target detection in videos were presented, namely Seq-NMS and Seq-Bbox, and their implementation processes and core ideas were analyzed. The improvements these two methods bring to detection results and their limitations were identified, and the motion information of the target was incorporated into both methods. After validation, it was found that this improvement increased the algorithm's accuracy, recall, and mean average precision (mAP). Finally, to further improve the detection speed of the algorithm and meet the real-time requirements of video target detection, a frame-skipping detection mechanism was incorporated into the algorithm. The algorithm was comprehensively evaluated and analyzed using the ImageNet VID video dataset and colonoscopy videos from a hospital's gastroenterology department. The results showed that the improved algorithm enhanced both accuracy and speed performance, with Recall improving by 20.47% and FPS increasing by 16. This confirmed that the improvement in this study was effective.
[1] Karkanis, S.A., Iakovidis, D.K., Maroulis, D.E., Karras, D.A., Tzivras, M. (2003). Computer-aided tumor detection in endoscopic video using color wavelet features. IEEE Transactions on Information Technology in Biomedicine, 7(3): 141-152. https://doi.org/10.1109/TITB.2003.813794
[2] Fu, Y., Zhang, W., Mandal, M., Meng, M.Q.H. (2013). Computer-aided bleeding detection in WCE video. IEEE Journal of Biomedical and Health Informatics, 18(2): 636-642. https://doi.org/10.1109/JBHI.2013.2257819
[3] Zhu, Y., Wang, Q.C., Xu, M.D., Zhang, Z., Cheng, J., Zhong, Y.S., Li, Q.L. (2019). Application of convolutional neural network in the diagnosis of the invasion depth of gastric cancer based on conventional endoscopy. Gastrointestinal Endoscopy, 89(4): 806-815. https://doi.org/10.1016/j.gie.2018.11.011
[4] Bouvrie, J. (2006). Notes on convolutional neural networks. In Practice, 2006: 47-60.
[5] Qadir, H.A., Balasingham, I., Solhusvik, J., Bergsland, J., Aabakken, L., Shin, Y. (2019). Improving automatic polyp detection using CNN by exploiting temporal dependency in colonoscopy video. IEEE Journal of Biomedical and Health Informatics, 24(1): 180-193. https://doi.org/10.1109/JBHI.2019.2907434
[6] Zhang, R., Zheng, Y., Mak, T.W.C., Yu, R., Wong, S.H., Lau, J.Y., Poon, C.C. (2016). Automatic detection and classification of colorectal polyps by transferring low-level CNN features from nonmedical domain. IEEE Journal of Biomedical and Health Informatics, 21(1): 41-47. https://doi.org/10.1109/JBHI.2016.2635662
[7] Ma, Y., Chen, X., Sun, B. (2020). Polyp detection in colonoscopy videos by bootstrapping via temporal consistency. In 2020 IEEE 17th International Symposium on Biomedical Imaging (ISBI), Iowa City, IA, USA, pp. 1360-1363. https://doi.org/10.1109/ISBI45749.2020.9098663
[8] Zhou, B., Khosla, A., Lapedriza, A., Torralba, A., Oliva, A. (2015). Places2: A large-scale database for scene understanding. http://places2.csail.mit.edu/download.html.
[9] Sung, H., Ferlay, J., Siegel, R.L., Laversanne, M., Soerjomataram, I., Jemal, A., Bray, F. (2021). Global cancer statistics 2020: GLOBOCAN estimates of incidence and mortality worldwide for 36 cancers in 185 countries. CA: A Cancer Journal for Clinicians, 71(3): 209-249. https://doi.org/10.3322/caac.21660
[10] Morgan, M.B., Mates, J.L. (2021). Applications of artificial intelligence in breast imaging. Radiologic Clinics, 59(1): 139-148. https://doi.org/10.1016/j.rcl.2020.08.007
[11] Cho, J., Kim, J., Lee, K.J., Nam, C.M., Yoon, S.H., Song, H., Lee, K.W. (2020). Incidence lung cancer after a negative ct screening in the national lung screening trial: Deep learning-based detection of missed lung cancers. Journal of Clinical Medicine, 9(12): 3908. https://doi.org/10.3390/jcm9123908
[12] Pereira, T., Freitas, C., Costa, J.L., Morgado, J., Silva, F., Negrão, E., Oliveira, H.P. (2020). Comprehensive perspective for lung cancer characterisation based on AI solutions using CT images. Journal of Clinical Medicine, 10(1): 118. https://doi.org/10.3390/jcm10010118
[13] Tonozuka, R., Mukai, S., Itoi, T. (2020). The role of artificial intelligence in endoscopic ultrasound for pancreatic disorders. Diagnostics, 11(1): 18. https://doi.org/10.3390/diagnostics11010018
[14] Song, H., Zhang, W.N., Cui, Y., Wang, D., Liu, T. (2019). Exploiting persona information for diverse generation of conversational responses. IJCAI International Joint Conference on Artificial Intelligence, 2019: 5190-5196. https://doi.org/10.24963/ijcai.2019/721
[15] Elsken, T., Metzen, J.H., Hutter, F. (2019). Neural architecture search: A survey. Journal of Machine Learning Research, 20(55): 1-21. https://doi.org/10.48550/arXiv.1808.05377