Wenting Song![]() | Liangping Sun*
| Liangping Sun*![]() | Jie Han
| Jie Han![]() | Yang Li
| Yang Li![]()
© 2025 The authors. This article is published by IIETA and is licensed under the CC BY 4.0 license (http://creativecommons.org/licenses/by/4.0/).
OPEN ACCESS
With the rapid advancement of the digital economy, advertising images have emerged as a core medium for brand communication. Sentiment classification of such images plays a critical role in precision marketing and the enhancement of user experience. Recent progress in deep learning offers novel approaches to sentiment analysis in advertising images. However, existing methods remain constrained by limitations in multimodal information fusion, multi-granularity visual feature processing, and attribute-level sentiment interpretation. Common issues include the simplistic concatenation of visual and textual features, neglect of the emotional correlation between local and global visual elements, and the absence of effective integration of multi-scale attribute-level perspectives, all of which result in inadequate classification accuracy and robustness. To address these challenges, an attribute-level sentiment analysis model based on multi-level vision-language alignment and fusion for advertising images was proposed. Through a multi-granularity visual information alignment technique, the model enables precise semantic matching between visual elements—at the pixel, region, and object levels—and their corresponding textual counterparts. Furthermore, multi-scale attribute-level viewpoints were integrated to capture emotional features across dimensions such as color, shape, and embedded textual content. A text-centered multimodal training strategy was also designed to filter irrelevant visual noise. Experimental results demonstrate significant improvements in both accuracy and robustness of advertising image sentiment classification. This model provides technical support for advertising effectiveness evaluation and strategy optimization. The findings contribute theoretically to the advancement of multimodal sentiment analysis and offer practical guidance for precision advertising in contexts such as e-commerce and social media.
deep learning, advertising images, sentiment classification, multi-level vision-language alignment, attribute-level sentiment analysis
Amid the rapid development of the digital economy, advertising images have become a vital medium for conveying brand values and facilitating communication between enterprises and consumers [1-4]. These images are widely disseminated across platforms such as e-commerce websites, social media, and mobile applications. With the advancement of deep learning techniques, substantial progress has been achieved in fields including image classification and object detection [5-8], thereby offering novel methodologies for sentiment classification of advertising images. Advertising images typically encompass rich visual elements—such as color, shape, and texture—and are often accompanied by textual information, working in tandem to express the emotional tone and communicative intent of the advertisement [9, 10]. Accurate sentiment classification of advertising images is instrumental in enabling enterprises to better understand consumers’ emotional responses to advertising content, thereby optimizing marketing strategies and enhancing advertising effectiveness.
The study of sentiment classification techniques for advertising images carries both significant theoretical and practical value. Theoretically, it contributes to the expansion of the sentiment classification framework by uncovering the underlying mechanisms through which visual and textual information interact within advertising images. This, in turn, provides new perspectives for multimodal sentiment analysis. Practically, precise sentiment classification facilitates more accurate audience targeting and the development of tailored advertising strategies, leading to increased conversion rates and higher returns on investment. Moreover, the delivery of emotionally aligned advertising content can enhance user experience by meeting consumers’ affective preferences.
Despite recent advances, existing methods for sentiment classification of advertising images remain limited in their ability to effectively integrate multimodal information. For instance, several studies [10-13] have relied on simple concatenation or weighted summation of visual and textual features without sufficiently modeling the semantic alignment and complementary relationships between these modalities, resulting in a shallow understanding of the emotional content conveyed in advertising images. Other approaches [14-16] have struggled to capture the impact of visual details across different levels of granularity, often failing to consider the interplay between local visual elements and the overall emotional expression of the image. Furthermore, in the domain of attribute-level sentiment analysis, many existing models [17-20] have lacked mechanisms for integrating multi-scale attribute-level perspectives, thereby limiting their capacity to accurately detect sentiment tendencies across various visual attributes. These limitations negatively impact both the accuracy and robustness of sentiment classification outcomes.
To address these challenges, an attribute-level sentiment analysis model based on multi-level vision-language alignment and fusion for advertising images was proposed. The model comprises three main components. First, multi-granularity visual information alignment techniques were employed to achieve precise matching between visual elements at different levels and corresponding textual information, thereby uncovering rich semantic correlations between modalities. Second, multi-scale attribute-level viewpoints were integrated to extract sentiment features across diverse dimensions, enabling a comprehensive analysis of emotional cues embedded in color, shape, and textual content. Finally, a text-centered multimodal training strategy was implemented, with carefully designed loss functions aimed at suppressing noise arising from irrelevant visual context and enhancing the model’s robustness. The proposed approach addresses the major deficiencies of existing techniques by introducing a framework that combines hierarchical vision-language alignment with attribute-level sentiment analysis. Substantial improvements in both classification accuracy and robustness were thereby achieved. This model not only improves the accuracy of sentiment classification in advertising images but also offers strong technical support for in-depth advertising performance evaluation and strategic optimization. It holds significant potential for real-world applications.
An attribute-level sentiment analysis model based on multi-level vision-language alignment and fusion was proposed to address core challenges in advertising image sentiment classification—namely, the semantic gap between visual and textual modalities and the influence of irrelevant visual noise. A hierarchical, multi-dimensional analytical framework was constructed to resolve these issues systematically. The model first employs a multi-granularity image translation mechanism to perform cross-modal semantic mapping of advertising images at the global scene, local region, and character-level visual text. This process enables indirect alignment between visual and textual spaces, laying a semantic foundation for subsequent vision-language fusion. Following this, visual features at multiple scales—including pixel-level, region-level, and object-level—are extracted using a Residual Network (ResNet) architecture. These features are aggregated through average pooling to form a visual cue vector that effectively captures emotional cues related to color, shape, object layout, and textual characters within the advertising image. During textual semantic processing, the Bidirectional Encoder Representations from Transformers (BERT) model was utilized. Through its multi-head attention mechanism, the visual cue vector is dynamically concatenated with the key and value components of each Transformer block. This facilitates deep semantic integration of visual and textual modalities during the encoding process, enabling the extraction of attribute-level emotional correlations between image and text. To mitigate the interference caused by complex visual contexts, an adversarial training strategy centered on textual semantics was designed. By minimizing the Kullback-Leibler (KL) divergence between the output distributions under pure text input and mixed vision-text input conditions, irrelevant visual noise is effectively filtered out. Finally, a classifier outputs attribute-sentiment pairs across multiple dimensions—such as color style, object properties, and textual content—thereby enabling a fine-grained analysis of emotional tendencies in advertising images. This framework, through its multi-level vision-language alignment and attribute-level sentiment fusion strategy, significantly enhances the accuracy and robustness of advertising image sentiment classification, thereby providing a systematic solution for the emotional-semantic interpretation of advertising content.
The proposed model comprises three primary stages: (a) multi-granularity vision-to-text translation and alignment for advertising images; (b) multi-scale fusion of visual attribute-level perspectives; and (c) text-centered multimodal training for sentiment analysis. Detailed descriptions of each stage are provided in the following subsections.
2.1 Multi-granularity visual-to-text translation and alignment of advertising images
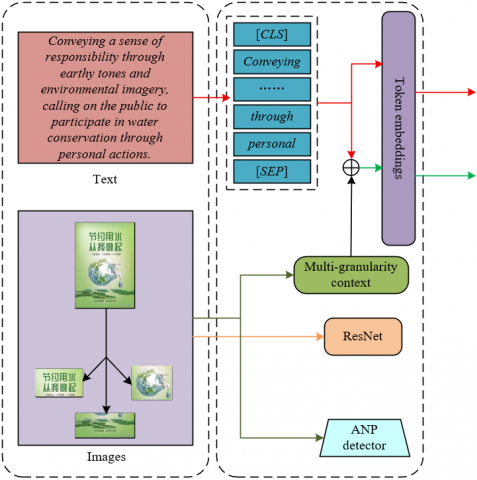
In advertising image sentiment analysis, advertising images typically encode multi-level semantic content, including global scene ambiance, localized object regions, and character-level visual text. These visual elements of varying granularity collectively serve as the core carriers of emotional expression. However, existing multimodal alignment methods have been largely constrained to single-granularity representations, which limits their ability to comprehensively capture hierarchical emotional cues and their semantic associations with textual content—from coarse-grained scene-level impressions to fine-grained character-level details. To address this limitation, a multi-granularity visual-to-text translation and alignment module was introduced. This module decomposes advertising images into distinct layers of visual context—namely, global scenes, local regions, and character-level text—to enable semantic translation across modalities. Through this approach, visual features can be precisely aligned with textual semantics across multiple dimensions, including global layout, object attributes, and character-level meanings. The architectural design of this module is illustrated in Figure 1. For example, a dominant red hue in the global visual space may correspond to emotionally charged words such as passion or promotion in the accompanying text. A zoomed-in view of a product within a local region may be semantically aligned with functional descriptions in the text. Similarly, slogan-like character-level elements can be directly mapped to emotionally significant keywords in the textual content. This alignment strategy ensures comprehensive coverage across granularities, thereby avoiding the omission of critical visual cues that may arise from single-level alignment techniques. Moreover, this cross-modal semantic mapping serves to bridge the semantic gap between vision and language. It establishes a structured foundation for subsequent multi-layer attention mechanisms to integrate multi-scale emotional features. As a result, semantic associations between visual elements—such as color styles, object properties, and textual content—and their corresponding textual representations can be captured with high precision across granular levels, significantly enhancing the comprehensiveness and accuracy of attribute-level sentiment analysis in advertising image classification tasks.
Figure 1. Architecture of the multi-granularity visual-to-text translation and alignment module for advertising images
(a) Global coarse-grained alignment of advertising images
Within the proposed model, the global coarse-grained alignment step of the multi-granularity visual-to-text translation and alignment module is designed to capture the overall semantic atmosphere of advertising images and establish high-level semantic associations with textual content. This step introduces an image captioning model to extract global features from advertising images and convert global visual information, including color palette, spatial layout, and object distribution, into natural language descriptions, thereby forming a coarse-grained semantic representation of the visual content. Specifically, the ClipCap model is employed to process an advertising image H, generating a descriptive text Z that encapsulates the core content of the image. The generated description emphasizes macro-level semantic information such as overall scene structure, emotional tone, and so on. In doing so, the global visual features of the image are semantically translated into language-based representations.
$Z=CliCap\left( H \right)$ (1)
Through this process, a direct semantic mapping is established between the global visual space and the textual semantic space at a coarse-grained level. For instance, an image dominated by warm tones may be aligned with emotion-related words such as comfort or passion in the accompanying text, while the spatial arrangement of the scene may semantically correspond to brand positioning keywords described in the textual content.
(b) Local fine-grained alignment of advertising images
In the proposed model, the local fine-grained alignment step is designed to capture the emotional nuances of localized visual elements in advertising images and establish detailed semantic mappings with textual content. Given that facial expressions often serve as core carriers of affective cues in advertising images, this step first employs the LightFace facial detector to locate facial regions and extract local visual features—including expression, pose, age, and gender. These features are subsequently transformed into textual descriptions of facial attributes. A facial expression description template is then applied to semantically translate the detected facial features into structured language representations that are compatible with the textual modality, thus generating fine-grained emotional cues. To effectively filter low-confidence interference information, the model ranks the generated facial attributes in descending order based on the confidence scores provided by the facial detector, prioritizing high-reliability emotional features for inclusion. Let F={F1, F2, ..., Ff}, where f represents the number of facial descriptions. The conversion of facial analysis results into detailed textual information is formalized as:
$F=Face\_Description\left( H \right)$ (2)
Through this process, subtle emotional expressions conveyed through facial features in advertising images are precisely translated into attribute-level emotional keywords within the textual space. These keywords form a fine-grained semantic alignment with terms related to emotions and attitudes in the accompanying advertising text. This alignment strategy allows the model to capture deep emotional associations between visual and textual modalities at the object-attribute level, which compensates for the deficiency of traditional methods that ignore local key visual clues. It provides foundational semantic support for the fine analysis of local emotional attributes in advertising images during the subsequent multimodal fusion process and significantly enhances the granularity and accuracy of attribute-level sentiment analysis.
(c) Character-level fine-grained alignment of advertising images
Within the proposed attribute-level sentiment analysis model based on multi-level vision-language alignment and fusion, the character-level fine-grained alignment step is designed for semantic extraction and modality alignment of character-level visual text in advertising images, addressing the limitations of conventional image encoders in processing explicit textual information. Given that advertising images often convey core emotional appeals directly through character-based visual text, the Tesseract OCR engine is employed to recognize character regions with high precision. Visual text information—including font, color, and layout—is extracted and converted into plain textual content denoted as Pz, thereby achieving a transformation from character-level visual features to the textual semantic space. The expression is as follows:
${{P}_{z}}=OCR\left( H \right)$ (3)
Subsequently, the character-level text Pz is concatenated with the global coarse-grained description H and the localized facial description F in a structured format: Nz=(Z,[SEP],F,[SEP],Pz,[SEP]). This sequence forms a composite textual representation that integrates multi-granularity visual context. It enables the hierarchical association of global scene semantics, localized emotional cues, and character-level explicit textual content within a unified modality. For instance, in a cosmetics advertisement, the character slogan “brighten the skin” may semantically correspond with the global scene description “fresh and natural” and the local facial feature “radiant gaze,” together mapping to the attribute-level sentiment dimension of “confidence in efficacy.” The insertion of [SEP] tokens between the input text S and the visual context Nz enables the model to clearly distinguish between different modality sources. The multi-layer attention mechanism facilitates precise alignment between character-level text and advertising copy within the Transformer architecture.
Specifically, both S+N and S are processed through a Transformer architecture to obtain their respective hidden representations, denoted as GMS+N and GSM. Let the label transition matrix be represented as Lbk,bk+1, which defines the transition probability from label bk to yj+1bk+1. The emission matrix is defined as Ok,bk, which denotes the emission probability of label bk given the hidden representation GM. The hidden representation at the M-th layer is denoted as GM, and the conditional probability is expressed as o(b|GM). For a given label sequence b=(b1, b2, …, bv), the output distribution of the hidden vector GM at the M-th layer for S+N and S can be formulated as:
$o\left( b|{{G}^{M}} \right)=SoftMax\left( \mathop{\sum }_{k=0}^{v}{{L}_{{{b}_{k}},{{b}_{k+1}}}}+\mathop{\sum }_{k=1}^{v}{{O}_{k,{{b}_{k}}}} \right)$ (4)
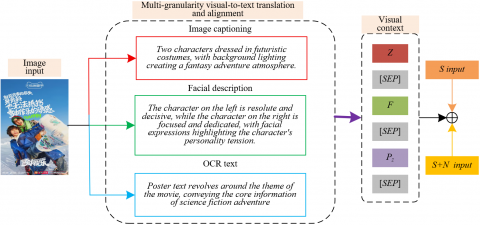
This character-level fine-grained alignment mechanism not only addresses the traditional limitations in processing emotionally salient text embedded within images but also enables the transformation of strongly emotion-oriented character information into computationally tractable attribute-level sentiment units through cross-modal semantic mapping. This process provides fine-grained semantic support for sequence labeling performed by the subsequent Conditional Random Field (CRF) layer. It enables precise identification of direct correlations between character-level textual features—at both the word and phrase levels—and their corresponding emotional attributes. As a result, the model’s capacity to analyze key emotional carriers in advertising images, such as slogans and brand taglines, is significantly enhanced. An illustration of the multi-granularity visual-to-text translation and alignment for advertising images is provided in Figure 2.
Figure 2. Schematic illustration of multi-granularity visual-to-text translation and alignment for advertising images
2.2 Multi-scale visual attribute-viewpoint fusion in advertising images
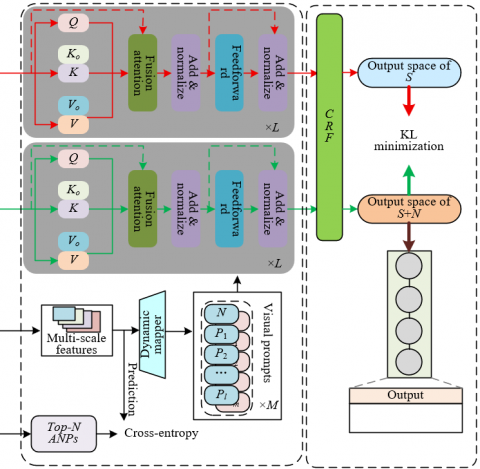
In the proposed model, multi-scale visual attribute-viewpoint fusion is designed to enable in-depth extraction and cross-modal integration of layered emotional information embedded within advertising images through three core subtasks. The architecture of this fusion framework is illustrated in Figure 3. The multi-scale visual feature subtask focuses on constructing a hierarchical feature set that spans different semantic levels of the image. Using visual backbones such as ResNet, features are extracted across pixel-level (color and texture), region-level (object layout), and object-level (product-specific details) dimensions. These multi-scale features comprehensively encode visual cues ranging from global scene ambiance to local details and character-level textual elements, thereby providing a rich visual basis for attribute-level sentiment analysis. The top-V visual attribute-viewpoint subtask aims to extract the most salient top-V adjective-noun pairs (ANPs) in the image, such as vibrant-color, delicate-packaging, or joyful-expression, through the prediction of visual models. These ANPs are used as supervisory signals to guide the model’s attention toward emotion-critical attributes and their associated sentiment viewpoints. This process effectively suppresses low-relevance visual noise and enhances the model’s capacity to identify the core emotional properties of advertising imagery. The third subtask, prompt-based dynamic visual fusion, facilitates deep interaction between multi-scale visual features and textual semantics using the Transformer architecture in BERT. Specifically, visual cues are encoded as prefix prompts embedded into the key and value streams during textual processing. This enables the model to dynamically integrate vision-language information during encoding. A differential training strategy was implemented for pure text input S and mixed modality input S+N. In the pure text case, the model is optimized for intrinsic semantic representation, while in the multimodal setting, visual prompts are used to guide the model in capturing attribute-level emotional associations between visual and textual modalities. To suppress irrelevant visual interference, the KL divergence between the output distributions of the pure-text and mixed-input pathways was minimized. Through this approach, precise fusion is achieved between emotional viewpoints—distributed across attributes such as color, objects, and text—and their corresponding textual semantics. Fine-grained cross-modal semantic support is thereby provided for attribute-level sentiment classification.
Figure 3. Architecture of multi-scale visual attribute-viewpoint fusion in advertising images
(a) Multi-scale visual features of advertising images
The multi-scale visual feature subtask in advertising images is designed to construct a hierarchical visual representation foundation for attribute-level sentiment analysis by capturing multi-dimensional visual cues ranging from global ambiance to local detail. This is achieved through a tiered feature extraction and fusion mechanism. Given that advertising images often exhibit both holistic emotional ambiance and localized salient details, ResNet is adopted as the visual encoder. Shallow layers of the ResNet are employed to capture low-level visual features such as pixel-level color, texture, and edge contours, while deeper layers are used to extract object-level semantics and abstract scene-level concepts. This results in a layered feature output that spans different receptive fields. In addition, YOLOv5x6 is incorporated as an object detector to locate key regions within advertising images. The top C regions with the highest confidence scores are retained to extract local fine-grained features, thereby minimizing the influence of background noise. During the feature fusion stage, upsampling techniques were applied to integrate deep semantic features with shallow spatial features at the token level. This process produces a multi-scale feature map denoted as D= (D1, D2, ..., De), enabling the model to perceive both global emotional tone and local attribute details simultaneously. To enhance semantic aggregation of visual attributes, average pooling was subsequently used to reduce the dimensionality of the multi-scale feature maps. This operation provides a structured multi-scale visual input for the downstream tasks of top-N visual attribute-viewpoint extraction and dynamic visual fusion. It ensures that attribute-level sentiment classification across color, object, and text dimensions is grounded in hierarchically visual representations, thereby enabling precise cross-modal semantic alignment and emotional association mining. Let the fused multi-scale global image features and object-level features be denoted by [D1, D2, ..., De]H and [D1, D2, ..., De]Py, respectively. Each Du is mapped to a uniform dimensionality through average pooling, denoted by AVE, and the computation is formally defined as:
${{\left[ {{D}_{1}},{{D}_{2}},\ldots ,{{D}_{e}} \right]}_{H}};{{\left[ {{D}_{1}},{{D}_{2}},\ldots ,{{D}_{e}} \right]}_{{{P}_{y}}}}=Visual\_Encoder\left( \left[ H \right];\left[ {{P}_{y}} \right] \right)$ (5)
${{D}_{u}}=AVE\left( {{D}_{u}} \right)$ (6)
(b) Top-V visual attribute–viewpoint in advertising images
The top-V visual attribute–viewpoint subtask is designed to provide fine-grained supervisory signals by selecting high-confidence attribute–viewpoint pairs, addressing the semantic mapping challenge between multi-scale visual information and textual sentiment attributes in advertising images. Given the frequent use of object attributes and emotional viewpoints to convey marketing intent in advertising imagery, a pretrained ANP detector—DeepSentiBank—was employed. This detector analyzes the hierarchical visual representations produced by the multi-scale visual feature subtask and predicts the distribution over 2,089 potential ANPs. These ANPs span a wide range of attribute-level sentiment cues associated with objects, scenes, and text in advertising images. To mitigate the risk of error propagation due to noise from selecting a single highest-confidence ANP and to avoid the redundancy introduced by full-distribution supervision, the model selects the top-V ANPs ranked by prediction probability. These ANPs serve as the core supervisory signal, preserving high-salience and semantically diverse attribute–viewpoint combinations. This strategy ensures that emotionally significant visual elements are emphasized while background noise with low relevance is suppressed. During training, the cross-entropy loss function lossN was used to minimize the divergence between the model’s predicted ANP distribution O and the ground-truth top-V distribution H, thereby enhancing the model’s ability to detect attribute-level sentiment correlations such as color–vibrancy or packaging–premium. Let the trainable parameters be denoted by Q and y, and let f represent the dimensionality of BERT's textual embeddings. The predictive distribution O over the top-V ANPs is calculated as:
$O=SoftMax\left( {{Q}^{S}}\left( \frac{1}{e}\mathop{\sum }_{u=1}^{e}\left( {{D}_{u}} \right) \right)+y \right)$ (7)
lossN is defined as:
$los{{s}_{N}}=-H\log \left( O \right)$ (8)
Through this structured ANP supervision mechanism, the visual features of advertising images are transformed into computationally tractable attribute–viewpoint semantic units. These units provide explicit emotional dimension guidance for subsequent dynamic visual fusion, ensuring that visual attributes aligned with textual semantics are precisely located. As a result, deep cross-modal alignment and emotional integration at the attribute level are achieved.
(c) Prompt-based dynamic visual fusion in advertising images
The prompt-based dynamic visual fusion subtask is designed to achieve hierarchical integration of visual information and textual semantics through a dynamic attention mechanism, with the text modality serving as the core. This subtask addresses the challenge posed by complex visual contexts in advertising images that may interfere with accurate sentiment analysis. To enable precise mapping between visual elements and textual attributes, multi-scale features are first extracted via the visual encoder and used to generate a visual prompt vector Nm. This vector is then passed through a multilayer perceptron (MLP) for dimensionality reduction and normalization, yielding a projected signal compatible with the semantic space of BERT’s hidden layers. The transformation is formally expressed as:
$x_{u}^{m}=\frac{\text{exp}\left( MLP\left( {{D}_{u}} \right) \right)}{\mathop{\sum }_{j=m}^{e}\left( \text{exp}\left( MLP\left( {{D}_{u}} \right) \right) \right)}$ (9)
Within each Transformer block of the BERT architecture, the processed visual prompts are concatenated with the key and value vectors of the corresponding layer. This allows the visual information to be incorporated as a prefix prompt, participating directly in the multi-head attention computation. As a result, the model is guided to dynamically attend to visual cues that are contextually relevant to the current textual attribute during encoding. Specifically, Nm is mapped to the same embedding space as the text representation through linear transformation Qmσ, yielding the visual prompts σmj and σmn, which are prepended to the key and value vectors, respectively. The corresponding operations are defined as:
${{N}^{m}}=\left[ N_{H}^{m};N_{{{P}_{y}}}^{m} \right]=\mathop{\sum }_{u=1}^{e}\left( \beta _{u}^{m}\cdot {{D}_{u}} \right)$ (10)
$\left[ \sigma _{j}^{m};\sigma _{n}^{m} \right]=Q_{f}^{m}{{N}^{m}}$ (11)
Assuming that in the updated attention matrix, the query, key, and value vectors are represented by QmWGm-1, [σmj;QmjGm-1], and [σmn;QmnGm-1], respectively, the resulting fused attention can be expressed as:
$Fusio{{n}_{Attention}}= \frac{SoftMax\left( Q_{W}^{m}{{G}^{m-1}}\cdot \left[ \sigma _{j}^{m};Q_{j}^{m}{{G}^{m-1}} \right] \right)}{\sqrt{f}}\left[ \sigma _{n}^{m};Q_{N}^{m}{{G}^{m-1}} \right]$ (12)
Through normalized vectors computed by the dynamic mapping unit, the model is enabled to adaptively control the degree of visual feature integration across layers. Shallow layers are designed to emphasize alignment between character-level visual prompts and textual tokens, while deeper layers focus on high-level semantic fusion between global scene prompts and sentiment-bearing textual expressions. This mechanism preserves the dominant role of the text modality in attribute extraction, while leveraging visual prompts to filter irrelevant background elements. For instance, in advertising scenarios such as “limited-time offers,” this strategy allows the model to accurately capture the co-occurrence of red promotional labels in the visual input with textual sentiment phrases such as “rush” or “discount,” effectively avoiding interference from less relevant background components. Ultimately, through multi-level dynamic fusion, explicit associations are formed between multi-scale visual attributes and textual attributes. This results in a composite representation enriched with cross-modal semantic information, which is passed to the attribute-level sentiment classifier. The model's capability to decode multi-level emotional cues in advertising images is thereby significantly enhanced.
2.3 Text-centered multimodal training for the sentiment analysis model
To address the challenges posed by redundant visual information and the weakening of the text modality’s dominance, a text-centered multimodal training strategy was adopted. Through differentiated input processing and a selective backpropagation mechanism, this strategy enables the model to selectively utilize visual information while reinforcing the primacy of textual semantics. Two input modes are defined: pure text input S and text–image hybrid input S+N. These inputs are independently processed by the Transformer model to generate their respective hidden representations, denoted as GS and GS+N. During training, the cross-entropy loss function was first employed to compute the divergence between the model’s output distributions under the two input modes, o(b|GMS) and o(b|GMS+N). This forces the output distribution of the hybrid input S+N to align more closely with that of the text-only input, thereby filtering out visual noise unrelated to textual semantics in the advertising image. Notably, gradient backpropagation was applied only to the gradient loss of the pure text input S, ensuring that the text modality retains its central role in attribute extraction and sentiment classification. This prevents extensive visual content from overshadowing textual signals during gradient updates. For instance, when processing advertising images containing promotional slogans, this strategy enables the model to prioritize sentiment-related keywords such as “limited-time” and “special offer” in the text, while using visual prompts to selectively focus on salient visual elements like red promotional labels and price digits, suppressing interference from irrelevant background objects or cluttered scenes. The expression is as follows:
$los{{s}_{S+N}}=KL\left( o\left( b|G_{S+N}^{M} \right)||o\left( b|G_{S}^{M} \right) \right) =\mathop{\sum }_{b\in B}o\left( b|G_{S+N}^{M} \right)\text{log}\left( o\left( b|G_{S}^{M} \right) \right)$ (13)
This function loss is calculated as the negative log-likelihood of the ground-truth label sequence, and the minimization of lossS enhances the model’s ability to align text–visual attribute pairs such as price–affordability or packaging–premium. This ensures that visual information serves as a supplementary cue to textual semantics during multimodal fusion, rather than acting as the dominant factor. Let η, ω, and ε denote the weights used to modulate the contribution of each module within the overall objective function. The expressions are as follows:
$los{{s}_{S}}=-\mathop{\sum }_{u=1}^{v}\text{log}\left( o\left( b|G_{S}^{M} \right) \right)$ (14)
$los{{s}_{LSNXD}}=\eta \cdot {{M}_{S}}+\omega \cdot {{M}_{n}}+\varepsilon \cdot {{M}_{S+N}}$ (15)
This training strategy preserves the enhancing role of visual information in textual sentiment analysis while simultaneously addressing the interference introduced by complex visual contexts in advertising images through a text-centered gradient control mechanism. As a result, the model's ability to accurately capture cross-modal semantic associations at the attribute level is significantly improved. This approach is particularly well-suited to advertising scenarios in which text serves as a dominant guide for visual sentiment interpretation.
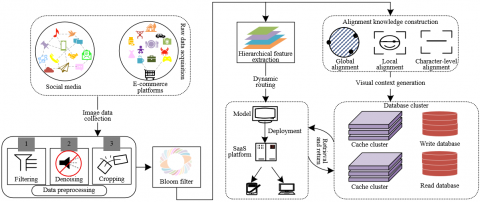
Figure 4 presents the architecture of the attribute-level sentiment analysis system designed for advertising image–text pairs. The system achieves end-to-end processing through the coordination of multiple functional modules, spanning from data acquisition to final sentiment analysis. Initially, advertising images are collected from various sources such as social media and e-commerce platforms. Following acquisition, the images undergo preprocessing operations, including filtering, denoising, and cropping, to remove irrelevant content. A layout parsing filter is then applied to analyze the spatial distribution of image elements, resulting in a clean and structured visual input for downstream processing. In the feature extraction and fusion layer, the multi-scale visual feature subtask is utilized to extract hierarchical visual attributes—encompassing global scenes, local objects, and textual characters—from advertising images. This process yields multi-scale feature representations. Simultaneously, cross-modal alignment between visual features and advertising texts is achieved through the prompt-based dynamic visual fusion mechanism, enabling the formation of semantic associations such as color–emotion and object–attribute. This enhances the complementarity between visual and textual information.
During model training, the top-V visual attribute–viewpoint supervision strategy was employed. A pretrained ANP detector was used to identify high-confidence ANPs, which serve as supervision signals. Sentiment prediction of vision-language fusion was then optimized using cross-entropy loss. A text-centered multimodal training strategy was further designed by differentiating between pure text and text–image hybrid inputs. KL divergence loss was applied to constrain the output of S+N to align with the semantic space of S, thereby filtering out unrelated visual noise and reinforcing the dominant role of textual semantics in attribute extraction. This setup improves the model’s ability to capture fine-grained cross-modal associations. In addition, the system incorporates a floating matrix construction module to encode visual elements of advertising images in a structured format. This is supported by a set of data resources, including a preprocessing library, caching modules, and a knowledge base, all of which provide efficient support for both training and inference phases. Ultimately, the system enables end-to-end processing that spans multi-scale attribute parsing, semantic alignment between image and text, and sentiment viewpoint classification. Sentiment tendencies are output across dimensions such as product and scene, offering fine-grained multimodal insights into advertising effectiveness and consumer emotion. By tightly integrating visual and textual information, the system enhances both the accuracy and robustness of attribute-level sentiment analysis.
Table 1. Performance comparison (%) between the proposed method and existing models on the advertising image sentiment analysis task
|
Modality |
Model |
Visual Genome |
Flickr30k Entities |
||||
|
P |
R |
F1 |
P |
R |
F1 |
||
|
Text |
ELECTRA |
52.8 |
52.9 |
52.6 |
58.6 |
62.3 |
61.2 |
|
LLaMA |
65.4 |
61.5 |
61.5 |
54.2 |
58.5 |
56.8 |
|
|
Longformer |
61.2 |
63.4 |
62.8 |
64.5 |
64.5 |
64.5 |
|
|
DeBERTa |
57.8 |
57.9 |
62.5 |
64.5 |
63.5 |
63.2 |
|
|
DistilBERT |
61.5 |
64.5 |
62.6 |
61.5 |
65.2 |
65.8 |
|
|
Text + Image |
UNITER |
61.3 |
62.3 |
62.8 |
62.8 |
62.8 |
61.5 |
|
FLAVA |
62.8 |
62.8 |
62.4 |
66.2 |
62.8 |
62.8 |
|
|
ASGCN |
48.5 |
45.8 |
47.5 |
54.8 |
54.5 |
55.5 |
|
|
RAM |
43.2 |
46.2 |
44.6 |
55.2 |
53.5 |
52.4 |
|
|
HAN |
66.4 |
62.5 |
63.5 |
66.8 |
64.5 |
64.8 |
|
|
XLNet |
62.8 |
65.8 |
64.5 |
66.5 |
68.9 |
66.3 |
|
|
CycleGAN |
64.5 |
68.9 |
66.8 |
64.8 |
67.5 |
66.8 |
|
|
PointNet++ |
64.2 |
67.4 |
66.5 |
65.2 |
67.2 |
66.4 |
|
|
X-VLM |
66.9 |
67.5 |
67.8 |
64.8 |
66.5 |
66.2 |
|
|
Proposed method |
68.9 |
71.5 |
72.3 |
67.9 |
67.5 |
67.8 |
|
Table 2. Ablation study results of the proposed method (%)
|
Model Configuration |
Visual Genome |
Flickr30k Entities |
||||
|
P |
R |
F1 |
P |
R |
F1 |
|
|
Full model |
78.5 |
81.5 |
82.5 |
77.5 |
77.2 |
77.5 |
|
Without the local and character-level fine-grained alignment |
67.2 |
71.6 |
68.9 |
65.2 |
66.4 |
65.2 |
|
Without the global and character-level fine-grained alignment |
66.5 |
71.8 |
68.1 |
65.4 |
66.8 |
66.4 |
|
Without the global and local fine-grained alignment |
66.4 |
71.5 |
67.5 |
64.8 |
65.9 |
65.8 |
|
Local + character-level fine-grained alignment only |
66.8 |
71.6 |
68.2 |
65.2 |
67.2 |
66.2 |
|
Global + character-level fine-grained alignment only |
67.2 |
71.8 |
71.5 |
65.8 |
67.4 |
66.8 |
|
Global + local fine-grained alignment only |
68.5 |
72.8 |
71.6 |
66.9 |
67.9 |
67.9 |
|
Without the multi-granularity visual-to-text translation and alignment for advertising images |
69.5 |
67.8 |
66.8 |
63.5 |
65.4 |
64.2 |
|
Without the top-V visual attribute–viewpoint subtask |
64.2 |
71.6 |
67.5 |
65.8 |
65.2 |
65.2 |
|
Without the prompt-based dynamic visual fusion of advertising images |
68.5 |
68.9 |
66.5 |
62.5 |
63.4 |
62.3 |
|
Without the text-centered multimodal model training |
65.3 |
71.5 |
68.9 |
66.5 |
66.9 |
66.8 |
Figure 4. System architecture for attribute-level sentiment analysis in advertising images and texts
A detailed examination of the performance data presented in Table 1 reveals the superior effectiveness of the proposed model in advertising image sentiment analysis. On the Visual Genome dataset, an F1-score of 72.3% was attained, significantly surpassing both text-only models and baseline multimodal frameworks. On the Flickr30k Entities dataset, the proposed model achieved an F1-score of 67.8%, outperforming competitive counterparts such as the eXtensible Vision-Language Model (X-VLM). Specifically, text-dominant models demonstrated limited capability in capturing visual–sentiment associations due to the absence of visual inputs, leading to lower accuracy of sentiment analysis. For instance, the highest F1-score achieved among text-only models on the Visual Genome dataset was merely 62.6%, markedly lower than the 72.3% attained by the proposed approach. This performance gap underscores the indispensable role of visual information in the sentiment analysis of advertising images. Although certain text + image models such as the UNiversal Image-TExt Representation (UNITER) and the Foundational Language and Vision Alignment (FLAVA) incorporated visual information, they lacked targeted optimization for the multi-scale alignment challenges inherent in advertising scenarios. The Aspect-specific Graph Convolutional Networks (ASGCN), for example, yielded an F1-score of only 47.5%, which was primarily attributed to its inability to model fine-grained visual–textual correlations, thereby resulting in suboptimal semantic fusion. By contrast, the proposed model employed a hierarchical alignment mechanism that enabled precise mapping among visual elements, textual attributes, and affective viewpoints. This design facilitated a 1.6 percentage point improvement in F1-score over X-VLM on the Flickr30k dataset, thereby confirming the critical importance of cross-modal alignment. Furthermore, the integration of multi-scale visual attribute fusion and a text-centered training strategy enabled comprehensive extraction of affective features while suppressing irrelevant visual noise.
In summary, the experimental findings robustly validate the innovative design of the proposed model, which leverages multi-granular alignment, hierarchical visual fusion, and a text-centered training paradigm to achieve significant performance gains on public benchmark datasets. This approach successfully addresses long-standing challenges in advertising image sentiment analysis, including weak cross-modal semantic association, visual noise interference, and difficulty in multi-scale attribute fusion. Beyond surpassing existing techniques, the model offers a highly accurate and efficient solution for fine-grained sentiment understanding in advertising contexts, demonstrating both practical value and scholarly innovation.
The ablation study results presented in Table 2 confirm the superior performance of the complete model on both the Visual Genome and Flickr30k Entities datasets. On the Visual Genome dataset, the proposed method achieved a precision of 78.5%, a recall of 81.5%, and an F1-score of 82.5%. Similarly, an F1-score of 77.5% was attained on the Flickr30k Entities dataset, substantially outperforming all ablated variants. When any one of the fine-grained alignment mechanisms—global, local, or character-level—was removed, the F1-score dropped to 68.9% and 65.2%, respectively, indicating that the alignment of multi-scale visual elements, including global scenes, local objects, and embedded textual characters, constitutes the foundation for accurate multimodal semantic correlation. The removal of any alignment granularity was shown to impair sentiment feature extraction. Moreover, when only a single alignment granularity was retained, the F1-score was limited to 68.2%, far below that of the full model, underscoring that the fusion of multi-scale visual attributes is essential for comprehensive sentiment understanding in advertising images. When the text-centered multimodal training strategy was excluded, the F1-score declined to 69.8%, revealing the importance of this strategy in filtering irrelevant visual noise through loss function constraints. This mechanism was found to preserve the dominant role of the textual modality in attribute-level sentiment analysis. As a result, the model was still able to accurately identify core sentiment associations—such as “price–affordability”—even in the presence of distracting visual content, thereby enhancing generalization capability.
Taken together, these findings demonstrate that the proposed attribute-level sentiment analysis model—grounded in multi-level vision-language alignment and fusion—significantly improves the precision of sentiment feature extraction and the capture of cross-modal semantic associations through the joint optimization of multi-granularity alignment, multi-scale visual fusion, and text-centered training. The model achieved consistently high performance across benchmark datasets. This confirms the model’s effectiveness and its potential to serve as a robust and efficient technical solution for fine-grained sentiment analysis in advertising scenarios, offering substantial practical value.
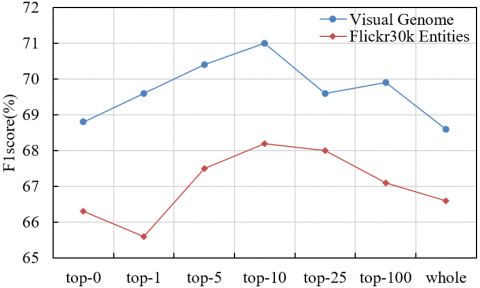
Figure 5. Sensitivity analysis of model performance with respect to top-V visual attribute–sentiment pairs
Figure 5 illustrates the sensitivity of model performance to the number of top-V visual attribute–sentiment pairs. On the Visual Genome dataset, the F1-score increased steadily from 69% to 71% as the number of top-V pairs increased from 0 to 10, indicating that the inclusion of the top 10 high-confidence visual attribute–sentiment pairs significantly enhanced the model’s ability to capture cross-modal semantic associations. This trend confirmed the essential role of the top-N visual attribute–viewpoint subtask, in which the top-N ANPs were selected as supervisory signals. This approach was shown to avoid the error propagation of individual ANPs while filtering out redundant noise from the full distribution. On the Flickr30k Entities dataset, the F1-score reached 68.5% when top-10 ANPs were employed, outperforming both the top-1 and full-distribution (whole) conditions. This result demonstrated the generalizability of the visual attribute–sentiment pair selection strategy for advertising images, with the top 10 high-confidence ANPs offering an optimal trade-off between supervision quality and quantity. Performance degradation was observed when the number of selected ANPs exceeded 10, due to the introduction of low-confidence pairs that introduced semantic noise and interfered with text-centered sentiment inference.
The results confirmed that optimal performance was achieved at top-10, validating the mechanism’s ability to focus on the most salient visual–sentiment associations within advertising images. This effect aligned closely with the multi-scale visual fusion subtask, in which the top 10 ANPs served as supervisory signals that guided the alignment of multi-scale visual features with textual semantics, thereby improving the precision of the mapping between visual elements, textual attributes, and sentiment viewpoints. The variation in model performance across different top-V configurations was found to be tightly coupled with the proposed system’s multi-granularity vision-language alignment, dynamic visual fusion, and text-centered multimodal training strategy. Specifically, the top 10 ANPs were shown to synergize with multi-granularity alignment by enabling fine-grained correspondence between visual elements and text across scales. Through dynamic visual fusion, these associations were embedded into the key/value prefix structure of BERT, enhancing cross-modal semantic understanding. When top-V exceeded 10, the text-centered training mechanism was observed to suppress noise from low-quality ANPs via loss function constraints, preserving the dominance of textual features in sentiment analysis. This coordinated design enabled the model to achieve peak performance at top-10, thereby demonstrating both the efficiency and robustness of the proposed method in sentiment analysis of advertising images.
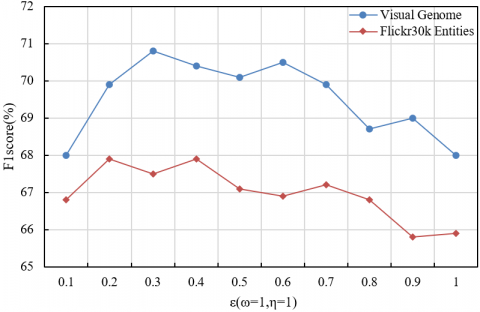
Figure 6. Sensitivity analysis of the hyperparameter ε (with ω = 1 and η = 1)
Figure 6 illustrates the effect of the hyperparameter ε (with ω = 1 and η = 1) on model performance in terms of F1-score. On the Visual Genome dataset, as ε increased from 0.1 to 0.3, the F1-score rose from 68% to 71%, indicating that a moderate increase in ε strengthened the supervisory signal for vision-language alignment. This enhancement improved the precision in matching attribute pairs such as “price–affordability.” However, performance degraded when ε exceeded 0.3, due to the overemphasis on visual features, which introduced noise and weakened the dominance of the textual modality. A similar trend was observed on the Flickr30k Entities dataset, where the optimal F1-score of 68% was achieved at ε = 0.3. This outcome confirmed the pivotal role of ε in regulating the effectiveness of multimodal fusion. The observed behavior aligned with the loss function’s design, in which the contributions of text, vision, and noise modules were jointly regulated by η, ω, and ε. At ε = 0.3, visual information was effectively supplemented while irrelevant noise was suppressed, thus mitigating interference from redundant visual content.
In summary, the empirical findings demonstrated that the optimal setting of ε = 0.3 yielded superior performance across both Visual Genome and Flickr30k Entities datasets. These results validated the efficacy of the loss function and the coordinated multi-module framework. By balancing visual and textual information while mitigating noise, the proposed model significantly enhanced both the precision and robustness of sentiment analysis in advertising images. Moreover, the hyperparameter-controlled framework offered an efficient solution for capturing fine-grained cross-modal sentiment associations, underscoring its theoretical significance and practical applicability.
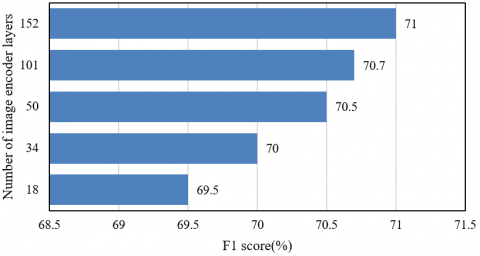
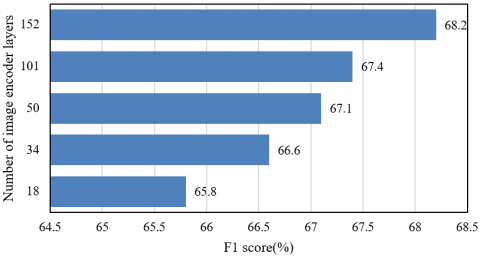
As shown in Figure 7, the F1-score consistently increased with the number of image encoder layers on both the Visual Genome and Flickr30k Entities datasets. On the Visual Genome dataset, an encoder with 152 layers achieved an F1-score of 71%, representing a 1.5% improvement over the 18-layer variant. Similarly, on the Flickr30k Entities dataset, the 152-layer encoder yielded an F1-score of 68.2%, surpassing the 18-layer model by 2.4%. These results indicate that deeper encoders facilitated the extraction of richer multi-scale visual features, encompassing both abstract global semantics and fine-grained local textures, thereby providing hierarchical visual representation for vision-language alignment. For instance, the increased receptive field of deeper networks enhanced the model's ability to capture intricate associations in advertising imagery, such as "premium packaging – golden texture – positive sentiment toward product quality" more accurately, enhancing the accuracy of multimodal semantic fusion. At the same time, diminishing returns were observed as encoder depth increased, suggesting that the coordinated multi-module framework balanced feature richness with computational efficiency and prevented overfitting, thereby ensuring the effectiveness of deep encoding.
(a) Visual Genome dataset
(b) Flickr30k Entities dataset
Figure 7. Performance comparison across different numbers of image encoder layers
In summary, experimental results demonstrated that the proposed model exhibited superior performance in advertising image sentiment analysis by optimizing the depth of the image encoder and integrating a coordinated design of multi-granularity alignment, dynamic visual fusion, and a text-centered training strategy. The adoption of a deeper encoder enhanced the extraction of multi-scale visual features, while the collaborative functioning of multiple modules enabled precise capture of associations between visual and textual semantics. This effectively addressed the limitations of shallow visual feature hierarchies and insufficient cross-modal semantic fusion. The model achieved a high F1-score on public benchmark datasets, thereby validating its effectiveness. A robust and efficient solution was thus provided for fine-grained sentiment analysis in advertising scenarios, offering significant value for both academic research and real-world applications.
As for the attribute-level sentiment analysis task in advertising images, a hierarchical vision-language alignment and fusion model was proposed. By integrating multi-granularity vision-language alignment, multi-scale visual attribute fusion, and text-centered training, a complete framework was established for feature extraction and cross-modal semantic integration. The core components of the framework comprise the following: (a) Multi-granularity alignment was applied to global scenes, local objects, and character-level text in advertising images, enabling a precise mapping from visual elements to textual attributes and sentiment viewpoints. This approach effectively addressed the issue of weak visual-textual semantic associations. (b) Top-V visual attribute-viewpoint pairs and dynamic visual prompts were fused to extract multidimensional sentiment features—such as color, shape, and embedded text content—thereby enhancing the accuracy of fine-grained sentiment analysis. (c) A text-centered training paradigm was adopted to suppress irrelevant visual noise and reinforce the dominant role of text, thereby improving model robustness in complex contexts.
Empirical results confirmed the model’s effectiveness. On the Visual Genome dataset, an F1-score of 72.3% was achieved, while an F1-score of 67.8% was obtained on the Flickr30k Entities dataset, both significantly outperforming pure-text baselines and multimodal benchmarks. Ablation studies demonstrated that the removal of core components led to a decline in F1-score by 5%–10%, underscoring the necessity of coordinated optimization. Sensitivity analyses revealed that performance peaked in terms of supervision quality and feature hierarchy when the top 10 visual attribute pairs were used (F1-score = 71%) and when a 152-layer image encoder was employed (F1-score = 71%), validating the rationality of the model’s design.
Several limitations remain. First, data dependence persists, as annotation of non-public datasets incurs high costs, restricting model generalizability. Second, the computational complexity associated with deep modules results in slower inference, hindering deployment in real-time scenarios. Third, cross-domain generalization remains limited, with reduced robustness when processing low-quality images or multilingual textual content. Future research may be directed toward the following areas: (a) the adoption of self-supervised or weakly supervised learning strategies to reduce reliance on annotations; (b) model lightweighting techniques to enhance inference efficiency; and (c) cross-lingual and cross-cultural extensions to improve scalability in global applications.
In summary, through innovative design, a robust solution was provided to the core challenges of sentiment analysis in advertising imagery, providing both theoretical and technical support for the domain. Future efforts focusing on efficient data utilization, lightweight architecture design, and cross-domain generalization are expected to further promote the practical deployment and scholarly development of advertising sentiment analysis technologies, thereby supporting the intelligent evolution of the advertising industry.
[1] Lee, J., Cho, M. (2022). The (in) congruency effects of message framing and image valence on consumers’ responses to green advertising: Focus on issue involvement as a moderator. Journal of Marketing Communications, 28(6): 617-636. https://doi.org/10.1080/13527266.2021.1900893
[2] Kim, T., Seo, H.M., Chang, K. (2017). The impact of celebrity-advertising context congruence on the effectiveness of brand image transfer. International Journal of Sports Marketing and Sponsorship, 18(3): 246-262. https://doi.org/10.1108/IJSMS-08-2017-095
[3] Kou, Q., Liu, R., Lv, C., Jiang, H., Cheng, D. (2023). Advertising image saliency prediction method based on score level fusion. IEEE Access, 11: 8455-8466. https://doi.org/10.1109/ACCESS.2023.3236807
[4] Rehman, F.U., Al-Ghazali, B.M. (2022). Evaluating the influence of social advertising, individual factors, and brand image on the buying behavior toward fashion clothing brands. Sage Open, 12(1): 21582440221088858. https://doi.org/10.1177/21582440221088858
[5] Le, W.T., Maleki, F., Romero, F.P., Forghani, R., Kadoury, S. (2020). Overview of machine learning: Part 2: Deep learning for medical image analysis. Neuroimaging Clinics, 30(4): 417-431. https://doi.org/10.1016/j.nic.2020.06.003
[6] Li, L., Yin, X.L. (2023). Image classification algorithm based on proposal region clustering learning-unsupervised deep learning. Journal of Electrical Engineering & Technology, 18(2): 1337-1349. https://doi.org/10.1007/s42835-022-01227-8
[7] Hyun, Y., Kim, D. (2022). Development of deep-learning-based single-molecule localization image analysis. International Journal of Molecular Sciences, 23(13): 6896. https://doi.org/10.3390/ijms23136896
[8] Endo, T., Matsumoto, M. (2022). Aurora image classification with deep metric learning. Sensors, 22(17): 6666. https://doi.org/10.3390/s22176666
[9] Martin-Cardaba, M.A., Porto-Pedrosa, L., Verde-Pujol, L. (2022). Representación de la belleza femenina en publicidad. Efectos sobre el bienestar emocional, la satisfacción corporal y el control del peso en mujeres jóvenes. Profesional de la informaciÓn, 31(1): e310117. https://doi.org/10.3145/epi.2022.ene.17
[10] Li, D., Atkinson, L. (2020). Effect of emotional victim images in prosocial advertising: The moderating role of helping mode. International Journal of Nonprofit and Voluntary Sector Marketing, 25(4): e1676. https://doi.org/10.1002/nvsm.1676
[11] Lv, Y., Huang, G., Yan, Y., Xue, J.H., Chen, S., Wang, H. (2024). Visual-textual attribute learning for class-incremental facial expression recognition. IEEE Transactions on Multimedia, 26: 8038-8051. https://doi.org/10.1109/TMM.2024.3374573
[12] Sjöberg, M., Laaksonen, J., Pöllä, M., Honkela, T. (2006,). Retrieval of multimedia objects by combining semantic information from visual and textual descriptors. In Artificial Neural Networks - ICANN 2006: 16th International Conference, Athens, Greece, pp. 75-83. https://doi.org/10.1007/11840930_8
[13] Sevillano, X., Piatrik, T., Chandramouli, K., Zhang, Q., Izquierdo, E. (2012). Indexing large online multimedia repositories using semantic expansion and visual analysis. IEEE MultiMedia, 19(3): 53-61. https://doi.org/10.1109/MMUL.2012.28
[14] Liu, N., Dellandréa, E., Chen, L., Zhu, C., et al. (2013). Multimodal recognition of visual concepts using histograms of textual concepts and selective weighted late fusion scheme. Computer Vision and Image Understanding, 117(5): 493-512. https://doi.org/10.1016/j.cviu.2012.10.009
[15] Wang, J., Yang, Y., Liu, K., Zhu, Z., Liu, X. (2022). M3S: Scene graph driven multi-granularity multi-task learning for multi-modal NER. IEEE/ACM Transactions on Audio, Speech, and Language Processing, 31: 111-120. https://doi.org/10.1109/TASLP.2022.3221017
[16] Wang, J., Xu, Q., Jiang, B., Luo, B., Tang, J. (2024). Multi-granularity part sampling attention for fine-grained visual classification. IEEE Transactions on Image Processing, 33: 4529-4542. https://doi.org/10.1109/TIP.2024.3441813
[17] Su, Y., Zhao, H., Zheng, Y., Wang, Y. (2024). Few-shot learning with multi-granularity knowledge fusion and decision-making. IEEE Transactions on Big Data, 10(4): 486-497. https://doi.org/10.1109/TBDATA.2024.3350542
[18] Pham, C., Septianto, F. (2019). A smile–The key to everybody’s heart? The interactive effects of image and message in increasing charitable behavior. European Journal of Marketing, 54(2): 261-281. https://doi.org/10.1108/EJM-01-2019-0019
[19] Lee, J., Kim, J., Yu, J. (2015). Effects of congruence of product, visual image, and consumer self-image on art infusion advertising. Social Behavior and Personality: An International Journal, 43(10): 1725-1740. https://doi.org/10.2224/sbp.2015.43.10.1725
[20] Stokburger-Sauer, N.E., Hofmann, V., Schoner-Schatz, L. (2025). Smiling or sad faces in charity display advertising? A visual-verbal congruency approach considering the role of targeting. International Journal of Advertising, 44(4): 718-742. https://doi.org/10.1080/02650487.2024.2421643