Yong Shi*![]() | Jian Du
| Jian Du![]() | Miaomiao Wang
| Miaomiao Wang![]() | Xu Qiao
| Xu Qiao![]() | Weihua Wang
| Weihua Wang![]()
© 2025 The authors. This article is published by IIETA and is licensed under the CC BY 4.0 license (http://creativecommons.org/licenses/by/4.0/).
OPEN ACCESS
Sleep monitoring devices that use contact sensors or camera technology often compromise sleep quality and pose significant privacy risks. This paper investigates a novel sleep status recognition method employing 2D LiDAR technology, which enables low-cost, real-time monitoring of sleep quality while reducing privacy risks. The study systematically explores the behavior recognition normal framework based on 2D LiDAR, with a focus on point cloud data processing procedures and techniques. A comprehensive sleep status recognition framework is proposed, utilizing a single 2D LiDAR, encompassing three critical aspects: detecting target definition using DBSCAN clustering and quantitative calculation, identification of the same target object, and changes in the status of the same target object. Additionally, an experimental environment was developed for testing on subjects during afternoon naps. The results of ten experimental trials demonstrate that the proposed method is capable of effectively detecting changes in sleep states. Additionally, during object recognition, three distinct target objects were consistently identified, corresponding to the positions of the human head, waist, and legs. Further analysis of the data reveals that each experimental trial recorded 5 to 10 state changes, a frequency consistent with current public findings on sleep quality assessment. A detailed examination of the first group's data indicates minimal movement in the head (average displacement of 12.2 cm), substantial movement in the legs (average displacement of 50.6 cm), and moderate movement in the waist (average displacement of 18.2 cm). These variations in distance are not attributable to differences in LiDAR angles but align with commonly observed patterns of turning during human sleep. These findings provide valuable support for the advancement of low-cost sleep care solutions and related business opportunities.
framework, LiDAR technology, sleep status detection, non-invasive monitoring, single LiDAR
Driven by the rapid advancement of science and technology, human action recognition has found extensive applications in diverse fields such as video surveillance, human-computer interaction, virtual reality, health monitoring, and sports analysis [1-3]. In the field of sleep quality monitoring and intervention, traditional sleep monitoring devices such as Polysomnography (PSG) can provide detailed sleep data but require multiple sensors to be attached to the human body, potentially affecting sleep quality. Furthermore, the high cost, complexity, and reliance on specialized personnel limit the widespread adoption of PSG [4]. Although camera-based monitoring systems offer a non-contact solution, which has proven to be immensely successful and widely utilized, but they pose significant risks to personal privacy [5]. Consequently, developing a non-invasive sleep behavior recognition technology that safeguards personal privacy holds substantial practical significance and can be widely applied in areas such as home health monitoring, elderly care, and sleep disorder diagnosis [6, 7].
Presently, methods for acquiring human behavior information can be categorized into two primary types. The first type involves contact-based sensors, exemplified by wearable electronic devices like inertial measurement units [8-11]. The second type encompasses non-contact sensors, which can be further subdivided into video-based approaches [12-14] and wireless sensing technologies utilizing radar [15-17] and WIFI [18, 19] to capture human body information, as illustrated in Figure 1.
Figure 1. Human identification and property estimation research hierarchy
It is inevitable that video camera-based object detection, person tracking, or property estimation mechanisms are more effective and suitable. But it is easily affected by some natural calamities, lighting limitations, processing deficiencies, and environmental issues [20, 21]. On the other hand, people are claiming their privacy and secrecy in a video-based surveillance system [22, 23]. That's why modern research focuses on an alternative approach that will not compromise privacy but ensures security.
LiDAR-based surveillance is rapport, real-time computable, and has a wide range covering applications which could be a new era of research. People introduced parallel sensors set up with the camera to solve these constraints, even individual acquisition techniques rather than cameras [24]. The LiDAR-based estimations can be sub-divided into two classes: 3-dimensional (3D) LiDAR-based and another one is 2-dimensional (2D) LiDAR-based approaches.
3D LiDAR technology has been widely applied in autonomous driving [25], behavior recognition, and other domains [26]. To construct accurate 3D maps, laser radar sensors, visual cameras, and depth sensors are commonly employed to achieve high-precision trajectory detection and tracking. Generally speaking, the advantages of high-cost and high-precision technologies can be justified and further developed. However, 3D LiDAR captures not only the 3D shape of the target object but also additional viewpoint information, raising concerns about potential privacy disclosure [15, 27]. In contrast, 2D LiDAR sensors only measure distance values within a 2D plane, providing no identifiable personal details and thus eliminating the risk of privacy leakage.
Compared to 3D technology [28], the 2D LiDAR-based system is faster, easier to implement, and more computationally rigorous under challenging conditions, with relatively low cost [29, 30]. Therefore, it can be inferred that there is significant potential for LiDAR-based applications in the coming years. These applications may range from short-term to long-term tracking and can involve single-sensor or multi-sensor configurations. Additionally, some systems are capable of tracking only a single object, while others can track multiple objects simultaneously.
In this study, we conduct research on innovative applications of 2D LiDAR technology in elderly health monitoring. With the intensification of global aging trends, sleep quality and safety concerns among the elderly have become a focal point of societal attention. According to statistical data, sleep quality issues are closely associated with various chronic diseases, such as cardiovascular diseases, diabetes, and others [31-33]. The research findings presented in this paper are anticipated to provide valuable support to professionals in the field, offering innovative technical solutions and cost-effective approaches.
Our specific contributions to the field of non-contact behavior recognition research are as follows: (1) By utilizing a single 2D LiDAR sensor, we developed a low-cost and high-quality method for acquiring and quantifying sleep-related behaviors. (2) In the process of object description based on DBSCAN clustering results, we identified three distinct target clusters corresponding to the positions of the human head, waist, and legs. (3) The findings of this study can be extended to demonstrate that during sleep state transitions, the head, waist, and legs exhibit varying degrees of movement, with the head showing the smallest amplitude of change and the legs exhibiting the largest amplitude. The remainder of this paper is structured as follows: Section 2 provides a comprehensive academic review, outlining the general methodology for behavior analysis based on 2D point cloud data processing and computation. Section 3 elaborates on the innovative methods proposed in this study, including formal representations and quantitative approaches for object modeling, identification of the same target object, and perception of dynamic changes. Section 4 details the experimental design for practical testing, covering experiment preparation, procedures, and data analysis. Finally, the paper concludes with a discussion, summary, and acknowledgments.
2.1 Normal mode of behavior recognition using 2D LiDAR
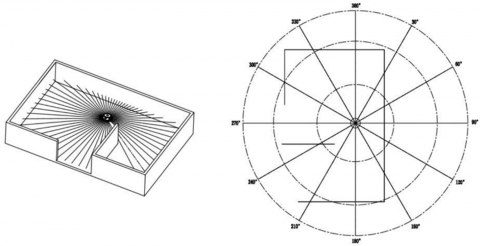
Based on the deployment angle, 2D LiDAR is capable of performing 360° two-dimensional shape scanning at any orientation through the emission and reception of laser beams. It can conduct angle measurement, distance calculation, and other relevant computations on the two-dimensional plane, enabling precise characterization of the local features or current layer of the target object, as well as effective detection of dynamic changes. The schematic representation of the scanning results is depicted in Figure 2, which provides an intuitive and clear illustration of the structural characteristics of the target spatial object within the current plane.
Figure 2. Diagram of scanning space of 2D LiDAR
Figure 3. Human body scanning normal framework based on 2D LiDAR
Given that the information acquired via two-dimensional scanning is constrained to a single planar direction and the scanning range is limited (typically around 10 meters), it is feasible to perceive the local or specific-layer dynamic changes of the scanned object within the two-dimensional plane. This implies that behavior perception based on a single radar is achievable. Nevertheless, for a more comprehensive understanding of the target object, multiple LiDAR collaboration modes can be established, as depicted in Figure 3. In this configuration, one LiDAR unit is tasked with distance perception of the legs, while another focuses on head perception. By leveraging two-dimensional LiDAR sensors at different layers, the actual contour of the target individual can be reconstructed [34-36], thus enabling more extensive and detailed body data compared to that obtained using a single 2D radar.
2.2 Point cloud data and processing
LiDAR technology acquires the spatial position and shape information of objects by emitting laser beams and capturing the reflected signals, thereby generating point cloud data. Common formats for storing this point cloud data include OFF (Object File Format), PLY (Polygon File Format, also known as the Stanford Triangle Format), and RTX (a format specifically designed for laser scan data). Notably, the PTS format, an ASCII-based interchange format for point cloud data, is recognized for its simplicity and ease of use due to its straightforward structure, as illustrated in Table 1 [37, 38].
Table 1. PTS data format of point cloud
|
Total |
Point 1 |
... |
Point n |
||||
|
Number |
Coordinate |
Strength |
Color |
... |
Coordinate |
Strength |
Color |
Figure 4. Point cloud data and segmentation based on 2D LiDAR
The first line specifies the total number of points. Each subsequent line contains seven values: the first three represent the (x, y, z) coordinates of a point, the fourth value denotes the intensity, and the last three values correspond to the (r, g, b) color estimates. The (r, g, b) components range from 0 to 255, represented as single unsigned bytes. The intensity value provides an estimate of the proportion of incident radiation reflected by the surface, where 0 indicates minimal reflectivity and 255 indicates maximal reflectivity. As illustrated in Figure 4, the point cloud is segmented into several clusters and visualized using different colors.
Lidar-based behavior recognition data processing involves several critical steps, including point cloud preprocessing, segmentation, and object recognition. Point cloud preprocessing forms the foundation for subsequent analysis, encompassing essential operations such as noise removal, filtering, registration, and down-sampling [39]. Point cloud segmentation aims to partition the data into subsets with homogeneous attributes, such as ground, buildings, and vehicles. Traditional segmentation methods primarily rely on clustering algorithms like K-means and DBSCAN [40]. In recent years, deep learning-based approaches, such as PointNet and PointNet++, have also been widely applied to point cloud segmentation tasks, achieving significant improvements in accuracy and efficiency [41]. Point cloud recognition focuses on identifying specific objects within the data, such as pedestrians and vehicles. Deep learning models, including VoxelNet and SECOND [42], have achieved state-of-the-art performance in point cloud recognition tasks [43].
2.3 Point cloud data segmentation and representation
Point cloud segmentation aims to enhance the representation of scanned objects by capturing their characteristics, such as area proportion and high reflectance intensity. In this paper, point cloud data segmentation is implemented using DBSCAN clustering technology, with each segmentation result being treated as a detected target object. Given that the number of clusters in DBSCAN clustering results is non-deterministic, the number of target objects for detection in this study cannot be predetermined [44, 45]. As illustrated in Figure 5, the clustering test conducted in an office desk environment generated 12 clusters from the segmentation results.
(a) Test environment
(b) Point cloud data and clustering segmentation r
Figure 5. Point cloud data and segmentation based on 2D LiDAR
The DBSCAN algorithm has two critical parameters: the radius ε, which constrains the maximum distance between two points, and the minimum number of points M in a segment, denoted as MinPts. Based on these parameters, the point cloud is classified into three categories [46, 47]:
- Core points: Points that have at least MinPts neighboring points within their ε-neighborhood.
- Border points: Points that have fewer than MinPts neighboring points within their ε-neighborhood but are located in the neighborhood of a core point.
- Noise points: Points that are neither core points nor border points.
They are defined as follows:
Definition of Core Point p:
$\left\{\begin{array}{l}N_{\varepsilon}(p) \geq {MinPts} \\ N_{\varepsilon}(p)=\{q \in D \mid {dist}(p, q) \leq \varepsilon\}\end{array}\right.$ (1)
Definition of Boundary Point b:
$\left\{\begin{array}{c}b \notin\{p\} \\ b \in N_{\varepsilon}(p)\end{array}\right.$ (2)
Definition of Noise Point n:
$\left\{\begin{array}{l}n \notin\left\{p_i, i=1,2,3\right\} \\ n \notin N_{\varepsilon}\left(p_i, i=1,2,3\right)\end{array}\right.$ (3)
where, i is utilized to denote multiple clusters, meaning that the clustering process generates multiple object outcomes.
3.1 Formal definition and representation of target objects
This paper represents the detected target objects based on the clustering results, where the number of clustering clusters corresponds to the number of target objects. Each clustering cluster is treated as a single target object and is characterized by its center point coordinates, distance, and width. If T denotes a target object, then T is defined as (p, d, w), as presented in Definition 4.
$T=(p, d, w)$ (4)
Here, p denotes the core point of the detection object derived from the center point of the clustering cluster; d signifies the distance between the core point of the detection object and the origin of the LiDAR (denoted as X); w indicates the maximum width of the detection object.
To more accurately characterize and compute the distance between point clouds, this paper proposes the following formula for calculating the inter-point-cloud distance.
${dij}={dist}(p i, p j)$ (5)
where, pi, pj are used to express arbitrary point cloud point coordinates.
In Definition 4, d is defined as follows.
$d={dist}(p, X)$ (6)
In Definition 4, w can be calculated by algorithm 1.
Definition of algorithm 1:
(1)$\rightarrow$$b_i, b_j \in N_{\varepsilon}(p), i, j=1,2,3 \ldots$
(2)$\rightarrow$$d_i={dist}\left(b_i, b_j\right)$
(3)$\rightarrow$$w=max \left\{d_i, i=1,2,3 \ldots\right\}$
For any boundary points bi and bj within the same cluster, the distance between bi and bj is calculated, and the maximum distance obtained is denoted as w.
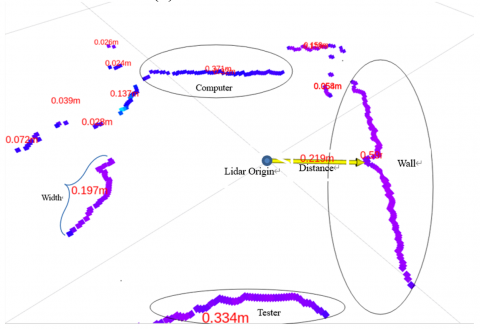
Figure 6. The diagram of target object representation
The overall representation of the target object is illustrated in Figure 6, where X denotes the coordinate origin of the radar, p represents the core point of the current clustering object, the width is 0.338m(w = 0.338), and the distance from the radar origin to the core point is 0.164m(d = 0.164).
3.2 Verification of identity for the same target
Due to the inability to preset and control the number of segments generated by DBSCAN clustering, multiple detection targets may exist. However, behavior state recognition focuses on a single target object; thus, the verification and identification of the same target serve as the foundation for behavior state recognition. This study determines whether two target objects are identical by calculating the distance between their center points. Specifically, two target objects are considered the same only if the distance between them is less than the width of either target object. The algorithm for determining identical detection targets is presented in algorithm 2.
Definition of algorithm 2:
(4)$\rightarrow$$Let\ T 1=(p 1, d 1, w 1), T 2=(p 2, d 2, w 2)$
(5)$\rightarrow$$d 12={dist}(p 1, p 2)$
(6)$\rightarrow$$if\ d 12<\frac{w 1}{2} \vee d 12<\frac{w 2}{2}$
(7)$\rightarrow$$then\ T 1=T 2$
(8)$\rightarrow$$Else\ T 1 \neq T 2$
Let the core points of the two objects be p1 and p2. If the distance between p1 and p2 is less than w1/2 and w2/2, where w1 and w2 are the widths of the two objects, respectively, then the two objects are considered to be the same.
3.3 Quantification of status transition
For the target objects T1 and T2, based on algorithm 2, if T1 and T2 are identified as the same perceived object, the change in distance from the laser radar origin to the object's position can be computed. This change is reflected by variations in d1 and d2. Specifically, the difference between d1 and d2 is utilized to quantify the distance variation of the detected object relative to the coordinate system origin, as shown in Definition 7. The algorithm for determining state changes is presented in algorithm 3.
$\Delta d=|d 1-d 2|, when \ T 1=T 2$ (7)
Definition of algorithm 3:
(1)$\rightarrow$$Let \ T 1=(p 1, d 1, w 1), T 2=(p 2, d 2, w 2)$
(2)$\rightarrow$$If\ T 1=T 2$
(3)$\rightarrow$$temp =|d 1-d 2|$
(4)$\rightarrow$$If temp \geq \varepsilon$
(5)$\rightarrow$$\Delta d=temp$
Here, $\varepsilon$ denotes the predefined clustering radius with a value of 1. By setting $\varepsilon$ as the threshold, it not only minimizes the impact of computational errors but also implies that two points within the same cluster may theoretically belong to different targets. However, such a scenario is practically infeasible.
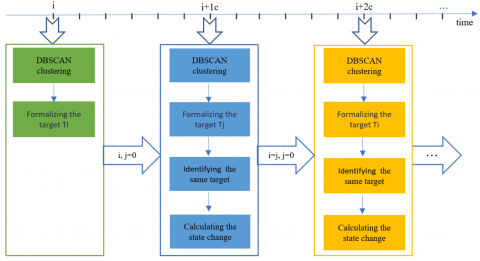
3.4 The framework and associated algorithm
The object state detection framework based on DBSCAN clustering, as illustrated in Figure 7, is proposed in this paper. In the figure, the X-axis denotes time, and the scale of the time coordinate axis corresponds to the scanning period of the LiDAR. The value c signifies the clustering calculation period in this study, which can generally encompass one or more radar scanning periods. Following each clustering computation, multiple scanning objects are generated. According to algorithm 2, these objects are evaluated to determine whether they represent the same entity. For identical objects, algorithm 3 is further employed to calculate the state changes before and after the specified time intervals.
Figure 7. The diagram of target object representation
The algorithm of this framework is formally described as follows:
Definition of algorithm 4:
(1)$\rightarrow$At the time i, the DBSCAN algorithm is executed for the perceived point cloud data. According to the clustering results (set to n), each result cluster is labeled with a perceived object, which is respectively labeled Ti, i=1 to n
(2)$\rightarrow$At the j moment, the DBSCAN algorithm is executed for the perceived point cloud data. According to the clustering results (set to n), each result cluster is marked with a perceived object, which is respectively marked as Tj, j=1 to n
(3)$\rightarrow$According to algorithm 2, whether Ti and Tj are the same target perception object
(4)$\rightarrow$If Ti and Tj are the same object, record the distance change according to Formula 7 and algorithm 3
(5)$\rightarrow$If the same object does not exist in Ti, the record changes seriously
(6)$\rightarrow$If Tj does not exist, it is considered that there is a serious sleep problem (falling off the bed, etc.), and the results are recorded.
4.1 Experiment design
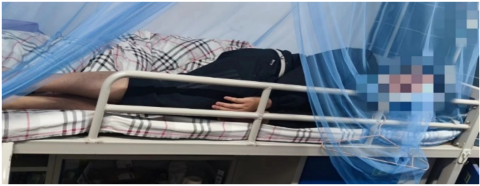
The LD19 radar (as depicted in Figure 10) was employed for this design. It features a minimum detection distance of 0.02 meters and a maximum of 12 meters. Leveraging DTOF technology, it is capable of conducting 4500 range measurements per second. This experiment replicated the sleep environments of the test subjects in dormitory settings and during lunch breaks, as illustrated in Figures 8 and 9.
Figure 8. The test environment and human body status
Figure 9. The test platform for 2D LiDAR dealing and visualization
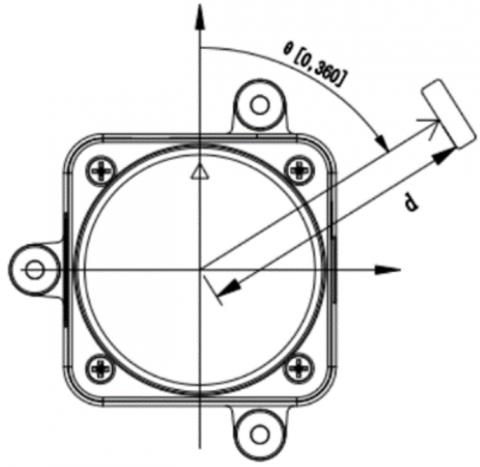
Figure 10. Block diagram of coordinate system and scanning direction
The experimental process is designed as follows:
(1) Experiment preparation, including platform development and coordinate transformation.
(2) Ten groups of volunteers were recruited to participate in the state perception experiment, which was conducted during the lunch break and lasted for 2–3 hours.
(3) For each volunteer, algorithm 4 (Set the clustering radius to 10 cm and the number of clusters to 10, considering that the average length of an adult's neck is around 12 cm.) was executed.
(4) The results were recorded, labeled, and analyzed.
4.2 Experiment prepare
4.2.1 Point cloud coordinate transformation
In this study, the LD19 2D LiDAR employs a left-handed coordinate system, with the origin positioned at the center of rotation. The zero-degree direction is designated as the forward direction, and the angular rotation follows a clockwise orientation, as depicted in Figure 10. The scanning range spans a planar region defined by a radius of d. Consequently, the initial step of the experiment involves transforming the left-handed coordinate system into a two-dimensional Cartesian coordinate system.
The original coordinates of the point cloud are represented in terms of distance and angle. The coordinate conversion algorithm refers to the process of transforming point cloud data captured by the radar into two-dimensional Cartesian coordinates. This is achieved by taking an angular parameter, denoted as angle, and verifying whether the specified angle falls within the predefined angular range, as illustrated below:
$\left\{\begin{array}{l}\mathrm{x}=\mathrm{r} * \cos (\text {angle}) \\ \mathrm{y}=\mathrm{r} * \sin ( {angle})\end{array}\right.$ (8)
4.2.2 DBSCAN upgrade
Update the traditional DBSCAN algorithm for the test as follows:
(1)$\rightarrow$Firstly, mark all objects in dataset D as unprocessed state.
(2)$\rightarrow$For each object p in dataset D do
(3)$\rightarrow$If p has already been assigned to a cluster or marked as noise then
(4)$\rightarrow$continue;
(5)$\rightarrow$else
(6)$\rightarrow$The Eps neighborhood $N_{\varepsilon}(p)$ of the inspected object p is examined
(7)$\rightarrow$If the number of objects contained in $N_{\varepsilon}(p)$ is less than MinPts, then
(8)$\rightarrow$Mark object p as a boundary point or a noise point
(9)$\rightarrow$Else
(10)$\rightarrow$Mark the object p as the core point and establish a new cluster C. Then, incorporate all the points within the neighborhood of p into cluster C
(11)$\rightarrow$For all the objects q in $N_{\varepsilon}(p)$ that have not been processed yet, do the following
(12)$\rightarrow$Check the Eps neighborhood $N_{\varepsilon}(p)$. If $N_{\varepsilon}(p)$ contains at least MinPts objects
(13)$\rightarrow$then incorporate all the objects in $N_{\varepsilon}(p)$ that have not been assigned to any cluster into cluster C
(14)$\rightarrow$Set cluster C as a new target object, noted T=(p,d,w)
(15)$\rightarrow$end for
(16)$\rightarrow$end if
(17)$\rightarrow$end if
(18)$\rightarrow$end for
(19)$\rightarrow$run step 1-16
(20)$\rightarrow$run algorithm 4 to find the same target
(21)$\rightarrow$run step 1-18
4.3 Experiment result
During the 2-hour experimental period, all 10 groups of test results successfully captured the numerical values corresponding to state changes. The number of recorded state changes varied from 3 to 9 instances, as detailed in Table 2.
Table 2. The overall status change times detected
|
Test Group |
1st |
2nd |
3rd |
4th |
5th |
6th |
7th |
8th |
9th |
10th |
|
Status Change |
5 |
6 |
3 |
4 |
4 |
7 |
9 |
6 |
5 |
5 |
Table 3. The detail status detected of the 1st group
|
1st Group |
init d |
1st Change |
2nd Change |
3rd Change |
4th Change |
5th Change |
|
Segment 1 |
2263mm |
2151mm |
2281mm |
2145mm |
2265mm |
2153mm |
|
Segment 2 |
1457mm |
1284mm |
1466mm |
1276mm |
1461mm |
1282mm |
|
Segment 3 |
1487mm |
989mm |
1496mm |
977mm |
1485mm |
986mm |
Table 4. The detail status changes of the 1st group
|
1st Group |
init d |
1st Change |
2nd Change |
3rd Change |
4th Change |
|
Segment 1 |
112mm |
130mm |
136mm |
120mm |
112mm |
|
Segment 2 |
173mm |
182mm |
190mm |
185mm |
179mm |
|
Segment 3 |
498mm |
507mm |
519mm |
508mm |
499mm |
Based on the data from the first group of experimental subjects, three groups of the same object were generated during the experiment. Upon state changes, the amplitude of change in the first segment was the smallest, with an average value of 122 mm. The amplitude of change in the second segment was intermediate, averaging 182 mm. The amplitude of change in the third segment was the largest, averaging 506 mm, as illustrated in Figures 11-13.
|
(a) Initial status |
(b) The status after change |
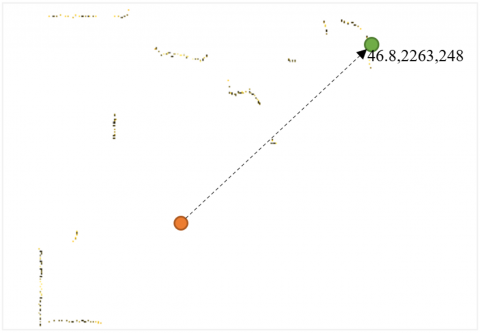
Figure 11. The status change of segment 1 by clustering
|
(a) Initial status |
(b) The status after change |
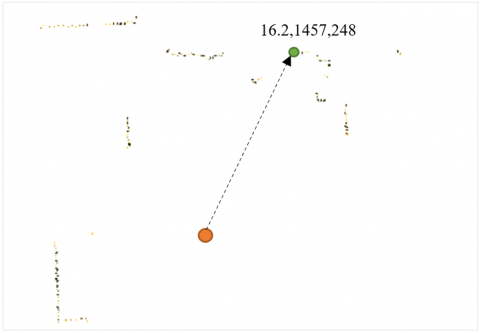
Figure 12. The status change of segment 2 by clustering
|
(a) Initial status |
(b) The status after change |
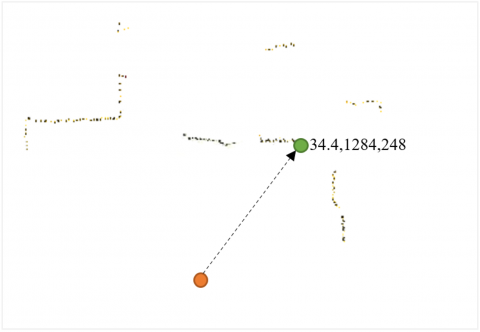
Figure 13. The status change of segment 3 by clustering
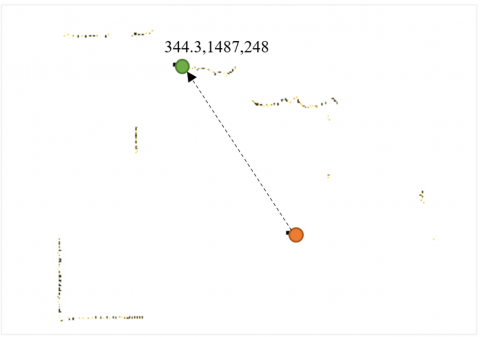
Figures 11-13 illustrate the state changes of three identical target objects in the recognition results. The changes of each target object at adjacent moments are quantitatively characterized by angle, distance, and intensity values. For instance, in Figure 11a, the values 46.8°, 2263 mm, and 248 correspond to the current target's angle, distance (d), and intensity value, respectively, suggesting a high level of data reliability. In the figure, the red origin denotes the coordinate origin of the 2D LiDAR system, while the green origin indicates the core point position of the target object.
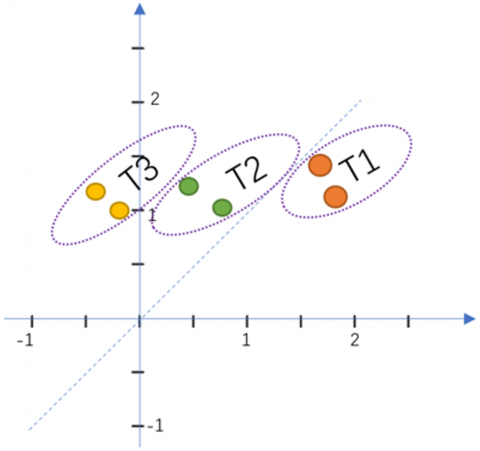
According to Definition 4, each cluster corresponds to a target object. Consequently, the clustering results presented above represent three identical segments, which align with the definition of three identical target objects as outlined in this paper. Following coordinate transformation and quantitative calculation of the objects (where p and d are derived from Definition 1, and w is calculated using algorithm 1), the detailed characteristics of the objects are summarized in Table 5. Based on the transformed planar coordinates, a more intuitive visualization of these results is provided in Figure 14.
Table 5. The detail status change of the 1st group
|
The Same Target |
Before Status Change |
After Status Change |
||||||
|
p |
d |
w |
p |
d |
w |
|||
|
x |
y |
x |
y |
|||||
|
T1 |
1650 |
1550 |
2263 |
550 |
1764 |
1232 |
2151 |
480 |
|
T2 |
406 |
1399 |
1457 |
630 |
725 |
1060 |
1284 |
640 |
|
T3 |
404 |
1431 |
1487 |
610 |
280 |
948 |
989 |
620 |
Figure 14. Representation of the detected object in plane coordinates
During the experimental process of this study, the radar was configured such that its 0-degree orientation aligned with the center of the human body. Consequently, as illustrated in Figure 14, the objects T1, T2, and T3 can be respectively associated with the head, waist, and legs of an individual based on their spatial positions. Consequently, the data presented in Tables 2-5 can be interpreted as reflecting the state changes of the individual's head, waist, and legs during the sleep process.
4.4 Experiment analysis
4.4.1 Validity analysis
Based on the experimental data, the method proposed in this paper has shown a certain level of effectiveness in monitoring changes in sleep states. The minimum detectable state change is 11.2 centimeters, which exceeds the predefined clustering radius of 10 centimeters. Over the approximately two-hour experimental period, a total of 3 to 9 behavioral state transitions were identified. According to the data from the "Sleep Formula," humans exhibit an average of 40 to 50 body movements per night (approximately 5 movements per hour). Consequently, the method employed in this study demonstrates high accuracy and rationality.
4.4.2 Change analysis
Through graphical analysis, it can be inferred that the three distinct clusters identified in the results correspond to the head, waist, and legs of the human body. Consequently, the variations presented in Tables 2-3 can also be interpreted as positional changes of the head, waist, and legs during sleep. Among these changes:
(1) The minimum average displacement of the human head is 122 mm, the maximum displacement of the human foot is 506 mm, and the intermediate displacement of the waist is 182 mm.
(2) The range of displacement for the legs is 506 mm, which is 2.8 times that of the waist and 4.1 times that of the head, indicating frequent leg movements that align with general cognitive understanding.
(3) Further analysis reveals that based on the change distances, these values represent the average displacement of the human body. Therefore, it is recommended that subsequent scanning focus primarily on the lumbar region.
4.4.3 Pattern analysis
According to the data analysis in Table 2, significant variations exist in the frequency of sleep state changes among different experimental subjects. Overall, no clear pattern is evident in these changes. However, by further examining the state change magnitudes for individual subjects using the data in Table 3, certain regularities can be identified. As illustrated in Figure 15, the change distance for T1 primarily fluctuates around 2200mm as the central axis, T2 exhibits fluctuations centered around 1400mm, and T3 demonstrates a concentration near 1200mm.
Figure 15. Sequence diagram depicting the status transition of detected objects
Figure 16. Sequence diagram for quantifying the state changes of the detection object
From Figure 15, it can be further observed that the variation in amplitude across different time points for each detection object results in an irregular sinusoidal-like change pattern. This suggests that human movement during sleep is characterized by restlessness and frequent tossing and turning. Moreover, a deeper understanding of this feature can be achieved through the analysis of the magnitude of these changes, as illustrated in Figure 16.
This paper investigates the general methodologies for human behavior recognition based on 2D LiDAR technology, as well as the processing workflows and critical technologies associated with point cloud data. Building upon this foundation, a sleep behavior recognition method leveraging 2D LiDAR technology is proposed. This method encompasses core technologies such as target object expression modeling, determination of matching for identical target objects, and computation of dynamic changes in target objects. Experimental validation and result analysis have been carried out.
The experimental results demonstrate that the proposed method exhibits high effectiveness and perception accuracy. In a 2-hour experiment involving 10 test subjects, the number of detected behavioral state changes ranged from 3 to 9 instances, aligning with publicly recognized sleep quality assessment standards.
Quantitative analysis of the experimental data reveals that the perceived data changes are reasonable. During the state change process, the amplitude of head movement was the smallest (average 12 cm), the amplitude of leg movement was the largest (average 50 cm), and the amplitude of waist movement fell in between (average 18 cm).
Comprehensive analysis indicates that the data obtained through this study effectively reflects the restless characteristics of behavioral changes during sleep, which is consistent with general understanding.
Consequently, this paper proposes a sleep state monitoring method based on a single radar system. This approach not only offers the advantage of low cost but also demonstrates high precision, rationality, and effectiveness. Thus, it provides a novel technical solution for monitoring the sleep quality of elderly individuals, showcasing significant application value. Future research will concentrate on enhancing the real-time performance and accuracy of the model, as well as and exploring its applicability in more complex and diverse environments such as throughout the night and over longer continuous periods.
Yong Shi conceived the main concept of the algorithm, designed the system and the experiments and wrote the paper. Jian Du and Miaomiao Wang contributed analysis tools, offered professional instructions and supervised the whole experimental process. Xu Qiao and Weihua Wang conducted the experiments, analyzed the experimental data and wrote part of the paper. All authors have read and agreed to the published version of the manuscript.
This paper was supported by the National Key Research and Development Program of China (Grant No.: 2024YFA1611501) and the National Natural Science Foundation of China (Grant No.: 42304010).
The authors would like to thank the editor and the anonymous reviewers who provided insightful comments on improving this article, and thank student Caixin Fang, Zijun Zou, Dingyi Zong for data collection and auxiliary experiment.
|
DBSCAN |
Density-Based Spatial Clustering of Applications with Noise |
|
2D |
Two Dimensional |
|
LiDAR |
Light Laser Detection and Ranging |
|
3D |
Three Dimensional |
|
MinPts |
Minimum point cloud set |
|
DTOF |
Direct Time-of-Flight |
[1] Iguernaissi, R., Merad, D., Aziz, K., Drap, P. (2019). People tracking in multi-camera systems: A review. Multimedia Tools and Applications, 78: 10773-10793. https://doi.org/10.1007/s11042-018-6638-5
[2] Kong, Y., Fu, Y. (2022). Human action recognition and prediction: A survey. International Journal of Computer Vision, 130(5): 1366-1401. https://doi.org/10.1007/s11263-022- 01594-9
[3] Sun, Z., Ke, Q., Rahmani, H., Bennamoun, M., Wang, G., Liu, J. (2022). Human action recognition from various data modalities: A review. IEEE Transactions on Pattern Analysis and Machine Intelligence, 45(3): 3200-3225. https://doi.org/ 10.1109/TPAMI.2022.3183112
[4] Koley, B., Dey, D. (2012). An ensemble system for automatic sleep stage classification using single channel EEG signal. Computers in Biology and Medicine, 42(12): 1186-1195. https://doi.org/10.1016/j.compbiomed.2012.09.012
[5] Perez-Pozuelo, I., Zhai, B., Palotti, J., Mall, R., Aupetit, M., Garcia-Gomez, J.M., Fernandez-Luque, L. (2020). The future of sleep health: A data-driven revolution in sleep science and medicine. NPJ Digital Medicine, 3(1): 42. https://doi.org/10.1038/s41746-020-0244-4
[6] Hsu, C.Y., Ahuja, A., Yue, S., Hristov, R., Kabelac, Z., Katabi, D. (2017). Zero-effort in-home sleep and insomnia monitoring using radio signals. Proceedings of the ACM on Interactive, Mobile, Wearable and Ubiquitous Technologies, 1(3): 1-18. https://doi.org/10.1145/3130924
[7] Liu, J.J., Xu, W., Huang, M.C., Alshurafa, N., Sarrafzadeh, M., Raut, N., Yadegar, B. (2014). Sleep posture analysis using a dense pressure sensitive bedsheet. Pervasive and Mobile Computing, 10: 34-50. https://doi.org/10.1016/j.pmcj.2013.10.008
[8] Babenko, B., Yang, M.H., Belongie, S. (2010). Robust object tracking with online multiple instance learning. IEEE Transactions on Pattern Analysis and Machine Intelligence, 33(8): 1619-1632. https://doi.org/10.1109/TPAMI.2010.226
[9] Li, M., Chen, S., Chen, X., Zhang, Y., Wang, Y., Tian, Q. (2019). Actional-structural graph convolutional networks for skeleton-based action recognition. In Proceedings of the IEEE/CVF Conference on Computer Vision and Pattern Recognition, Long Beach, CA, USA, pp. 3595-3603. https://doi.org/10.1109/CVPR.2019.00371
[10] Duan, H., Zhao, Y., Chen, K., Lin, D., Dai, B. (2022). Revisiting skeleton-based action recognition. In Proceedings of the IEEE/CVF Conference on Computer Vision and Pattern Recognition, New Orleans, LA, USA, pp. 2969-2978. https://doi.org/10.1109/CVPR52688.2022.00298
[11] Jaramillo, I.E., Jeong, J.G., Lopez, P.R., Lee, C.H., Kang, D.Y., Ha, T.J., Kim, T.S. (2022). Real-time human activity recognition with IMU and encoder sensors in wearable exoskeleton robot via deep learning networks. Sensors, 22(24): 9690. https://doi.org/10.3390/s22249690
[12] Dendorfer, P., Osep, A., Milan, A., Schindler, K., Cremers, D., Reid, I., Leal-Taixé, L. (2021). Motchallenge: A benchmark for single-camera multiple target tracking. International Journal of Computer Vision, 129: 845-881. https://doi.org/10.1007/s11263-020-01393-0
[13] Moeslund, T.B., Hilton, A., Krüger, V. (2006). A survey of advances in vision-based human motion capture and analysis. Computer Vision and Image Understanding, 104(2-3): 90-126. https://doi.org/10.1016/j.cviu.2006.08.002
[14] Pareek, P., Thakkar, A. (2021). A survey on video-based human action recognition: Recent updates, datasets, challenges, and applications. Artificial Intelligence Review, 54(3): 2259-2322. https://doi.org/10.1007/s10462-020- 09904-8
[15] Hasan, M., Hanawa, J., Goto, R., Suzuki, R., Fukuda, H., Kuno, Y., Kobayashi, Y. (2022). LiDAR-based detection, tracking, and property estimation: A contemporary review. Neurocomputing, 506: 393-405. https://doi.org/10.1016/j.neucom.2022.07.087
[16] Collins, R.T., Liu, Y., Leordeanu, M. (2005). Online selection of discriminative tracking features. IEEE Transactions on Pattern Analysis and Machine Intelligence, 27(10): 1631-1643. https://doi.org/10.1109/TPAMI.2005.205
[17] Rani, S., Chowdhury, A., Chakravarty, T., Pal, A. (2021). Exploiting unique state transitions to capture micro-Doppler signatures of human actions using CW radar. IEEE Sensors Journal, 21(24): 27878-27886. https://doi.org/10.1109/JSEN.2021.3126436
[18] Hare, S., Golodetz, S., Saffari, A., Vineet, V., Cheng, M. M., Hicks, S.L., Torr, P.H. (2015). Struck: Structured output tracking with kernels. IEEE Transactions on Pattern Analysis and Machine Intelligence, 38(10): 2096-2109. https://doi.org/10.1109/TPAMI.2015.2509974
[19] Niu, K., Wang, X., Zhang, F., Zheng, R., Yao, Z., Zhang, D. (2022). Rethinking Doppler effect for accurate velocity estimation with commodity WIFI devices. IEEE Journal on Selected Areas in Communications, 40(7): 2164-2178. https://doi.org/10.1109/JSAC.2022.3155523
[20] Cavallaro, A., Steiger, O., Ebrahimi, T. (2005). Tracking video objects in cluttered background. IEEE Transactions on Circuits and Systems for Video Technology, 15(4): 575-584. https://doi.org/10.1109/TCSVT.2005.844447
[21] Alahi, A., Goel, K., Ramanathan, V., Robicquet, A., Fei-Fei, L., Savarese, S. (2016). Social LSTM: Human trajectory prediction in crowded spaces. In Proceedings of the IEEE Conference on Computer Vision and Pattern Recognition, Las Vegas, NV, USA, pp. 961-971. https://doi.org/10.1109/CVPR.2016.110
[22] Dwork, C., Roth, A. (2014). The algorithmic foundations of differential privacy. Foundations and Trends® in Theoretical Computer Science, 9(3-4): 211-407. https://doi.org/10.1561/0400000042
[23] Acquisti, A., Taylor, C., Wagman, L. (2016). The economics of privacy. Journal of economic Literature, 54(2): 442-492. https://doi.org/10.1257/jel.54.2.442
[24] Yeong, D.J., Velasco-Hernandez, G., Barry, J., Walsh, J. (2021). Sensor and sensor fusion technology in autonomous vehicles: A review. Sensors, 21(6): 2140. https://doi.org/10.3390/s21062140
[25] Hwang, S., Kim, N., Choi, Y., Lee, S., Kweon, I.S. (2016). Fast multiple objects detection and tracking fusing color camera and 3D LIDAR for intelligent vehicles. In 2016 13th International Conference on Ubiquitous Robots and Ambient Intelligence (URAI), Xi'an, China, pp. 234-239. https://doi.org/10.1109/URAI.2016.7625744
[26] Koide, K., Miura, J., Menegatti, E. (2019). A portable three-dimensional LIDAR-based system for long-term and wide-area people behavior measurement. International Journal of Advanced Robotic Systems, 16(2): 1729881419841532. https://doi.org/10.1177/1729881419841532
[27] Tu, J., Ren, M., Manivasagam, S., Liang, M., Yang, B., Du, R., Urtasun, R. (2020). Physically realizable adversarial examples for lidar object detection. In Proceedings of the IEEE/CVF Conference on Computer Vision and Pattern Recognition, Seattle, WA, USA, pp. 13716-13725. https://doi.org/10.1109/CVPR42600.2020.01373
[28] Li, Z. (2022). LiDAR-based 3D object detection for autonomous driving. In 2022 International Conference on Image Processing, Computer Vision and Machine Learning (ICICML), Xi’an, China, pp. 507-512. https://doi.org/10.1109/ICICML57342.2022.10009752
[29] Röwekämper, J., Sprunk, C., Tipaldi, G.D., Stachniss, C., Pfaff, P., Burgard, W. (2012). On the position accuracy of mobile robot localization based on particle filters combined with scan matching. In 2012 IEEE/RSJ International Conference on Intelligent Robots and Systems, Vilamoura-Algarve, Portugal, pp. 3158-3164. https://doi.org/10.1109/IROS.2012.6385988
[30] Zamanakos, G., Tsochatzidis, L., Amanatiadis, A., Pratikakis, I. (2021). A comprehensive survey of LIDAR-based 3D object detection methods with deep learning for autonomous driving. Computers & Graphics, 99: 153-181.
[31] Wang, P., Luo, Y., Shi, G., Huang, S., Miao, M., Qi, Y., Ma, J. (2021). Research progress in millimeter wave radar-based non-contact sleep monitoring-a review. In 2021 13th International Symposium on Antennas, Propagation and EM Theory (ISAPE), Zhuhai, China, pp. 1-3. https://doi.org/10.1109/ISAPE54070.2021.9753424
[32] Kebe, M., Gadhafi, R., Mohammad, B., Sanduleanu, M., Saleh, H., Al-Qutayri, M. (2020). Human vital signs detection methods and potential using radars: A review. Sensors, 20(5): 1454. https://doi.org/10.3390/s20051454
[33] Islam, S.M.M. (2021). Radar-based non-contact physiological sensing. In Vision, Sensing and Analytics: Integrative Approaches, Springer International Publishing, pp. 177-212. https://doi.org/10.1007/978-3-030-75490-7_7
[34] Oishi, S., Kohari, Y., Miura, J. (2016). Toward a robotic attendant adaptively behaving according to human state. In 2016 25th IEEE International Symposium on Robot and Human Interactive Communication (RO-MAN), New York, NY, USA, pp. 1038-1043. https://doi.org/10.1109/roman.2016.7745236
[35] Guerrero-Higueras, Á.M., Álvarez-Aparicio, C., Calvo Olivera, M.C., Rodríguez-Lera, F.J., Fernández-Llamas, C., Rico, F.M., Matellán, V. (2019). Tracking people in a mobile robot from 2D LiDAR scans using full convolutional neural networks for security in cluttered environments. Frontiers in Neurorobotics, 12: 85. https://doi.org/10.3389/fnbot.2018.00085
[36] Hasan, M., Hanawa, J., Goto, R., Fukuda, H., Kuno, Y., Kobayashi, Y. (2021). Tracking people using ankle-level 2D LiDAR for gait analysis. In Advances in Artificial Intelligence, Software and Systems Engineering: Proceedings of the AHFE 2020 Virtual Conferences on Software and Systems Engineering, and Artificial Intelligence and Social Computing, USA, pp. 40-46. https://doi.org/10.1007/978-3-030-51328-3_7
[37] Bretar, F., Wagner, W., Paparoditis, N. (2011). Advances in LiDAR data processing and applications. ISPRS Journal of Photogrammetry and Remote Sensing, 66(6): S1. https://doi.org/10.1016/j.isprsjprs.2011.12.002
[38] Van Oosterom, P., Martinez-Rubi, O., Ivanova, M., Horhammer, M., Geringer, D., Ravada, S., Gonçalves, R. (2015). Massive point cloud data management: Design, implementation and execution of a point cloud benchmark. Computers & Graphics, 49: 92-125. https://doi.org/10.1016/j.cag.2015.01.007
[39] Rusu, R.B., Marton, Z.C., Blodow, N., Dolha, M., Beetz, M. (2008). Towards 3D point cloud based object maps for household environments. Robotics and Autonomous Systems, 56(11): 927-941. https://doi.org/10.1016/j.robot.2008.08.005
[40] Zhou, Y., Tuzel, O. (2018). Voxelnet: End-to-end learning for point cloud based 3D object detection. In Proceedings of the IEEE Conference on Computer Vision and Pattern Recognition, Salt Lake City, UT, USA, pp. 4490-4499. https://doi.org/10.1109/CVPR.2018.00472
[41] Qi, C.R., Yi, L., Su, H., Guibas, L.J. (2017). Pointnet++: Deep hierarchical feature learning on point sets in a metric space. In Proceedings of the 31st International Conference on Neural Information Processing Systems, Long Beach, California, USA, 5105-5114.
[42] Yan, Y., Mao, Y., Li, B. (2018). Second: Sparsely embedded convolutional detection. Sensors, 18(10): 3337. https://doi.org/10.3390/s18103337
[43] Su, Z., Liang, X., Tong, J., Yang, S., Du, S. (2024). PFSC: Pyramid R-CNN for point-voxels with focal sparse convolutional networks for 3D object detection. In 2024 IEEE International Conference on Mechatronics and Automation (ICMA), Tianjin, China, pp. 1843-1848. https://doi.org/10.1109/ICMA61710.2024.10633123
[44] Mertz, C., Navarro-Serment, L.E., MacLachlan, R., Rybski, P., Steinfeld, A., Suppe, A., Gowdy, J. (2013). Moving object detection with laser scanners. Journal of Field Robotics, 30(1): 17-43. https://doi.org/10.1002/rob.21430
[45] Lin, T.Y., Goyal, P., Girshick, R., He, K., Dollár, P. (2017). Focal loss for dense object detection. IEEE Transactions on Pattern Analysis and Machine Intelligence, 42(2): 318-327. https://doi.org/10.1109/TPAMI.2018.2858826
[46] Ester, M., Kriegel, H.P., Sander, J., Xu, X. (1996). A density-based algorithm for discovering clusters in large spatial databases with noise. In KDD'96: Proceedings of the Second International Conference on Knowledge Discovery and Data Mining, AAAI Press, pp. 226-231. https://doi.org/10.5555/3001460.3001507
[47] Zhang, J., Singh, S. (2014). LOAM: LiDAR odometry and mapping in real-time. Robotics: Science and Systems, 2(9): 1-9. https://doi.org/10.15607/RSS.2014.X.007