Fuat Yalçınlı*![]() | Bayram Akdemir
| Bayram Akdemir![]() | Akif Durdu
| Akif Durdu![]() | Ali Evren
| Ali Evren![]() | Kübra Özcan Akkaş
| Kübra Özcan Akkaş![]()
© 2025 The authors. This article is published by IIETA and is licensed under the CC BY 4.0 license (http://creativecommons.org/licenses/by/4.0/).
OPEN ACCESS
Recent increases in traffic density have introduced a range of challenges, prompting the development of intelligent transportation technologies as potential solutions. One such solution involves the efficient determination and management of signaling times. This study presents a structure for generating adaptive signal timings through the creation of a signaling improvement model. The proposed model is implemented at the Polatlı Sanayi Intersection, which was previously managed using a fixed-time signaling system. Subsequently, the delay times per vehicle are calculated and compared between the fixed-time signaling system and the newly developed signaling improvement model. The delay times for both the fixed-time signaling system and the signaling improvement model are evaluated through the use of visual detection methods, with observations conducted via camera during peak hours. The observed delay times are further validated through the Webster model and the SUMO simulation program. The Webster model and SUMO simulations employ real signalized intersection data. The study revealed a 20.24% reduction in delay times when switching from a fixed-time signaling system to an adaptive signaling improvement model. Moreover, the level of service at the intersection, as defined by the level of service criteria outlined in the Highway Capacity Manual, has been enhanced from E (indicating suboptimal performance) in the fixed-time system to D (indicating moderate performance) in the adaptive signalization model.
adaptive signaling, control, delay parameter, level of service, signaling control, smart traffic control
In recent times, the prevalence of automobiles in metropolitan regions has increased markedly. This considerable increase in vehicular traffic has resulted in a notable expansion of traffic density on existing roadways, thereby rendering the current infrastructure increasingly inadequate. Consequently, there is an ongoing need to develop and implement innovative intelligent transportation systems and advanced control algorithms. These endeavors are designed to mitigate the challenges posed by urban traffic networks, thereby enhancing both the safety and comfort of those who utilize these networks [1-3].
Signalized intersections are a primary source of traffic congestion. The implementation of effective management strategies at these intersections has the potential to markedly reduce overall delay times. It is therefore imperative that innovative techniques for the management of traffic signals are developed and evaluated. The present study proposes a novel signaling optimization control model. The efficacy of the model is evaluated through an analysis of delay parameters and level of service (LOS) metrics. The measurement of delay is a common method of evaluating the efficiency of a signaling system [4-9]. The term denotes the aggregate time spent by a vehicle at an intersection prior to its departure. During this interval, vehicles are compelled to wait due to the signaling system, which disrupts the flow of traffic and results in delays. The term “delay” is typically understood to consist of three components. Initially, as an approaching vehicle responds to changes in the traffic signal, it decelerates, resulting in deceleration delay. Secondly, when the traffic signal switches to red, the vehicle must halt entirely, known as stopping delay. Subsequently, upon the signal’s indication green, the vehicle resumes acceleration and departs the intersection, thereby experiencing acceleration delay. The minimization of delays can be achieved through the optimization of traffic signaling and the improvement of traffic flow. It is postulated that the implementation of adaptive traffic signaling systems and efficient control algorithms has the potential to significantly reduce these delays, thereby enhancing overall traffic circulation efficiency [10]. The accurate and reliable calculation of average delay is of critical importance for the effective traffic planning and regulation of traffic, including the management of traffic flow, the optimization of signalization, and the reduction of congestion. Consequently, researchers and traffic engineers are engaged in ongoing efforts to enhance their comprehension of traffic dynamics and to implement efficacious strategies through the utilization of advanced technologies and data analysis [11]. A variety of analytical techniques, models, and technologies are utilized in the assessment of traffic flow patterns and the estimation of average delay times. Such methods include the utilization of traffic cameras, sensors, and data analytics tools. The data necessary for calculating delays is collected through these technologies, thereby enabling precise assessments of traffic conditions. Moreover, mathematical models such as those put forth by Webster and Akçelik are frequently utilized for optimization of traffic flow and calculations of delays [12, 13].
The Webster delay model is a widely utilized mathematical framework for evaluating the performance of traffic signalization systems, and it has been employed in a multitude of studies. The model is instrumental in calculating delay times and average waiting periods at traffic signals, thereby facilitating the optimization of signal timings at complex intersections and under heavy traffic conditions. The Webster model incorporates factors that account for the time required for the vehicles take to traverse an intersection and the volume of traffic present at that location. The model considers traffic density and demand across a series of intersections when determining optimal signal scheduling. By accounting for the intensity of traffic flow and the impact of signal changes, the model facilitates the optimization of signal timings. The average delay per vehicle is determined by a number of factors, including signal duration, capacity, cycle time, saturation flow, and the number of lanes available for traffic [14-17].
The calculation of delay can be achieved through the utilization of field observations. In this method, researchers or traffic engineers quantify delay by conducting physical monitoring of traffic flow at intersections or specific points within an intersection. The time spent by vehicles passing through and waiting at these locations is manually recorded by observers. The reliability of data obtained from field studies of this nature enables a direct analysis of traffic flow and a more accurate determination of delay [18]. An additional pivotal criterion for assessing the efficacy of signalized intersections is the level of service (LOS). The Highway Capacity Manual (HCM) serves as the standard reference for transportation engineering in the United States, encompassing crucial topics such as roadway and intersection capacity. As part of this guide, the LOS for signalized intersections provides a rating system for the assessment of intersection performance [19, 20]. The LOS is employed to ascertain the efficiency with which an intersection processes traffic. The ratings range from A to F, with A indicating optimal performance and F representing the lowest level of service. Each service level is associated with specific metrics, including vehicle wait times, delay durations, and travel times [21, 22].
Furthermore, simulation programs are also employed to evaluate intersection efficiency and conduct optimization studies. SUMO (Simulation of Urban Mobility) is a widely used open-source software for modeling and analyzing urban transportation systems and traffic flows. It is particularly valuable in research and development activities related to intelligent transportation systems, traffic engineering, and transportation planning [23-25]. Given its open-source nature, SUMO is one of the most extensively utilized simulation programs on a global scale. The SUMO program enables the accurate modeling of real-world intersections, facilitating the operation of these intersections using actual traffic data. The simulation environment allows for the determination of parameters such as delay and wait times, thereby providing valuable insights into the performance of intersections. Signaling systems operate using a variety of methodologies. Fixed-time signaling systems are the most widely used worldwide due to their simplicity and cost-effectiveness. However, these systems frequently demonstrate inefficiencies in terms of performance. In a fixed-time signaling system, the phase durations and number of phases are predetermined, thereby enabling the system to allocate the right of way to traffic from different directions in accordance with set intervals. These fixed intervals are repeated in a cyclical manner. As a result of technological advances, adaptive signaling systems have become increasingly common in the field of intersection management. In contrast to fixed-time systems, adaptive signaling systems are capable of dynamically adjusting phase durations and phase numbers based on real-time data. This data may include, but is not limited to, information regarding intersection traffic density, inter-vehicle spacing, average speeds within the intersection, queuing patterns, data from neighboring intersections, and vehicle presence/absence information [26-29]. The capacity to precisely quantify traffic data and the efficacy of control algorithms contingent upon these measurements are pivotal elements in the functionality of adaptive signaling systems. In this study, an adaptive control system is developed through the creation of a signaling improvement model. The adaptive signaling control model is implemented at a real-world intersection, and its performance is subsequently analyzed. The model employs a fusion of loop sensors and Bluetooth sensors, representing a significant innovation in this research field: the inaugural application of Bluetooth and loop sensor integration in adaptive traffic management. The sensors have been installed at the Polatlı Sanayi Intersection with the objective of facilitating the implementation of an improved signaling model, which will subsequently be operated as the intersection's signaling control system. This study makes a notable contribution to the field by developing an adaptive signal control model that incorporates real-time feedback. The system is designed to continuously evaluate the conditions at the intersection based on data obtained from sensors. This data is subsequently utilized to modify signal timings, and the results of these adjustments are incorporated into an iterative process to enhance the timing algorithm continuously. The performance of the developed signaling improvement model is evaluated based on two key performance indicators: delay and level of service (LOS). The delay is calculated using visual detection from a camera installed at the intersection, and LOS values are derived from these delay measurements. Verification studies are conducted to validate the delay values obtained through visual detection by comparing them with results generated using the SUMO simulation program and Webster's theorem.
The development of adaptive traffic signal control has constituted a central area of investigation within the field of intelligent transportation systems for several decades. A plethora of methodologies and technologies have been developed with the objective of optimizing traffic flow at signalized intersections. The primary goal of these systems is to reduce delays and enhance overall traffic efficiency by dynamically modifying signal timings in response to real-time traffic data. A number of notable approaches to adaptive traffic control have been put forth in the literature. For example, optimization-based methodologies, such as Webster's delay model and its derivatives, seek to calculate optimal cycle lengths and green time allocations with the aim of minimizing delays [30]. These models, however, are based on predefined traffic flow patterns and lack the capacity to adapt to rapidly changing conditions. Rule-based systems such as SCOOT (Split Cycle Offset Optimization Technique) and SCATS (Sydney Coordinated Adaptive Traffic System) are frequently employed as adaptive control methodologies for traffic signal management [31]. These systems dynamically adjust signal timings by utilizing real-time traffic flow data collected from sensors and detectors. While these systems are effective in many scenarios, they often require extensive calibration and infrastructure investment, which makes them less suitable for smaller networks or budget-constrained municipalities. The application of artificial intelligence, including techniques such as reinforcement learning and fuzzy logic controllers, offers a novel approach to adaptive traffic control [32, 33]. These approaches are capable of learning and adapting to traffic patterns over time, however, their deployment is often constrained by computational complexity and the necessity for extensive training data.
A common limitation across these systems is the absence of real-time feedback integration. The majority of adaptive traffic control systems determine signal timings based on sensor data and implement them without assessing their immediate impact on traffic conditions. This unidirectional decision-making process frequently results in suboptimal performance in dynamic and unpredictable traffic environments.
Furthermore, a considerable number of adaptive systems rely on single-sensor configurations, such as loop detectors or radar, which may not provide comprehensive traffic data. Factors such as sensor occlusion, adverse weather conditions, or technical malfunctions can impair their performance.
The integration of Bluetooth and loop sensors in traffic management is a relatively recent development. Bluetooth sensors have been employed to estimate travel times by detecting the Media Access Control (MAC) addresses of Bluetooth-enabled devices [34-36]. This approach offers high accuracy in capturing real-time travel time capture, particularly effective in urban environments with high Bluetooth device penetration among pedestrians and vehicles. However, Bluetooth sensors are not sufficient for capturing vehicle counts or other critical traffic parameters. Loop sensors, on the other hand have been a mainstay in traffic management for decades due to their reliability in detecting vehicle presence and counting traffic volumes [37]. Despite their effectiveness, loop sensors lack the capacity to provide information about travel times or delays, which limits their utility in dynamic traffic scenarios.
The proposed signaling improvement model addresses the limitations of prior systems by combining Bluetooth and loop sensors in a unified framework. The dual-sensor fusion enables the model to capture both travel time data (via Bluetooth sensors) and vehicle count data (via loop sensors), thereby providing a comprehensive dataset for real-time traffic analysis. Furthermore, the model incorporates a feedback mechanism that assesses the efficacy of the implemented signal timings and makes adjustments in a dynamic manner. This iterative process ensures continuous optimization and responsiveness to changing traffic conditions, thereby distinguishing setting it apart from existing adaptive traffic control systems.
The model proposed in this study is implemented at the Sanayi Intersection. In the initial phase, the intersection is managed using a fixed-time signaling system, and the delay parameters are recorded. Subsequently, the signaling improvement model was implemented during the same time interval on the following day, and the delay parameters were again measured. Subsequently, a comparative efficiency analysis of operational efficiency is conducted between the two signaling operation types.
2.1 Polatlı Sanayi Intersection structure
Polatlı is the most proximate district to the city along the State Highway that connects Eskişehir and Ankara. This renders Polatlı a strategically advantageous location with regard to transportation and accessibility, given its proximity to both major urban centers.
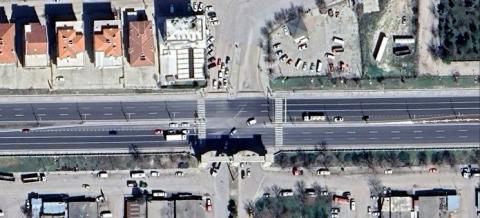
Figure 1 illustrates the layout of the Sanayi Intersection in Polatlı.
Figure 1. Polatlı Sanayi Intersection structure
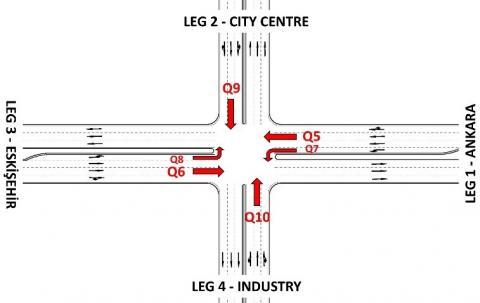
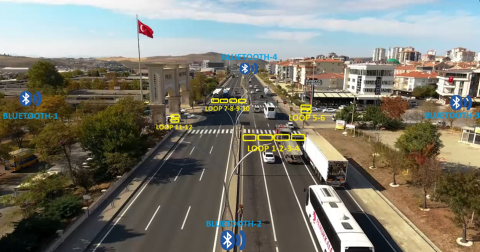
The Sanayi Intersection is a signalized junction with an average daily traffic volume of 42,900 vehicles. The intersection experiences high traffic density, particularly during the morning and evening commuting periods. All methodologies and models utilized in this study were employed during peak hour. Figure 2 illustrates the configuration of the Sanayi Intersection, including the various legs and the associated traffic flows.
Figure 2. Sanayi Intersection traffic flows and legs
As illustrated in Figure 2, the Sanayi Intersection is composed of four legs and six traffic flows. In the aforementioned figure, the legs are indicated as follows:
Leg-1: Ankara (Q5 and Q7 traffic flows)
Leg-2: City Centre (Q9 traffic flow)
Leg-3: Eskişehir (Q6 and Q8 traffic flows)
Leg-4: Industry (Q10 traffic flow)
2.2 The method for detecting delay parameters in a fixed-time signaling system
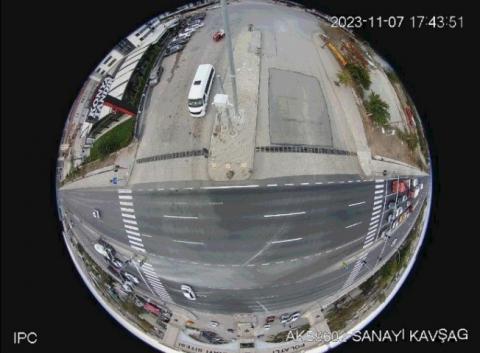
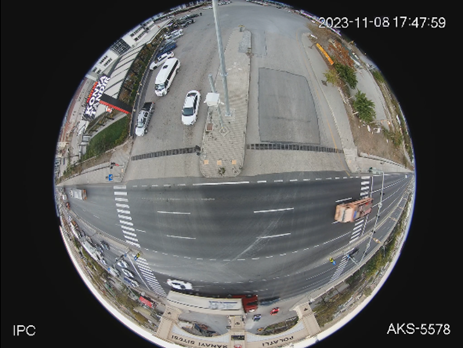
In order to ascertain the delay values at the intersection, a visual detection method was employed utilizing a camera. Images captured by a fisheye camera between 17:30 and 18:30 on November 7, 2023, document the operation of the Sanayi Intersection under a fixed-time signaling system. Over the course of this observation period, the movement of 40 vehicles entering each traffic flow at the intersection was monitored. The timing process was initiated when a vehicle was first observed inside the camera's coverage area. Upon observation of the vehicle, the stopwatch was initiated, and the time was recorded as Tin when the vehicle began to decelerate. Subsequently, the vehicle was monitored as it traversed the intersection until it was no longer inside the camera's coverage area. The elapsed time was recorded as Tout when the vehicle exited the reference point within the camera's field of view. The difference between Tin and Tout yielded the delay experienced by each vehicle. The data set comprised observations of 40 vehicles across all traffic flows. The mean delay per vehicle was calculated based on the aforementioned 40 vehicle observations. Figure 3 illustrates the fisheye camera image utilized for visual detection.
Table 1. Delay time counts for Q5 in fixed-time signaling system
|
Vehicle Sample Number |
Tin(s) |
Tout (s) |
Tout-Tin (s) |
Average Delay (s/veh) |
|
Vehicle 1 |
8 |
59 |
51 |
51.2 |
|
Vehicle 2 |
14 |
116 |
102 |
|
|
Vehicle 3 |
9 |
69 |
60 |
|
|
Vehicle 4 |
8 |
74 |
66 |
|
|
Vehicle 5 |
5 |
45 |
40 |
|
|
Vehicle 6 |
12 |
112 |
100 |
|
|
Vehicle 7 |
10 |
66 |
56 |
|
|
Vehicle 8 |
9 |
20 |
11 |
|
|
Vehicle 9 |
12 |
73 |
61 |
|
|
Vehicle 10 |
8 |
62 |
54 |
|
|
Vehicle 11 |
9 |
69 |
60 |
|
|
Vehicle 12 |
10 |
15 |
5 |
|
|
Vehicle 13 |
12 |
110 |
98 |
|
|
Vehicle 14 |
7 |
62 |
55 |
|
|
Vehicle 15 |
7 |
21 |
14 |
|
|
Vehicle 16 |
9 |
45 |
36 |
|
|
Vehicle 17 |
6 |
65 |
59 |
|
|
Vehicle 18 |
12 |
81 |
69 |
|
|
Vehicle 19 |
5 |
24 |
19 |
|
|
Vehicle 20 |
11 |
19 |
8 |
|
|
Vehicle 21 |
8 |
65 |
57 |
|
|
Vehicle 22 |
8 |
67 |
59 |
|
|
Vehicle 23 |
13 |
99 |
86 |
|
|
Vehicle 24 |
6 |
76 |
70 |
|
|
Vehicle 25 |
14 |
42 |
28 |
|
|
Vehicle 26 |
6 |
69 |
63 |
|
|
Vehicle 27 |
9 |
25 |
16 |
|
|
Vehicle 28 |
8 |
65 |
57 |
|
|
Vehicle 29 |
11 |
113 |
102 |
|
|
Vehicle 30 |
6 |
56 |
50 |
|
|
Vehicle 31 |
9 |
27 |
18 |
|
|
Vehicle 32 |
11 |
72 |
61 |
|
|
Vehicle 33 |
9 |
62 |
53 |
|
|
Vehicle 34 |
7 |
58 |
51 |
|
|
Vehicle 35 |
8 |
57 |
49 |
|
|
Vehicle 36 |
5 |
45 |
40 |
|
|
Vehicle 37 |
8 |
58 |
50 |
|
|
Vehicle 38 |
9 |
35 |
26 |
|
|
Vehicle 39 |
12 |
76 |
64 |
|
|
Vehicle 40 |
11 |
35 |
24 |
The outcomes derived from the observation of the intersection through camera images in the fixed-time signaling system were subjected to a separate analysis for each traffic leg. A total of 40 vehicles were sampled from each traffic flow, with entry and exit times recorded for the purpose of identifying delays. The data for the Q5 traffic flow are presented in Table 1 as an illustrative example.
Figure 3. Fisheye camera image used in fixed-time signaling system
The visual detection method utilized to ascertain the delay value of the Q5 traffic flow was subsequently applied to all traffic flows. Table 2 presents the delay values of all traffic flows detected by the visual detection method for the fixed-time signaling system.
Table 2. Delay times in fixed-time signaling system by legs and traffic flows
|
Leg of Intersection |
Traffic Flow |
Delay Time (s/veh) |
|
Leg-1 Ankara |
Q7 |
73.65 |
|
Q5 |
51.20 |
|
|
Leg-2 City Centre |
Q9 |
70.15 |
|
Leg-3 Eskişehir |
Q8 |
75.60 |
|
Q6 |
59.90 |
|
|
Leg-4 Industry |
Q10 |
78.60 |
|
Average Delay Time (s/veh) |
68.18 |
|
2.3 The model for the improvement of signaling and the method for the detection of delays
In this study, a signaling improvement model was developed and implemented at the Sanayi Intersection. The objective of the improvement model was to enhance the efficiency of signaling operations in comparison to the existing fixed-time signaling system. The model is designed to adapt to varying traffic conditions through the usage of an adaptive algorithm. Specifically, the improvement algorithm includes codes that allow the signaling system to automatically modify signal timings based on real-time data collected from sensors. The overarching objective of the signaling improvement model is to achieve enhanced operational efficiency through the dynamic modification of signal timings in response to prevailing traffic conditions. The most significant distinction between the signaling improvement model and other adaptive management and optimization models is that it enhances performance by referencing real-time performance measurement data. Other adaptive management and optimization models are typically based on the provision of signaling operations in accordance with data obtained from traffic sensors. In other words, the results of the implementation of green times in other models are not measured in real time and this data is not included in the decision-making mechanism. The signaling improvement model developed in this study guarantees that the impact of the established green times on real-time performance is observable. Furthermore, this performance outcome serves as an input parameter in the decision-making process for the newly determined signaling times.
In the signaling improvement model, Bluetooth sensors and loop sensors placed at the Sanayi Intersection are employed. One of the most significant contributions of this study is the utilization of Bluetooth sensors as a source of real-time data for the purpose of adaptive traffic management. Bluetooth sensors capture Bluetooth signals that are open on headphones, car music players, and mobile phones, and record the Media Access Control (MAC) addresses of the devices. The sensors are capable of collecting the MAC addresses and detection times of Bluetooth devices that are in use at the location in question. Consequently, the time required for vehicles or passengers to traverse the distance between two locations where Bluetooth sensors are positioned can be ascertained. The travel times of vehicles crossing the intersection legs are measured using Bluetooth sensors installed at the Sanayi Intersection. Additionally, the number of vehicles needs to be determined to calculate the total travel time for each vehicle, based on the recorded travel times. Furthermore, loop sensors have been installed at the Sanayi Intersection's legs for the purpose of counting vehicles. Loop sensors are inductive systems. A closed circuit is established by passing an electrical current through a cable that has been inserted into narrow incisions in the road surface. The loop sensor creates a magnetic field when an electric current flows through it. The magnetic field generated by the loop detector is altered by the presence of a vehicle, allowing for the detection of vehicles with the use of loop detector electronic cards. Photographs of the Bluetooth sensor and loop sensor are presented in Figure 4.
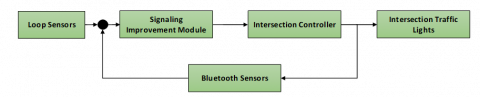
The objective of the signaling improvement model is to enhance the efficiency of signalized intersection management. The overarching framework of the model, as it pertains to the Sanayi Intersection, is illustrated in Figure 5. The system is, in essence, a feedback structure, the objective of which is to provide optimal signaling times. The impact of the signal timing strategies deployed at the signalized intersection on operational performance is assessed through real-time feedback, enabling the adjustment of signal times as necessary. The effect of signal timing on travel times at the intersection is quantified through the use of Bluetooth sensors, which provide data as input to the model in the form of feedback. Consequently, the model increases or decreases the green signal times in accordance with the requisite adjustments.
Figure 4. Sensors field images used in signaling improvement model
Figure 5. General schematic of signaling improvement model
Figure 6. Sanayi Intersection sensor placements
Table 3. Data examples from Bluetooth and loop sensors
|
Input Device BT-Number |
Output Device BT-Number |
Traffic Flow |
Average Travel Time (s) |
Loop Sensor Number |
Number of Vehicles (pcs) |
Total Travel Time (s) |
|
BT-3 |
BT-2 |
Q9 |
98 |
Loop 5-6 |
5 |
490 |
|
BT-4 |
BT-2 |
Q6 |
62 |
Loop 7-8-9 |
38 |
2,356 |
|
BT-4 |
BT-3 |
Q8 |
112 |
Loop 10 |
10 |
1,120 |
|
BT-2 |
BT-4 |
Q5 |
54 |
Loop 2-3-4 |
42 |
2,268 |
|
BT-1 |
BT-4 |
Q10 |
89 |
Loop 11-12 |
16 |
1,424 |
|
BT-2 |
BT-1 |
Q7 |
101 |
Loop 1 |
4 |
404 |
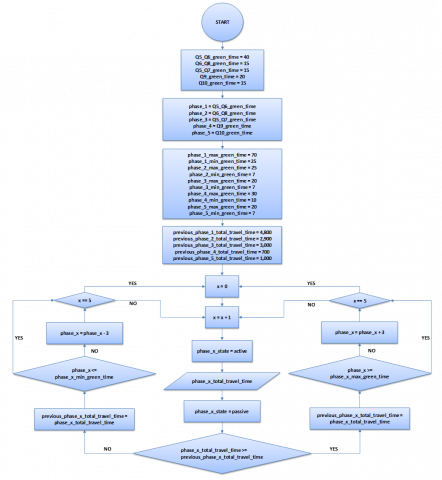
Figure 7. Signaling improvement model flowchart
As illustrated in Figure 6, the sensors positioned at the Sanayi Intersection are depicted. The data input is provided to the signaling improvement module with the assistance of the sensors situated at the intersection. The signal times are enhanced in the signaling improvement module with the data obtained from the sensors.
The Bluetooth sensors positioned at Sanayi Intersection are designed to detect the times at which vehicles enter and exit the intersection. In this manner, the travel time of a vehicle from the moment it enters the intersection via any approach until it exits is quantified. This data provides information regarding the fluctuations in travel time resulting from variations in signal timing. Furthermore, the number of vehicles traversing the intersection leg is also discerned through the use of loop sensors. Consequently, the total travel time is determined in real time by multiplying the travel times and the number of vehicles. To illustrate, the travel times detected from Bluetooth (BT) 4 to BT 1 and from BT 4 to BT 2 are employed as the basis for the Q6 traffic flow. In regard to vehicle counts, the data obtained from the Loop 7, 8, 9, and 10 sensors are recorded. Table 3 illustrates an example of the detected data.
The flow chart of the signaling improvement model is shown in Figure 7. The algorithms given in the flow chart are run within the module and applied to the Sanayi Intersection.
As illustrated in the flow chart, the model is initially initiated. In the initial stage of the definition process, the requisite green times for the phases constituted by each Q traffic flow are specified. In the second definition step, each phase of the signaling cycle is defined in terms of Q traffic flows. In the third definition step, the maximum and minimum green times defined for the system are provided for each phase. The maximum and minimum green times for phase 1 are defined as follows: "phase_1_max_green_time = 70" and "phase_1_min_green_time = 25". In the fourth definition step, the initial total travel times for each phase at the intersection are provided. The total travel time for phase 1 is calculated to be "previous_phase_1_total_travel_time = 4800". Subsequently, phase 1 is initiated with the value "x = 1", and phase 1, constituted by Q5-Q6 traffic flows, commences operation with an initial green time of 40 seconds. The value of "phase_1_total_travel_time" is derived from the total travel times of vehicles passing through the 40 seconds green interval for phase 1, as obtained through Bluetooth and loop sensors positioned in the field. Once the designated phase time has elapsed, the conditional decision-making phase commences. In the conditional decision step, the response to the inquiry "phase_1_total_travel_time>=previous_phase_1_total_travel_time", posed as a comparison condition, is sought. In the event that the newly detected total travel time exceeds that of the previous total travel time, the latter is initially recorded and subsequently utilized in the subsequent cycle. Concurrently, the green time allotted to phase 1 is augmented by a period of three seconds. In other words, the green time is increased to 43 seconds. Prior to this, the algorithm determines whether the green time of phase 1 exceeds the maximum permitted green time. The rationale behind this is to reduce the increased travel time due to traffic density.
In the event that the recently identified total travel time is less than that of the preceding total travel time, the latter is initially documented as the latest total travel time and employed in the subsequent cycle. Concurrently, the phase 1 green time is diminished by three seconds. In other words, the resulting value is 37 seconds. Prior to reduction, it is determined whether the green time allotted for phase 1 exceeds the minimum requisite green time. As a consequence of the algorithm identifying a reduction in travel time, the green light duration is reduced and the unnecessary allocation of green time is eliminated.
A cycle time is defined as the completion of all five phase conditions delineated in the flow chart. The aforementioned defined operations are then repeated for phase 2, phase 3, phase 4, and phase 5. Consequently, the adaptive green times are adjusted in accordance with the total travel times recorded for all phases. The signaling improvement model flow chart lacks a definitive conclusion. The flow chart is designed to optimize the durations of the signaling phases throughout the day in a continuous loop. The user may modify the increments and decrements, which are set at three seconds, according to the total travel time differences.
Table 4. Delay time counts for Q6 in signaling improvement model
|
Vehicle Sample Number |
Tin (s) |
Tout (s) |
Tout-Tin (s) |
Average Delay (s/veh) |
|
Vehicle 1 |
11 |
26 |
15 |
44.2 |
|
Vehicle 2 |
12 |
98 |
86 |
|
|
Vehicle 3 |
11 |
92 |
81 |
|
|
Vehicle 4 |
19 |
66 |
47 |
|
|
Vehicle 5 |
11 |
56 |
45 |
|
|
Vehicle 6 |
8 |
35 |
27 |
|
|
Vehicle 7 |
11 |
19 |
8 |
|
|
Vehicle 8 |
10 |
98 |
88 |
|
|
Vehicle 9 |
14 |
23 |
9 |
|
|
Vehicle 10 |
10 |
45 |
35 |
|
|
Vehicle 11 |
13 |
110 |
97 |
|
|
Vehicle 12 |
11 |
57 |
46 |
|
|
Vehicle 13 |
12 |
22 |
10 |
|
|
Vehicle 14 |
9 |
34 |
25 |
|
|
Vehicle 15 |
10 |
51 |
41 |
|
|
Vehicle 16 |
12 |
45 |
33 |
|
|
Vehicle 17 |
10 |
78 |
68 |
|
|
Vehicle 18 |
11 |
57 |
46 |
|
|
Vehicle 19 |
9 |
43 |
34 |
|
|
Vehicle 20 |
9 |
52 |
43 |
|
|
Vehicle 21 |
8 |
103 |
95 |
|
|
Vehicle 22 |
10 |
28 |
18 |
|
|
Vehicle 23 |
10 |
29 |
19 |
|
|
Vehicle 24 |
10 |
65 |
55 |
|
|
Vehicle 25 |
12 |
55 |
43 |
|
|
Vehicle 26 |
11 |
46 |
35 |
|
|
Vehicle 27 |
9 |
55 |
46 |
|
|
Vehicle 28 |
8 |
48 |
40 |
|
|
Vehicle 29 |
13 |
29 |
16 |
|
|
Vehicle 30 |
11 |
47 |
36 |
|
|
Vehicle 31 |
13 |
34 |
21 |
|
|
Vehicle 32 |
14 |
48 |
34 |
|
|
Vehicle 33 |
12 |
92 |
80 |
|
|
Vehicle 34 |
10 |
77 |
67 |
|
|
Vehicle 35 |
9 |
57 |
48 |
|
|
Vehicle 36 |
9 |
45 |
36 |
|
|
Vehicle 37 |
11 |
78 |
67 |
|
|
Vehicle 38 |
10 |
60 |
50 |
|
|
Vehicle 39 |
9 |
54 |
45 |
|
|
Vehicle 40 |
10 |
43 |
33 |
In order to calculate the delay times associated with the signaling improvement model, data from the peak hour on November 8, 2023, between 17:30 and 18:30 p.m., were utilized. The data were obtained by analyzing video footage captured by the traffic camera at the intersection. Figure 8 depicts the image captured by the fish-eye traffic analysis camera at the intersection.
The outcomes obtained through the observation of the intersection via camera images in the signaling improvement model are enumerated separately for each leg. A total of 40 vehicle samples were collected from each traffic flow, and the in-and-out times were documented to ascertain the extent of delays. The data collected for Q6 traffic flow are presented in Table 4 for illustrative purposes.
The visual detection method utilized to ascertain the delay value of the Q6 traffic flow was subsequently applied to all traffic flows. Table 5 presents the delay values of all traffic flows identified through the visual detection method for the signaling improvement model.
Figure 8. Fisheye camera image used for analysis of signaling improvement model
Table 5. Delay times in signaling improvement model by legs and traffic flows
|
Leg of Intersection |
Traffic Flow |
Delay Time (s/veh) |
|
Leg-1 Ankara |
Q7 |
69.05 |
|
Q5 |
39.60 |
|
|
Leg-2 City Centre |
Q9 |
59.05 |
|
Leg-3 Eskişehir |
Q8 |
62.70 |
|
Q6 |
44.20 |
|
|
Leg-4 Industry |
Q10 |
51.65 |
|
Average Delay Time (s/veh) |
54.38 |
|
2.4 Determination of intersection level of service
The Highway Capacity Manual (HCM) is a widely utilized tool for determining the level of service at intersections. The level of service at intersections is evaluated based on a number of factors, including traffic flow speed, density, waiting time and delay time. Service levels are typically represented by a letter grade, with "A" representing the optimal service level and "F" indicating the least favorable. These levels of service are employed for the evaluation and enhancement of intersection design and functionality.
The level of service criteria for signalized intersections is defined in the Highway Capacity Manual document. The levels of service, as determined based on the delay time for motor vehicles are presented in Table 6. The levels of service are graded A, B, C, D, E, and F. As illustrated in the table, level A represents the optimal signalized intersection with the lowest delay time, whereas level F represents a suboptimal signalized intersection with the highest delay time [38].
Using the visual detection method, the average delay per vehicle under the fixed-time signaling system was calculated to be 68.18 s/veh, while the average delay per vehicle under the signaling improvement model was determined to be 54.38 s/veh. In accordance with the data presented in Table 7, the level of service is determined as E in the fixed-time signaling system, and the level of service is classified as D in the signaling improvement model.
The observed delay times and levels of service observed for the fixed-time control and the proposed signaling improvement model indicate notable improvements in intersection performance. However, these improvements are not distributed uniformly across all traffic movements, as each approach to the intersection benefits to varying degrees. A comprehensive examination of the reduction in delay times for each traffic movement serves to illustrate the model's disparate impact.
Table 8 presents a comparison of delay times and corresponding levels of service for each traffic movement under the fixed-time signaling system and the proposed signaling improvement model.
Table 6. Level of service for signalized intersections
|
dt=Delay Time (s/veh) |
Level of Service Criteria |
|
dt≤10 |
A |
|
10<dt≤20 |
B |
|
20<dt≤35 |
C |
|
35<dt≤55 |
D |
|
55<dt≤80 |
E |
|
dt>80 |
F |
Table 7. Sanayi Intersection level of service
|
Signaling System Operation |
Delay Time (s/veh) |
Level of Service Criteria |
|
Fixed-Time Signaling System |
55< 68.18 ≤80 |
E |
|
Signaling Improvement Model |
35< 54.38 ≤55 |
D |
Table 8. Traffic flow-based delay times and level of service for fixed-time signaling system and signaling improvement model
|
Traffic Flow |
Delay Time (s/veh) (Fixed-Time) |
Level of Service (Fixed-Time) |
Delay Time (s/veh) (Signaling Improvement Model) |
Level of Service (Signaling Improvement Model) |
|
Q7 |
73.65 |
E |
69.05 |
E |
|
Q5 |
51.20 |
D |
39.60 |
D |
|
Q9 |
70.15 |
E |
59.05 |
E |
|
Q8 |
75.60 |
E |
62.70 |
E |
|
Q6 |
59.90 |
E |
44.20 |
D |
|
Q10 |
78.60 |
E |
51.65 |
D |
|
Average Values |
68.18 |
E |
54.38 |
D |
The data reveal that while the proposed model reduces delays across all traffic movements, the magnitude of improvement varies. For movements such as Q7 and Q9, the reductions in delay times are moderate, decreasing from 73.65 seconds to 69.05 seconds and from 70.15 seconds to 59.05 seconds, respectively. These improvements, while significant, are less pronounced due to these movements already being relatively well-managed under the fixed-time system. In contrast, the most substantial improvements are observed in movements such as Q10 and Q8. To illustrate, the delay for Q10 is reduced from 78.60 seconds to 51.65 seconds, representing a major enhancement in service quality. Similarly, the Q8 flow experiences a notable decrease in delay from 75.60 seconds to 62.70 seconds. Moreover, the improvements in Q6 are noteworthy, as the model reduces the delay time from 59.90 seconds down to 44.20 seconds, elevating the level of service from E to D. These outcomes illustrate that the proposed model's adaptive control is particularly efficacious in addressing high-traffic demands.
In conclusion, the proposed signaling improvement model demonstrates its capacity to adapt to the specific needs of different traffic movements. While all movements benefit, traffic flows see notable improvements at the most congested and complex times. This emphasizes the model's capability to dynamically adjust signal timings according to real-time conditions, making it a robust solution for a variety of intersection scenarios.
The study effectively addresses the critical challenge of optimizing traffic signal timings to reduce delays and improve the level of service at signalized intersections. The proposed signaling improvement model, which integrates real-time feedback through the use of Bluetooth and loop sensors, represents a novel and promising approach to adaptive traffic control. This method is distinguished from conventional systems in that it not only responds to real-time traffic data but also incorporates the performance outcomes of previously applied signal timings into subsequent decision-making cycles. This feedback mechanism ensures continuous optimization, thereby enabling the system to adapt dynamically to varying traffic conditions with greater precision than is possible with traditional models.
In comparison to existing adaptive traffic control systems, which frequently depend on solely static sensor data without feedback integration, this approach represents a significant advancement. The majority of existing systems modify signal timings based on pre-established algorithms or real-time inputs from sensors. However, these systems lack a mechanism to assess the direct impact of these adjustments on traffic flow. The proposed model addresses this limitation by measuring the impact of signal timing on actual travel times and utilizing these findings to refine the control algorithms. This iterative feedback process enhances the system's ability to optimize signal timings, thereby facilitating more efficient traffic management and reducing delays.
Extending the aforementioned signaling improvement model to a more expansive urban network indicates the potential for substantial enhancements in fuel efficiency, a reduction in carbon emissions, and a decrease in the time required for drivers to reach their destinations [39, 40]. For example, the reduction in delay times will result in a decrease in fuel consumption and an increase in efficiency, which will contribute to environmental sustainability. Furthermore, optimized traffic flow can mitigate congestion, enhancing the overall travel experience for road users and potentially reducing the incidence of traffic-related accidents. These quantified benefits serve to underscore the broader significance of the proposed system and its potential to set a new standard for adaptive traffic control solutions.
In this study, the visual detection method was employed to ascertain the delay parameters for the Sanayi Intersection under disparate operating conditions, and the level of service was evaluated in accordance with these delay parameters. A significant aspect of this study is that the observations were conducted within the same time period, with a one-day interval between measurements. This approach ensured that comparable traffic characteristics were employed for assessment of delay parameters for both the fixed-time and the signaling improvement models, thereby maintaining consistency in the evaluated conditions. It is observed that the traffic characteristics at signalized intersections tend to remain consistent within the same time zones on weekdays.
The study found that the signaling improvement model outperformed the fixed-time signaling system in terms of efficiency. The model's capacity to adapt signal timings in accordance with real-time traffic conditions results in enhanced performance, as evidenced by reduced delay values. Furthermore, this adaptive approach yields benefits with respect to the level of service. Table 9 provides a detailed account of the improvement value and percentage for the Sanayi Intersection.
Table 9. Sanayi Intersection improvement value and percentage
|
Signaling System Operation |
Delay Time (s/veh) |
Improvement Percentage |
|
Fixed-Time Signaling System |
68.18 |
20.24% |
|
Signaling Improvement Model |
54.38 |
3.1 Verification studies with Webster's theorem
The Webster model was initially employed to substantiate the precision of the visual detection methodology utilized in the investigation. The accuracy of the visual detection method employed in the study was evaluated through the implementation of Webster model calculations for the fixed-time signaling system.
To calculate the delays associated with the fixed-time signaling system, data from the Sanayi Intersection, including cycle time, green times, and peak hour traffic density values, were gathered from the intersection control device before the adaptive signaling system was implemented. This data was collected during the peak hour. In order to minimize delay, the Webster model was employed for the computations.
The Webster delay formula was employed to calculate the average delays per vehicle, with the collected data substituted accordingly [41]. To ensure greater accuracy, the calculations were performed separately for each leg. The formula is provided in Eq. (1).
$d=\frac{C(1-\lambda)^2}{2(1-\lambda x)}+\frac{x^2}{2 q(1-x)}-0.65\left(\frac{C}{q^2}\right)^{\frac{1}{3}} x^{2+5 \lambda}$ (1)
d: Average delay per vehicle (s/veh),
C: Cycle time (s),
q: Peak flow in the relevant phase (veh/h),
λ: Ratio of green time (G) to cycle time (G/C),
x: Saturation ratio (x = (q/λs) (s=saturation flow))
An illustrative calculation is provided for the purpose of elucidating the Q5 traffic flow.
The value of s (saturation flow), which is employed as a multiplier in the formula was calculated by substituting values such as lane information, speed and slope in Eq. (2), without including parameters related to driver behavior [42].
$s=990+288 T L+8.5 S L-26 G$ (2)
s: Saturation flow (veh/h)
TL: Number of lanes (3 lanes for Q5)
SL: Speed limit (40 km/h for Q5)
G: Slope (%0 for Q5)
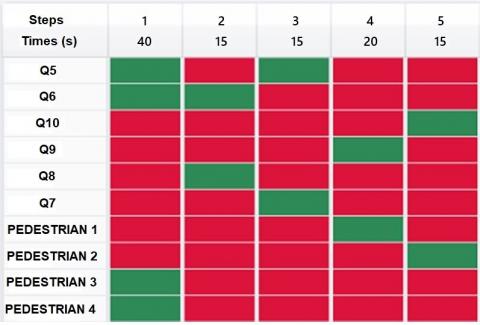
In the formula, the C value represents the total cycle time. The program and timings utilized in the fixed-time signaling system are illustrated in Figure 9. The requisite protection time at the intersection is set to 12 seconds.
Figure 9. Sanayi Intersection times for the fixed-time signaling system
Accordingly, the following values are determined for the Q5 traffic flow.
$\begin{gathered}q=727 \text { veh } / \mathrm{h} \\ C=153 \mathrm{~s} \\ G=55 \mathrm{~s} \\ \mathrm{~s}=2194 \mathrm{veh} / \mathrm{h}\end{gathered}$
When the values are substituted into Eq. (3), the average delay per vehicle for Q5 is calculated.
$d=\frac{153\left(1-\left(\frac{55}{153}\right)\right)^2}{2\left(1-\left(\frac{55}{153}\right)\left(\frac{727}{\left(\frac{55}{153}\right) 2194}\right)\right)}+\frac{\left(\frac{727}{\left(\frac{55}{113}\right) 2194}\right)^2}{2 * 727\left(1-\left(\frac{727}{\left(\frac{55}{153}\right) 2194}\right)\right)}-0.65\left(\frac{153}{727^2}\right)^{\frac{1}{3}}\left(\frac{727}{\left(\frac{55}{153}\right) 2194}\right)^{2+5\left(\frac{55}{153}\right)}$ (3)
$d=46.92 \mathrm{~s} / \mathrm{veh}$
The delay times were calculated by inputting the peak hour data into Webster's delay formula for each individual leg separately, and the results are presented in Table 10.
In the visual detection method, the average delay per vehicle in the fixed-time signaling system was found to be 68.18 s/veh. Verification calculations conducted in accordance with Webster's theorem yielded an average delay per vehicle for the aforementioned intersection of 64.63 s/veh. As can be observed in Table 11, the outcomes of the visual detection method and the Webster model are found to be approximately analogous. This is a notable finding in regard to the precision of the results obtained from the methodology employed in the present study. The discrepancy between the two values is negligible, amounting to a mere 3.55 s/veh. This discrepancy can be attributed to the fact that the visual detection method depends on data collected from real-world conditions. In other words, external factors exert a more direct influence on the values obtained through the visual detection method. It is to be expected that a slight discrepancy will arise between the results of the visual detection method and those of the Webster method, given that external factors such as road deterioration, pedestrian behavior and driver behavior can exert an influence. The delay value per vehicle in the visual detection method is slightly higher due to the influence of external factors such as road deterioration, pedestrian behavior and driver behavior. As the data in the visual detection method are obtained directly through observation in the field, the margin of error is consequently reduced.
Table 10. Webster's formula delay time results for fixed-time signaling system
|
Leg of Intersection |
Traffic Flow |
Delay Time (s/veh) |
|
Leg-1 Ankara |
Q7 |
69.11 |
|
Q5 |
46.92 |
|
|
Leg-2 City Centre |
Q9 |
67.88 |
|
Leg-3 Eskişehir |
Q8 |
71.36 |
|
Q6 |
52.38 |
|
|
Leg-4 Industry |
Q10 |
80.14 |
|
Average Delay Time (s/veh) |
64.63 |
|
Table 11. Delay values determined by visual detection method and Webster method for fixed-time signaling system
|
Method |
Delay Time (s/veh) |
|
Visual Detection Method |
68.18 |
|
Webster Method |
64.63 |
3.2 Verification studies with SUMO simulation program
The second method, simulation studies, was conducted to verify the visual detection method. In the simulation studies, the open-source program SUMO was selected as the preferred option. The Sanayi Intersection was operated with a fixed-time signaling system and signaling improvement model. The fixed-time signaling times are illustrated in Figure 9. The data was recorded at varying times, corresponding to the parameters of the signaling improvement model. Additionally, vehicle counts were recorded as data from loop sensors in two different operational scenarios. The signal times and vehicle counts were subsequently input into the SUMO simulation program.
The Sanayi Intersection is modeled in the SUMO simulation program with a one-to-one correspondence. All physical aspects of junction are modelled, including lane widths, lane numbers, turn lanes and geometric features. Furthermore, regarding the visibility of parking and driver behavior at the intersection are incorporated as inputs into the modeled intersection.
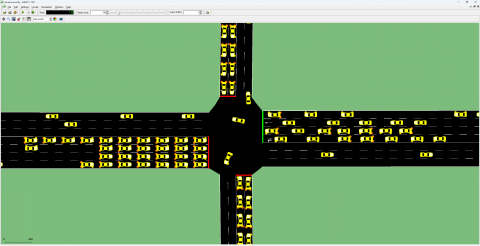
The Sanayi Intersection, modeled in the SUMO simulation program, is depicted in Figure 10. The modeled intersection was operated in a simulation environment with traffic data on November 07, 2023 and November 08, 2023 between 17.30 – 18.30. The resulting delay data was obtained from the simulation model, which was run using vehicle counts and signal times for both the fixed-time signaling system and the signaling improvement model during the times of day in operation.
Figure 10. Sanayi Intersection SUMO modeling
Table 12. Delay values determined by visual detection method and SUMO simulation program
|
Method |
Fixed-Time Signaling System Delay Time (s/veh) |
Signaling Improvement Model Delay Time (s/veh) |
|
Visual Detection Method |
68.18 |
54.38 |
|
SUMO Simulation Program |
63.79 |
58.12 |
Table 13. The delay estimates from all three methods
|
Method |
Fixed-Time Signaling System Delay Time (s/veh) |
Signaling Improvement Model Delay Time (s/veh) |
|
Visual Detection Method |
68.18 |
54.38 |
|
Webster Method |
64.63 |
- |
|
SUMO Simulation Program |
63.79 |
58.12 |
The simulation results of the Sanayi Intersection fixed-time signaling system and signaling improvement model working methods are presented in Table 12.
In the visual detection method, the average delay per vehicle in the fixed-time signaling system is found to be 68.18 s/veh, while in the signaling improvement model, it is determined to be 54.38 s/veh. As a result of simulation verification method, the average delay value per vehicle for the identical intersection is determined to be 63.79 s/veh for the fixed-time signaling system and as 58.12 s/veh for the signaling improvement model. As evidenced by the results, the outputs of visual detection method and the simulation program are highly correlated. These discrepancies can be observed as external effects in the real-world operations, such as variations in pedestrian behavior or driver conduct.
3.3 General evaluation and related studies
In this study, the visual detection method used to estimate vehicle delays at the Sanayi Intersection was validated against two well-established methods: the Webster delay model and the SUMO simulation program. The objective of this validation was to evaluate the dependability of the delay estimates derived from the visual detection method and to guarantee consistency with the outcomes of widely accepted traffic modeling techniques.
The delay times obtained through the visual detection method were compared with the delay values calculated using Webster's formula and the results from the SUMO simulation program. The visual detection method entailed the tracking of vehicles via fisheye cameras during peak hours, with the time taken for vehicles to traverse the intersection being recorded. The Webster model, a widely used analytical tool, was employed to calculate delays based on cycle time, flow rates, and other intersection parameters. The SUMO simulation tool, which is open-source, was employed to model the traffic behavior at the intersection and to simulate the delays for both the fixed-time and proposed signaling systems.
The comparison of the delay values for each method revealed that the estimates were, for the most part, in close agreement, with only minor discrepancies. In the case of fixed-time signaling system, the visual detection method estimated an average delay per vehicle of 68.18 seconds, whereas Webster's model yielded a delay of 64.63 seconds. The delay values derived from the SUMO simulation for the same system were slightly lower, at 63.79 seconds. The discrepancies between the visual detection method and the other two methods can be attributed to the real-world factors captured in the visual detection, such as driver behavior, road conditions, and pedestrian interactions, which are not fully accounted for in the mathematical models or simulations.
Upon implementation of applying the proposed signaling improvement model, the visual detection method yielded an average delay per vehicle of 54.38 seconds, whereas the SUMO simulation estimated the delay at 58.12 seconds. Once more, the outcomes of both methods exhibited a high degree of concordance, with the sole discrepancy observed between the visual detection and SUMO results pertaining to the signaling improvement model. The discrepancy between the two methods can be attributed to the inherent limitations of each approach, including the simplified traffic assumptions inherent to SUMO.
Table 13 presents a summary of the estimated delays from all three methods for both the fixed-time signaling system and the proposed model.
As illustrated in the table, the estimated delays from all three methods are relatively similar, with the visual detection method yielding slightly higher values. This slight overestimation in visual detection is consistent with the reality of field conditions, which may include factors like minor traffic disruptions and variations in driver behavior that are not fully captured in theoretical models. The consistency among the three methods demonstrates the reliability of the evaluation process and validates the accuracy of the visual detection method as a tool for assessing delays at signalized intersections.
In the study, a signaling improvement model is designed and subsequently implemented at the Sanayi Intersection. The efficacy of the signaling improvement model implemented at the Sanayi Intersection is illustrated through a comparative analysis with the fixed-time signaling system. One of the most significant aspects of this study is the temporal framework within which it was conducted. The method was implemented between 17.30-18.30 at Sanayi Intersection. Upon examination of the daily traffic patterns at Sanayi Intersection, it was determined that 17.30-18.30 time period represents one of the highest density hours. In other words, the results obtained in the study are reflective of conditions occurring during a period when traffic volume is at its peak. Given that the signaling improvement model is designed to adapt to changing traffic conditions, it is anticipated that it will demonstrate enhanced performance in other periods throughout the day. Consequently, when the number of vehicles is low, the signaling improvement model will operate signal times with greater efficiency than the fixed-time signaling system. It can thus be posited that the discrepancy between the per-vehicle delay values between fixed-time signaling operation and signaling improvement model operation will increase when the visual detection method in this study is applied to traffic at other times of the day. As a consequence of the aforementioned, the number of steps among the level of service criteria of the intersection will also increase, given that the difference between delay values per vehicle will increase.
In this study, performance measurement is conducted using a visual detection method and the method is validated through the application of the Webster theorem and SUMO simulation. A principal objective of this study is to present a methodology for evaluating the performance of signaling operating systems. This method is not contingent on the specific signaling operating type. This method allows for the examination of differences in the operation of fixed-time, half-actuated, fully-actuated, and adaptive signaling systems. Furthermore, this method can be employed to investigate the impact of alterations in intersection configurations (geometries) on delay per vehicle. Simulations and theorems are based on parameters such as driver and pedestrian behavior, as well as road imperfections. Nevertheless, this method considers the direct perception of parameters.
Up to now, a multitude of signaling systems and algorithms have been developed with the objective of enhancing their performance. The outcomes of these systems have been quantified and articulated through a variety of methodologies. In these signaling systems, a variety of sensors and data collection methods have been employed. In this study, a signal control algorithm was developed that integrates vehicle path optimization with signal control, utilizing advanced communication technology between approaching vehicles and the signal controller. The MATLAB environment was employed in the study of algorithm. The results demonstrate that the proposed optimization algorithm can enhance intersection performance by reducing vehicle travel time delays, increasing efficiency and capacity. Furthermore, it performs more effectively under congested conditions [43]. In a separate study, an adaptive traffic light control system was developed that employs image processing and image matching techniques in signaling control. In the study, five distinct edge detectors were employed, including Sobel, Canny, Roberts, Log and active contour. The Canny edge process was identified as the best for edge detection [44]. In separate study, the green signal time was calculated using a fuzzy logic controller method that incorporated variables such as the number of motorcycles, cars, and queue length. The findings indicated that the traffic light regulation system employing fuzzy logic controllers demonstrated superior performance compared to the conventional system [45]. In a study, an optimization-based traffic signal cycle length model was developed for signalized intersections. The model was recalibrated using delay parameters in accordance with the Webster delay model, with consideration of the specific traffic conditions in China. The performance of the optimization cycle length model was evaluated in comparison with the TRRL model in terms of delay time and queue length. The findings suggest that the optimization traffic signal cycle length model is more effective than the TRRL model [46]. A modular Timed Synchronized Petri Net (TSPN) model was developed for the implementation of a real-time adaptive control strategy at signalized intersections. The studies were conducted using the SUMO simulation program and the MATLAB program. The study's findings indicate that the proposed control strategy effectively reduces the delay and ensures the safe flow of traffic at the intersection [47]. Another study proposes a heuristic adaptive traffic control algorithm that employs demand estimation based on queue length, with the objective of performing more effectively under varying traffic conditions. The algorithm was analyzed using the VISSIM simulation program. The developed algorithm was evaluated based on two key performance indicators: average control delay and average queue length. Significant improvements are observed in these parameters with the heuristic adaptive traffic control algorithm [48]. In another study, a dynamic control strategy of a signalized intersection is proposed. This strategy enables autonomous adjustment of the green signal time in accordance with the queue length for each lane. The proposed strategy was analyzed using the SUMO simulation program. It can thus be concluded that the proposed dynamic control strategy is more efficient [49]. In another study, an adaptive traffic signal control system based on fuzzy logic controller is proposed. This system utilizes the flow rate received from simple sensors as an input is proposed. The studies were conducted using a micro-scale simulation program. The results demonstrated that the proposed adaptive control model exhibited superior efficiency [50]. In a study, signaling control was conducted using Q-learning method. At the intersection where Q-learning was employed, a notable improvement was observed in terms of reduced queue length and waiting time, as well as a decreased standard deviation of queue lengths [51]. In another study, an adaptive control model for signalized intersections was proposed and subsequently implemented in a real-world setting at a physical intersection. The analyses conducted in the SUMO simulation program revealed that the proposed adaptive model had a beneficial impact on the delay parameter [52]. In another study, a sensor fusion methodology was developed to generate data for use in smart intersections. The sensor fusion comprises image-processing-based cameras and loop sensors. The aforementioned sensor structure has proven effective in a number of applications, including the tracking of object movements, the generation of demand profiles, the detection of incidents, and the enumeration of turn movements [53].
In comparison to other studies in the field, this study makes a significant contribution to the scientific community by offering an adaptive method with feedback. Typically, adaptive signaling systems utilize diverse algorithms and optimization techniques to ascertain signal times based on data obtained from traffic sensors. In this study, the results of the determined adaptive signal times are evaluated and provided as input to the subsequent decision-making algorithm. In other words, the impact of the identified signal times on the travel times on the intersection is quantified and utilized as feedback to inform the subsequent signal time determination process, allowing for a continuous evaluation of the results.
A further innovative aspect of this study is the creation of a sensor fusion consisting of Bluetooth and loop sensors. In adaptive signaling systems, sensors such as cameras, loop sensors, lidar, and radar are typically employed. In this study, Bluetooth sensors and loop sensors are employed in conjunction to generate feedback data and traffic data.
In the signaling improvement model, the objective is to implement a design comprising distinct features and components at the Sanayi Intersection. The implementation of this applied model in urban contexts with different intersection geometries and varying traffic patterns will prove invaluable for its further development.
This study presents a novel signaling improvement model for optimizing traffic signal timings and reducing delays at signalized intersections. The model, which integrates real-time feedback from Bluetooth and loop sensors, demonstrated a significant reduction in delay times. Specifically, the proposed model reduced average delay per vehicle by 20.24%, resulting in an improvement in the level of service from E to D at the Polatlı Sanayi Intersection. The results show that the model not only improves overall traffic flow but also benefits individual traffic movements to varying degrees, with some movements experiencing more substantial delay reductions than others. This variability is largely influenced by traffic characteristics, such as volume and flow patterns.
One of the key strengths of the proposed approach is its use of a feedback mechanism that evaluates the effectiveness of applied signal timings and dynamically adjusts them to optimize traffic flow. This real-time adjustment based on observed performance represents a significant advancement over traditional adaptive traffic control systems, which typically lack such feedback integration. Moreover, the integration of Bluetooth sensors provides a unique advantage in estimating travel times and offering real-time insights into traffic dynamics, complementing the more traditional loop sensors used for vehicle counting.
Notwithstanding the aforementioned advancements, the current study is subject to a number of inherent limitations. The efficacy of the model is contingent upon the veracity of the sensor data, and external variables such as meteorological conditions or sensor malfunctions have the potential to influence the outcomes. Moreover, the study concentrated on a single intersection, and although the outcomes are encouraging, further corroboration is necessary across a broader spectrum of intersections with disparate geometries, traffic conditions, and urban contexts. A further limitation is that the accuracy of Bluetooth data is contingent upon the presence of a sufficiently large number of Bluetooth devices in motion. It is possible that discrepancies may be observed in the recorded travel times at intersections where the number of vehicles is minimal.
Further research could concentrate on the refinement of the feedback mechanism with a view to optimizing signal timings on the basis of traffic priorities and congestion levels. Furthermore, exploring the integration of emerging technologies, such as Vehicle-to-Everything (V2X) communication systems, could enhance the adaptability and accuracy of the model. A more thorough investigation into optimizations specific to individual movements could potentially yield further enhancements in traffic flow and reductions in delay. Moreover, extending the system's implementation to other intersections and cities with diverse traffic patterns and infrastructure would provide invaluable insights into the model's generalizability.
The proposed signaling improvement model displays considerable promise with regard to its generalizability. Although the study was conducted at a single intersection, the model's modular and flexible nature indicates that it can be readily adapted to other intersections with different traffic flows and geometries. The dual-sensor configuration, in conjunction with real-time feedback, renders the model applicable to both large urban intersections and smaller, more rural intersections. With the implementation of suitable modifications to the sensor positioning and algorithmic parameters, this model has the potential to serve as a valuable instrument for enhancing the efficacy of traffic management systems on a global scale.
We would like to express our gratitude to the Republic of Turkey General Directorate of Highways and Mosaş Akıllı Ulaşım Teknolojileri Inc. for their invaluable assistance in the completion of this study.
[1] Dimitrakopoulos, G., Demestichas, P. (2010). Intelligent transportation systems. IEEE Vehicular Technology Magazine, 5(1): 77-84. https://doi.org/10.1109/MVT.2009.935537
[2] Guerrero-Ibáñez, J., Zeadally, S., Contreras-Castillo, J. (2018). Sensor technologies for intelligent transportation systems. Sensors, 18(4): 1212. https://doi.org/10.3390/s18041212
[3] Lin, Y., Wang, P., Ma, M. (2017). Intelligent transportation system (ITS): Concept, challenge and opportunity. In 2017 IEEE 3rd International Conference on Big Data Security on Cloud (BIGDATASECURITY), IEEE International Conference on High Performance and Smart Computing (HPSC), and IEEE International Conference on Intelligent Data and Security (IDS), Beijing, China, pp. 167-172. https://doi.org/10.1109/BigDataSecurity.2017.50
[4] Bie, Y., Mao, C., Yang, M. (2016). Development of vehicle delay and queue length models for adaptive traffic control at signalized roundabout. Procedia Engineering, 137: 141-150. https://doi.org/10.1016/j.proeng.2016.01.244
[5] Hajbabaie, A., Benekohal, R.F. (2013). Traffic signal timing optimization: Choosing the objective function. Transportation Research Record, 2355(1): 10-19. https://doi.org/10.3141/2355-02
[6] Mu, R., Nishihori, Y., Kato, H., Ando, R. (2022). Traffic signal optimization models minimizing vehicles’ average delay in an isolated signalized intersection. Journal of the Eastern Asia Society for Transportation Studies, 14: 1906-1918. https://doi.org/10.11175/easts.14.1906
[7] Othayoth, D., Rao, K.K. (2020). Assessing the relationship between perceived waiting time and level of service at signalized intersection under heterogeneous traffic conditions. Asian Transport Studies, 6: 100024. https://doi.org/10.1016/j.eastsj.2020.100024
[8] Tan, W., Li, Z.C., Tan, Z.J. (2017). Modeling the effects of speed limit, acceleration, and deceleration on overall delay and traffic emission at a signalized intersection. Journal of Transportation Engineering, Part A: Systems, 143(12): 04017063. https://doi.org/10.1061/JTEPBS.0000101
[9] Quiroga, C.A., Bullock, D. (1999). Measuring control delay at signalized intersections. Journal of Transportation Engineering, 125(4): 271-280. https://doi.org/10.1061/(ASCE)0733-947X(1999)125:4(271)
[10] Agrahari, A., Dhabu, M.M., Deshpande, P.S., Tiwari, A., Baig, M.A., Sawarkar, A.D. (2024). Artificial intelligence-based adaptive traffic signal control system: A comprehensive review. Electronics, 13(19): 3875. https://doi.org/10.3390/electronics13193875
[11] Eom, M., Kim, B. I. (2020). The traffic signal control problem for intersections: A review. European Transport Research Review, 12: 1-20. https://doi.org/10.1186/s12544-020-00440-8
[12] Hadiuzzaman, M., Rahman, M., Hasan, T., Karim, M.A. (2014). Development of delay model for non-lane based traffic at signalized intersection. International Journal of Civil Engineering, 3(2): 67-82.
[13] Guo, J., Chen, F., Gong, J. (2017). Self-healing control for intersection group under the circumstance of traffic congestion. In 2017 Chinese Automation Congress (CAC), Jinan, China, pp. 5073-5077. https://doi.org/10.1109/CAC.2017.8243680
[14] Rrecaj, A.A., Mazrekaj, R., Hoxha, G. (2023). A modified Webster model for a useful traffic signal timing plan. In Proceedings of the Joint International Conference: 10th Textile Conference and 4th Conference on Engineering and Entrepreneurship, Switzerland, pp. 108-120. https://doi.org/10.1007/978-3-031-48933-4_11
[15] Dion, F., Hellinga, B. (2002). A rule-based real-time traffic responsive signal control system with transit priority: Application to an isolated intersection. Transportation Research Part B: Methodological, 36(4): 325-343. https://doi.org/10.1016/S0191-2615(01)00006-6
[16] Sıkar, R.B., Aslan, H. (2022). Calculation of the delays of autonomous vehicles at signalized intersections using the Webster method. Academic Perspective Procedia, 5(3): 222-232. https://doi.org/10.33793/acperpro.05.03.3561
[17] Zhang, H., Yuan, H., Chen, Y., Yu, W., Wang, C., Wang, J., Gao, Y. (2021). Traffic light optimization based on modified webster function. Journal of Advanced Transportation, 2021(1): 3328202. https://doi.org/10.1155/2021/3328202
[18] Shafii, M.A., Qin, C.S., Ling, E.C.M., Shaffie, E. (2020). Determination of delay at signalized intersection: A case study. Technology Reports of Kansai University, 62(3): 321-332.
[19] Skabardonis, A., Christofa, E. (2011). Impact of transit signal priority on level of service at signalized intersections. Procedia-Social and Behavioral Sciences, 16: 612-619. https://doi.org/10.1016/j.sbspro.2011.04.481
[20] Chen, X., Li, D., Ma, N., Shao, C. (2009). Prediction of user perceptions of signalized intersection level of service based on fuzzy neural networks. Transportation Research Record, 2130(1): 7-15. https://doi.org/10.3141/2130-02
[21] Zhang, L., Prevedouros, P.D. (2003). Signalized intersection level of service incorporating safety risk. Transportation Research Record, 1852(1): 77-86. https://doi.org/10.3141/1852-11
[22] Nedevska, I., Ognjenović, S., Gusakova, E. (2016). Methodology for analysing capacity and level of service for signalized intersections (HCM 2000). In MATEC Web of Conferences, EDP Sciences, p. 05026. https://doi.org/10.1051/matecconf/20168605026
[23] Lopez, P.A., Behrisch, M., Bieker-Walz, L., Erdmann, J., Flötteröd, Y.P., Hilbrich, R., Lücken, L., Rummel, J., Wagner, P., Wiessner, E. (2018). Microscopic traffic simulation using sumo. In 2018 21st International Conference on Intelligent Transportation Systems (ITSC), Maui, HI, USA, pp. 2575-2582. https://doi.org/10.1109/ITSC.2018.8569938
[24] Haddouch, S., Hachimi, H., Hmina, N. (2018). Modeling the flow of road traffic with the SUMO simulator. In 2018 4th International Conference on Optimization and Applications (ICOA), Mohammedia, Morocco, pp. 1-5. https://doi.org/10.1109/ICOA.2018.8370580
[25] Malik, F., Khattak, H.A., Shah, M.A. (2019). Evaluation of the impact of traffic congestion based on SUMO. In 2019 25th International Conference on Automation and Computing (ICAC), Lancaster, UK, pp. 1-5. https://doi.org/10.23919/IConAC.2019.8895120
[26] Oh, S., Chen, Q., Tseng, H.E., Pandey, G., Orosz, G. (2023). Adaptive signalized intersection control in mixed traffic environment of connected vehicles with safety guarantees. In 2023 IEEE 26th International Conference on Intelligent Transportation Systems (ITSC), Bilbao, Spain, pp. 5162-5167. https://doi.org/10.1109/ITSC57777.2023.10422000
[27] Chen, S., Sun, D.J. (2016). An improved adaptive signal control method for isolated signalized intersection based on dynamic programming. IEEE Intelligent Transportation Systems Magazine, 8(4): 4-14. https://doi.org/10.1109/MITS.2016.2605318
[28] Lioris, J., Kurzhanskiy, A., Varaiya, P. (2016). Adaptive max pressure control of network of signalized intersections. IFAC-PapersOnLine, 49(22): 19-24. https://doi.org/10.1016/j.ifacol.2016.10.366
[29] Agrawal, A., Paulus, R. (2020). Intelligent traffic light design and control in smart cities: A survey on techniques and methodologies. International Journal of Vehicle Information and Communication Systems, 5(4): 436-481. https://doi.org/10.1504/IJVICS.2020.111456
[30] Li, D., Wu, J., Xu, M., Wang, Z., Hu, K. (2020). Adaptive traffic signal control model on intersections based on deep reinforcement learning. Journal of Advanced Transportation, 2020(1): 6505893. https://doi.org/10.1155/2020/6505893
[31] Wolshon, B., Taylor, W.C. (1999). Analysis of intersection delay under real-time adaptive signal control. Transportation Research Part C: Emerging Technologies, 7(1): 53-72. https://doi.org/10.1016/S0968-090X(99)00011-X
[32] Wan, C.H., Hwang, M.C. (2018). Value-based deep reinforcement learning for adaptive isolated intersection signal control. IET Intelligent Transport Systems, 12(9): 1005-1010. https://doi.org/10.1049/iet-its.2018.5170
[33] An, H.K., Javeed, M.A., Bae, G., Zubair, N., Metwally, A.S.M., Bocchetta, P., Na, F., Javed, M.S. (2022). Optimized intersection signal timing: An intelligent approach-based study for sustainable models. Sustainability, 14(18): 11422. https://doi.org/10.3390/su141811422
[34] Díaz, J.J.V., González, A.B.R., Wilby, M.R. (2015). Bluetooth traffic monitoring systems for travel time estimation on freeways. IEEE Transactions on Intelligent Transportation Systems, 17(1): 123-132. https://doi.org/10.1109/TITS.2015.2459013
[35] Barcelö, J., Montero, L., Marqués, L., Carmona, C. (2010). Travel time forecasting and dynamic origin-destination estimation for freeways based on bluetooth traffic monitoring. Transportation Research Record, 2175(1): 19-27. https://doi.org/10.3141/2175-03
[36] Yalçınlı, F., Akdemir, B., Durdu, A. (2024). Real-time performance measurement application via Bluetooth signals for signalized intersections. Applied Sciences, 14(17): 7849. https://doi.org/10.3390/app14177849
[37] Gheorghiu, R.A., Iordache, V., Stan, V.A. (2021). Urban traffic detectors–comparison between inductive loop and magnetic sensors. In 2021 13th International Conference on Electronics, Computers and Artificial Intelligence (ECAI), Pitesti, Romania, pp. 1-4. https://doi.org/10.1109/ECAI52376.2021.9515014
[38] HCM 2010 Highway Capacity Manual. (2010). Transportation Research Board, Washington, DC. USA. http://sites.poli.usp.br/d/ptr3531/HCM2010-Chapter%2036%20-%20Travel%20Time%20Reliability.pdf.
[39] Lertworawanich, P., Unhasut, P. (2021). A CO emission-based adaptive signal control for isolated intersections. Journal of the Air & Waste Management Association, 71(5): 564-585. https://doi.org/10.1080/10962247.2020.1862940
[40] Al-Arkawazi, S.A.F. (2018). Measuring the influences and impacts of signalized intersection delay reduction on the fuel consumption, operation cost and exhaust emissions. Civil Engineering Journal, 4(3): 552-571. https://doi.org/10.28991/cej-0309115
[41] Preethi, P., Varghese, A., Ashalatha, R. (2016). Modelling delay at signalized intersections under heterogeneous traffic conditions. Transportation Research Procedia, 17: 529-538. https://doi.org/10.1016/j.trpro.2016.11.107
[42] Bester, C.J., Meyers, W.L. (2007). Saturation flow rates. In Proceedings of the 26th South African Transport Conference (SATC), Pretoria, South Africa, pp. 560-568. http://hdl.handle.net/10019.1/42639
[43] Li, Z., Elefteriadou, L., Ranka, S. (2014). Signal control optimization for automated vehicles at isolated signalized intersections. Transportation Research Part C: Emerging Technologies, 49: 1-18. https://doi.org/10.1016/j.trc.2014.10.001
[44] Meng, B.C.C., Damanhuri, N.S., Othman, N.A. (2021). Smart traffic light control system using image processing. IOP Conference Series: Materials Science and Engineering, IOP Publishing, 1088: 012021. https://doi.org/10.1088/1757-899X/1088/1/012021
[45] Mualifah, L.N.A., Abadi, A.M. (2019). Optimizing the traffic control system of Sultan Agung Street Yogyakarta using fuzzy logic controller. Journal of Physics: Conference Series, IOP Publishing, 1320: 012028. https://doi.org/10.1088/1742-6596/1320/1/012028
[46] Wu, Y., Lu, J., Chen, H., Yang, H. (2015). Development of an optimization traffic signal cycle length model for signalized intersections in China. Mathematical Problems in Engineering, 2015(1): 954295. https://doi.org/10.1155/2015/954295
[47] Lamghari Elidrissi, H., Nait Sidi Moh, A., Tajer, A. (2024). Modular design and adaptive control of urban signalized intersections systems using synchronized timed Petri nets. Personal and Ubiquitous Computing, 1-15. https://doi.org/10.1007/s00779-024-01797-6
[48] Raveendran, B., Mathew, T.V., Velaga, N.R. (2020). A heuristic adaptive traffic control algorithm for signalized intersections. In 2020 International Conference on COMmunication Systems & NETworkS (COMSNETS), Bengaluru, India, pp. 82-86. https://doi.org/10.1109/COMSNETS48256.2020.9027325
[49] Elidrissi, H.L., Tajer, A., Nait-Sidi-Moh, A., Dakkak, B. (2019). A SUMO-based simulation for adaptive control of urban signalized intersection using petri nets. In 2019 4th World Conference on Complex Systems (WCCS), Ouarzazate, Morocco, pp. 1-6. https://doi.org/10.1109/ICoCS.2019.8930774
[50] Madrigal Arteaga, V.M., Pérez Cruz, J.R., Hurtado-Beltrán, A., Trumpold, J. (2022). Efficient intersection management based on an adaptive fuzzy-logic traffic signal. Applied Sciences, 12(12): 6024. https://doi.org/10.3390/app12126024
[51] Joo, H., Ahmed, S.H., Lim, Y. (2020). Traffic signal control for smart cities using reinforcement learning. Computer Communications, 154: 324-330. https://doi.org/10.1016/j.comcom.2020.03.005
[52] Yalcinli, F., Akdemir, B., Durdu, A. (2024). Adaptive traffic management model for signalised intersections. Elektronika Ir Elektrotechnika, 30(3): 72-82. https://doi.org/10.5755/j02.eie.36536
[53] Banerjee, T., Chen, K., Huang, X., Rangarajan, A., Ranka, S. (2019). A multi-sensor system for traffic analysis at smart intersections. In 2019 Twelfth International Conference on Contemporary Computing (IC3), Noida, India, pp. 1-6. https://doi.org/10.1109/IC3.2019.8844934