Ahmed Elaraby![]() | Hela Elmannai*
| Hela Elmannai*![]() | Reem Ibrahim Alkanhel
| Reem Ibrahim Alkanhel![]() | Ahad Fahd Basaqr
| Ahad Fahd Basaqr![]()
© 2025 The authors. This article is published by IIETA and is licensed under the CC BY 4.0 license (http://creativecommons.org/licenses/by/4.0/).
OPEN ACCESS
Real-world applications benefit greatly from aerial imagery. Various modern applications utilizing aerial images; however, these images are often low-contrast due to imperfect atmospheric conditions and limitations in the imaging systems. Many methods exist to enhance the quality of aerial images, yet not all of them capable of producing desired results. Some may have high complexity, and others may require numerous inputs. On the other hand, it is observed that a low-contrast impact that is difficult to prevent throughout the data collection process degrades the quality of aerial images a lot. As a result, in this paper a novel method for improving aerial image contrast has been presented. Hence a two-phase approach for increasing contrast and remapping the intensities of an aerial image to its native dynamic range has been presented in this paper. Additionally, a regularization technique is provided using the two-step regularization and mapping procedures. For image quality assessment (IQA), two performance assessment metrics; measure of enhancement (EME) and Structural SIMilarity (SSIM) have been suggested to measure the quality of the results of the proposed algorithm. The experimental results indicate that the proposed approach increases the contrast of aerial image substantially as compared with other widely contrast enhancement methods.
aerial imaging, image enhancement, contrast enhancement, remote sensing, image processing
The images captured from the air using cameras mounted on drones, balloons, kites, and airplanes for the purpose of remote sensing are termed aerial images. Aerial images have very useful applications however these images are often low-contrast due to imperfect atmospheric conditions and limitations in the imaging systems. Hence in this paper, we discuss ways for improving the aerial image quality.
Aerial image restoration framework (IFAIR) was developed for ordinary images and subsequently used in aerial photographs. They fall into the category: dynamic fuzzy histogram equalization with brightness preservation (BPDFHE) [1], ESIAHE (exposure-based sub-image histogram equalization), MMSICHE (median-mean based sub-image clipped histogram equalization) [2], histogram equalization with maximum intensity coverage (HEMIC) [3], and histogram specification approach (HSA) [4].
For real-world applications, the quality of aerial images is critical. Although there are several strategies for improving the quality of aerial images, not all of them can give outcomes with high accuracy. Some may be quite sophisticated, while others may need many inputs. As a result, a novel method is suggested, which combines a two-phase strategy for boosting contrast and remapping the intensities of aerial images to their natural dynamic range, as well as a two-step regularization technique based on the two-step regularization and mapping processes. The suggested approach automatically improves the quality of aerial photographs to a satisfactory level.
In the study by Lee et al. [5], a wavelet-based method that improves contrast nonlinearly was developed. There were three steps to this algorithm. The first and last phases were carried out in the spatial domain, while the second stage was carried out in the discrete wavelet domain. The initial stage entailed implementing histogram adjustments based on human visual behavior. The second stage in the wavelet domain involved local contrast correction and dynamic range compression. While, the last stage involves using a special color restoration procedure to enhance the hues of the final image. Singh et al. [6] proposed an enhancement method based on the ideas of singular value decomposition (SVD) and discrete wavelet transform (DWT). The DWT decomposes the supplied image into four frequency sub-bands, which is the first step in this method. Next, an estimate of the singular value matrix was produced at the low-low sub-band. Finally, the image sub-bands were reconstructed, and the final image was created using an inverse DWT.
Furthermore, Samanta et al. [7] presented an integrated improvement framework with three phases. The first stage calculated the mean intensity for each color channel using a color balancing approach. The second phase involved employing shift and scale operations to achieve saturation improvement. The final stage involved applying contrast enhancement based on the information provided by the identified edges. The outcome was determined by the output produced from this stage. For global contrast enhancement, Wong et al. [8] developed a method that used a regularized histogram version. Regularization was done by deriving a distribution function from the sigmoid function and histogram characteristics, which could then be utilized to generate a globally improved image using a particular lookup table. The discrete cosine transform coefficients for the globally improved image were then fine-tuned automatically to upgrade the image’s local features. The fuzzy histogram of the input image is used to begin a fuzzy-based technique [9]. The proposed method addresses the challenge of contrast enhancement in images with poor contrast by introducing an automatic two-stage process for enhancing natural color images. In the first stage, the lightness component in the YIQ color space is normalized using a sigmoid function after applying adaptive histogram equalization to the Y component. The second stage employs an automatic color contrast enhancement algorithm on the output from the first stage. The algorithm has been tested on various NASA color images and hyperspectral images, showing superior performance compared to existing methods [10].
Liu et al. [11] introduced an enhanced multi-scale Retinex (MSR) method for improving aerial images suffering from low visibility. Traditional MSR typically uses three scales, which limits its versatility. The authors propose an MSR approach that incorporates more than three scales to provide a more general enhancement method. They present a new explicit multi-scale representation that effectively balances image contrast and color consistency. Additionally, a histogram truncation technique is introduced for post-processing to remap the MSR output to the display's dynamic range.
Saha et al. [12] presented a novel approach for enhancing the contrast of digital images using the Dragonfly Algorithm (DA). By treating image contrast enhancement as an optimization problem, we effectively mapped the grey-level intensity values of input images to new values that significantly improved visual quality. Our experimental results, based on a dataset of 24 grey-scale images from the Kodak collection, demonstrated the efficacy of the DA in producing high-quality images with improved Peak Signal-to-Noise Ratio (PSNR), Visual Information Fidelity (VIF), and Structural SIMilarity Index Measure (SSIM) values of 30.87, 0.7451, and 0.9523, respectively. Furthermore, the ablation study provided insights into the impact of various control parameters on image quality, revealing that careful tuning is essential for optimal outcomes. Our comparisons with state-of-the-art techniques confirmed the superiority of the proposed DA-based method in enhancing image contrast. Another technique for enhancing low-contrast grayscale images was introduced by Rahman and Paul [13]. This method involves dividing the image into three sub-images to maintain the mean brightness. To manage contrast enhancement, a snipping procedure is applied to each histogram. Each of the three histograms is equalized separately, and then the resulting sub-images are merged into a single image. The performance of this proposed technique outperforms traditional histogram equalization methods found in the literature across various image quality metrics. Zhang et al. [14] introduced a color correction and adaptive contrast enhancement algorithm specifically for underwater images. Initially, they developed dedicated fractions to address the deficiencies in lower color channels. The algorithm was then applied to each color channel, resulting in background-stretched and foreground-stretched images. The contrast of the final output image was significantly enhanced by combining these two types of images. Meanwhile, Mukhopadhyay et al. [15] proposed a new grayscale contrast enhancement algorithm that does not rely on tuning the controlling parameters of the Incomplete Beta Function; instead, these parameters are computed using the Artificial Electric Field Algorithm to find near-optimal values.
The illumination characteristics were then obtained, and the association between normal and low illumination was determined using a deep decomposition network and end-to-end training. Finally, the result was obtained using a deep improvement network. As can be seen from the methods examined, several approaches to have been used to enhance contrast. The most difficult are those involving DL due to their high computational cost and the numerous variables involved, which are difficult to estimate accurately by the average user.
Nonetheless, the odds of enhancing or developing new algorithms for aerial image augmentation are considerable, and the possibility of doing so is still open. As a result, based on a combination of various processing ideas of the S-curve mapping functions, logarithmic image processing, and normalization, this study offers a novel, completely automated multi-concept technique to increase the contrast of aerial images. For contrast enhancement, in the study by Demirel et al. [16], various S-curve functions can be employed. The pixel values of a particular image are adjusted using S-curve functions according to the X and Y connection provided by the function [17]. Furthermore, Talebi and Milanfar [18] demonstrated multiple S-curve functions, whereas a basic function may not be universally applicable to all image types. Furthermore, a single function may not be sufficient for adequate contrast augmentation. As a result, numerous S-curve functions can be combined to produce outcomes with improved tonality. In addition, logarithmic image processing (LIP) techniques are widely employed in contrast enhancement, as demonstrated in the study by Sheet et al. [19]. Similarly, Singh and Kapoor [20] demonstrated that various LIP techniques can effectively fuse features from two images to produce an enhanced-quality output. Normalization is another systematic approach for fitting image intensities to the standard dynamic range.
Our two-phase approach enhances aerial image contrast through a combination of computational simplicity, adaptability, and superior enhancement quality. Unlike traditional methods such as Histogram Equalization (HE) and Contrast Limited Adaptive Histogram Equalization (CLAHE), our method requires fewer computational resources, making it more efficient for real-time applications. Additionally, it is designed to adapt seamlessly to various image types, effectively handling diverse aerial imagery scenarios, from urban landscapes to natural terrains. In terms of enhancement quality, our approach demonstrates a significant improvement in preserving essential details and reducing artifacts, as evidenced by our quantitative and qualitative evaluations compared to widely used techniques.
Several studies in the domain of aerial images and applications, deal with images taken in uncontrolled environments. Min et al. [21] suggested "Dynamic Pixel Intensity Histogram Analysis (DHAs)" which utilized to improve the clarity and usefulness of photos taken in foggy situations. There is an urgent need to assess and compare the many image DHAs now available. Real hazy photos are used to assess DHAs since there is no reference haze-free image. However, the reference haze-free images and full reference (FR) IQA processes may be used to evaluate hazy synthetic images quantitatively. The DHA assessment in this article is performed by applying this technique to hazy synthetic images. The authors have created a synthetic haze removal quality (SHRQ) to get started. Dazed images created from 45 and 30 artificially foggy shots created 360 and 240 aerial and normal image subsets. Because aerial photography is a significant application area, they created a subset of aerial images. A subjective quality assessment study is conducted on the two subgroups. They suggested that DHA assessment should not be seen as an accurate Full reference (FR) IQA procedure, and current FR IQA methods are ineffective for evaluating DHA. This technique for evaluating DHA quality incorporates several dehazing-relevant aspects, such as image structure recovery and color reproduction, and the over-enhancement of low-contrast regions, into the assessment process [22]. As a result, they have improved their approach for aerial photos by putting their unique qualities into it. Results from two synthetic haze removing quality (SHRQ) dataset subsets show that the recommended measures are effective.
Wang et al. [23] developed an image enhancement approach to improve low-illumination image quality for dependable unmanned aerial vehicle (UAV) pedestrian identification. A hyperbolic tangent curve is used to map the image brightness to a comfortable level. For YCbCr color filters, block-matching and 3-D filtering algorithms are in the pipeline. A convolutional neural network model is used to identify pedestrians for surveillance purposes. With an increase in Minkowski distance measurement accuracy of 0.80%, F-measure and confidence coefficient detection accuracy increased by 0.800%. Night-time UAV surveillance in smart cities could be improved using this technique. Pham et al. [24] proposed a fast adaptive stitching approach for dealing with many aerial photographs. Firstly, the geotag information of the UAV image footprints is used to assess their relative locations and overlapping areas. Analyzed images are suggested to be eliminated from the UAV photos using an adaptive selection technique. Fast feature extraction and matching are performed successively in the suggested technique. It is finally developed to lessen the blurring artifacts and produce precise image alignment with seamless overlapping areas. Images of huge regions may be created using various methods, including experiments. As a result, both the predicted reprojection error and the number of observed visual distortions may be reduced by using this proposed method.
Kim et al. [25] presented Infrared Detection and Tracking. It is possible to monitor distant targets using infrared search and track (IRST) systems on unmanned aerial aircraft and battleships. Several IRST systems utilize contrast enhancement (CE) techniques to compensate for the limited dynamic range of sensor output and visual saturation. Infrared Image histogram equalization may cause saturation and enlargement of the low contrast histogram. Local area processing has been studied to decrease saturation and non-uniformity. Cross fusion is combined with three counter-non-uniformity approaches to boost adaptive contrast. Discrete entropy, PSNR, SSIM, root-mean-square error (RMSE), and computation time metrics were also examined as part of this evaluation. Images of different commodities from infrared and multispectral satellites and ordinary grayscale and color Images and video sequences were used in the experiments. The integrated image quality index shows that the suggested approach performs well on many degraded datasets. Megahed et al. [26] investigated a general registration method based on a computer model and a scene abstraction. It is possible to augment 3-D light detection and range points with radiometric information by registering aerial photos. Data from an aircraft’s LiDAR systems differ from photos collected aboard the same flight. It is possible to use indirect georeferencing if additional imaging data is available. However, in LiDAR and imaging datasets, automated detection of control primitives is a challenge, particularly if they were gathered at various times. Image moment values may be thresholded for potential candidate site identification. Control points are generated using a shape context description that pairs symmetric candidate points. Polynomial and direct linear transform models were used to estimate the coordinate transformation parameters across datasets. Different datasets from various metropolitan areas have been used to test the technique provided in this paper [27]. The root-mean-square error ranges between one and two pixels in terms of registration. With modest datasets, the suggested method is computationally efficient and versatile enough to be applied to a wide range of images and Light Detection and Ranging (LiDAR) point cloud registrations.
Gao et al. [28] envisioned UAV Sensing Image Defogging Method. Unmanned aerial vehicle imaging is susceptible to haze, which reduces the quality of the needed remote sensing Images. Analyzing and processing the impact will be very difficult in the future. However, there are a few drawbacks due to its considerable progress, such as color distortion and lesser brightness in the defogging mage. New defogging techniques are presented in this article to address these disadvantages. Atmospheric scattering models are developed that use an adaptive variable technique to characterize atmospheric light better. An entirely new approach to ambient light and transmittance estimations is offered based on both dark and bright channels. Our next step is to use the color image as a guide to fine-tune the transmittance, which reduces time complexity even more. They have developed a new compensating mechanism to address the problem of poor transmittance and minimize color smearing [29]. In addition, a simple and effective approach for calculating compensation function parameters is provided. Finally, an enhanced air scattering model establishes the clear remote sensing image. Some real-world datasets show that the suggested technique is better in subjective and objective quality assessments than existing best practices.
Using an enhanced haze optical model, Peng et al. [30] developed a unique image processing system with three modules: Airlight White Correction (AWC), Local Light Filter (LLF), and Aerial Perspective Prior (APP). When the airborne particles are dispersed and taken up, color distortion may occur when photographing in low-light settings like sandstorms or fog. Using AWC, you can identify and repair any color casts in your images. Improved ambient light estimation is achieved by deleting non-hazy bright pixels from the image using LLF (such as headlights and white objects). This method calculates scene transmission by subtracting the minimum and maximum channel values. In independent third-party dehazing tests, the proposed method beats the present state of the art. When it comes to color restoration, we offer the most effective method for eliminating haze and color casts.
GAN with Dual-Stream Representation Learning GAN was suggested by Xi et al. [31] to categorize UAV photos. Ultralow resolution (LR) UAV-based remote sensing photos are difficult to recognize little items because of the lack of data in the object areas. Attempts to address this problem have been few and far between in recent times. Image classification aims to improve Image quality and representations that are presently missing. LR image classification performance improvement is substantially impacted by irregularity in information loss and learning priority for low-frequency and high-frequency components. An important presumption of this writer’s research is using images with a high resolution for both low and high-frequency (LF/HF) component monitoring (HR). GANs for LR image classification have been tested for DRL-ability using their technique. Our DRL-GAN has been demonstrated to improve classification performance by up to 10% compared to prior research from HRSC and CIFAR-10. This can be seen in the "WIDERSHIP" dataset.
Nomani et al. [32] proposed new approaches to approximation adder design that increase SWaP performance while maintaining acceptable accuracy requirements for FPGA-based systems. For years, intelligence, surveillance, and reconnaissance (ISR) systems have been using HD image processing and real-time analytics. The computing demands on HD ISR systems are expanding rapidly with optics and Image augmentation improvements. Moore’s Law has been slowing down recently, significantly constraining the amount of shrinkage that CPUs and storage units can now achieve. Programmable and quick prototyping FPGAs are intriguing for implementing ISR algorithms in unmanned aerial vehicles (UAVs) with few resources. FPGA applications that need a lot of processing power necessitate accurate calculations to bridge the gap between the host system and the FPGA It is possible to speed up video and image processing without compromising accuracy. Customizable overlap between sub-adders in the carry chain ensures optimal accuracy and overall latency of a single LUT. For balancing SWaP and accuracy, this site says it has a wide range of alternatives to select from. In this study, the applicability of atomic arithmetic blocks is tested using analytical applications such as two-dimensional DCT, aerial self-localization, and moving object tracking. Zhang et al. [33] postulated a technique for identifying conductor breaks and surface flaws in transmission lines using unmanned aerial vehicle (UAV) inspection. If the aluminum strands break, there will be permanent damage to conductors and whole transmission lines, leading to power outages and other significant consequences discussed. Once a conductor Image has been captured, the conductor area is retrieved using an adaptive threshold segmentation approach, which normalizes the grey variance of an image (GVN). The grayscale distribution curves’ square wave transformation (SWT) is a basic and effective method for detecting a conductor break. The GVN Image of the conductor area is used to identify the conductor surface flaws. Several broken strands are counted to filter out the possible problems, and the final fault diagnostic findings may then be determined. A series of tests are used to evaluate the technology’s performance. The findings show that the suggested approach has an average accuracy of 90.45 % for measuring conductor break and 92.05 % for measuring defective surface faults.
The proposed method effectively addresses the computational complexity associated with deep learning approaches by employing a two-phase enhancement strategy that prioritizes efficiency without sacrificing quality. Unlike traditional histogram equalization (HE), which often leads to over-enhancement and loss of detail, this method allows for controlled adjustments that preserve essential image features. By integrating adaptability to various image types, the proposed approach outperforms existing techniques in terms of both computational simplicity and enhancement quality. This relevance highlights the need for methods that balance performance with practicality, particularly in real-world aerial imaging applications.
The contrast equalization method has been proposed as a processing step [34]. Its major objective was to precisely rescale the intensities of images to provide the processed images with adequate brightness and contrast. The insufficient image intensities are first regularized using a two-step procedure, and Eq. (1) and Eq. (2) are used to accomplish this operation.
$k(x, y)=\frac{I(x, y)}{\left(\operatorname{mean}\left(\left|I\left(x^{\prime}, y^{\prime}\right)\right|^a\right)\right)^{1 / a}}$ (1)
$L(x, y)=\frac{k(x, y)}{\left(\operatorname{mean}\left(\min \left(\beta,\left|k\left(x^{\prime}, y^{\prime}\right)\right|^a\right)\right)^{1 / a}\right.}$ (2)
where, $I(x, y)$ is the degraded input image, $x$ and $y$ are spatial coordinates, and $I\left(x^{\prime}, y^{\prime}\right)$ is the transposed form of $I(x, y)$. The image $k(x, y)$ is the result of the first regularization stage. The transposed form image $k(x, y)$ is $k\left(x^{\prime}, y^{\prime}\right)$; $L(x, y)$ is the outcome of the second regularization step. High values are reduced by a compressive exponent, while a threshold is set at which high values are truncated after the first step of regularization. The default values for $\alpha$ and $\beta$ are $\alpha=0.1$ and $\beta=10$. The two-step regularization produces an acceptable scale yet still allows for extreme values. As a result, a nonlinear mapping function based on hyperbolic tangents is used to reduce the impact of such extreme values, resulting in outcomes with appropriate brightness and contrast. Eq. (3) is used to calculate this value.
$w(x, y)=\beta \tanh \left(\frac{L(x, y)}{\beta}\right)$ (3)
where, $w(x, y)$ denotes the final image. This method was realistic to numerous aerial images, it revealed numerous drawbacks. First, the default settings will result in a completely black image and therefore cannot be used. Second, due to the varied nature of aerial images, these parameters need to be updated for each processed image. This process is time-consuming since determining the right $\alpha$ and $\beta$ values for each input data. Furthermore, despite providing considerable contrast enhancement, this approach still raises the brightness of the overall image. Furthermore, it enhances the brightness in high-brightness locations, resulting in the loss of essential visual information. Improved techniques suited to the nature of aerial images are required for this approach to provide satisfactory results. Experimentally, this adjustment provides users with greater control over the boosting process. The outcome is altered in the two-step regularisation method when a single parameter is employed. When the two-step mapping method is used, the output is re-adjusted to offer the proper brightness and contrast. This parameter must meet ($\mu$ > 0) to adjust brightness and contrast, where value improves contrast and regularizes brightness. A lower number results in less-than-ideal brightness and contrast. After using a given number and seeing a little improvement, the value must be raised until acceptable results are achieved. The operator must perform this task manually. Eq. (4) and Eq. (5) are used to calculate the improved two-step regularization method.
$k(x, y)=\frac{I(x, y)}{\left(\operatorname{mean}\left(\left|I\left(x^{\prime}, y^{\prime}\right)\right|^\mu\right)\right)^{1 / \mu}}$ (4)
$L(x, y)=\frac{k(x, y)}{\left(\operatorname{mean}\left(\min \left(\mu,\left|k\left(x^{\prime}, y^{\prime}\right)\right|^\mu\right)\right)\right)^{1 / \mu}}$ (5)
Nonlinear and linear remapping techniques are used to achieve this goal instead of relying on Eq. (3) to reduce too large values in the regular image. The modified standard logistic function (MSLF), a nonlinear function, is used in the first phase. The conventional standard logistic function (CSLF) is computed using Eq. (6) [35].
$G(x, y)=\frac{\exp (L(x, y))}{1+\exp (L(x, y))}$ (6)
where, $G(x, y)$ does the CSLF produce the image. An MSLF is employed in this investigation to give the researcher better control over the apparent brightness and contrast. As seen in Eq. (7), the adjustment entails boosting the CSLF to the power of $\mu$.
$\hat{\mathrm{G}}(x, y)=\left(\frac{\exp (L(x, y))}{1+\exp (L(x, y))}\right)^\mu$ (7)
where, $\hat{\mathrm{G}}(x, y)$ is the image produced by the MSLF. Image contrast has been altered and extreme values have been toned down because of this feature.
Gamma correction can be applied on Eq. (8) as follows:
$\hat{G}=\mathrm{A} \hat{G}_{\mathrm{i}}^\gamma$ (8)
where, A and $\gamma$ are positive constants, $\hat{G}_{\mathrm{i}}^\gamma$ is the non-negative real input value and $\hat{G}$ is the modified conventional standard logistic function. With $0<\gamma<1$ and gamma correction, several modification levels can be done, and the histogram spikes can be efficiently smoothed.
The modification scheme can be written as follows using Eq. (9):
$\widehat{G}(x, y)=A\left(\left(\frac{\exp (L(x, y))}{1+\exp (L(x, y))}\right)^\mu\right)^\gamma$ (9)
In the newly suggested two-step mapping technique, this is the second stage. Eq. (9) is used to remap the intensity values of the original image across a wider dynamic range. Eq. (10) can be utilized in the following manner [36]:
$N(x, y)=\frac{\hat{G}(x, y)-\min (\hat{G}(x, y))}{\max (\hat{G}(x, y))-\min (\hat{G}(x, y))}$ (10)
where, $N(x, y)$ does proposed technique produce final image.
This section reports the results of the achieved experiments and comparisons with different types of low-contrast aerial images. The aim was to deliver the required discussions regarding the findings of this research. Low-contrast images have been used to evaluate the proposed algorithm's processing skills utilizing a publicly accessible dataset [37]. This dataset consisted images that’s widely used in image processing task. Selected aerial Images representative of different environmental conditions.
In addition, well-known contrast enhancement algorithms HE and CLAHE were used in the comparison process. “Histogram Equalization (HE)” is an image processing technique in computer science that enhances the contrast in images. It achieves this by distributing the most common intensity values, which extends the intensity range of the image. Typically, this technique heightens the overall contrast of images in situations where the usable data is depicted by nearby contrast values. Consequently, it enables regions with lower local contrast to obtain a greater contrast. “Contrast limited adaptive histogram equalization (CLAHE)” is used for improve the visibility level of foggy image or video. MATLAB 2018a and a machine with 8 GB of RAM and a 2.8 GHz Intel Core-i5 CPU have been used to construct the suggested comparison methods. IQA measures have been used. EME and SSIM are the IQA measures employed to assess the suggested approach's image quality. Adopting the acronym EME, Agaian et al. [38] will be the first to propose this concept. Fechner's Law, which links contrast to perceived brightness, provides a score to each image. The "EME" is:
$E M E(e)=\frac{1}{k_1 k_2} \sum_{l=1}^{k_2} \sum_{k=1}^{k_1} 20 \ln \left(\frac{I_{\text {max}, k, l}^W}{I_{\text {min}, k, l}^W}\right)$ (11)
where, $I_{\min ; k, l}^w$ and $I_{\text {max }, k, l}^w$ are respectively minimum and maximum of the image $X(n, m)$ inside the block $w_{k, l}$.
SSIM was developed by Wang et al. [39]. It is a methodology for quality evaluation based on the deterioration of structural information under the premise that human visual perception is well suited to collecting structural information from a scene. SSIM is defined as the following:
$E M E(e)=\frac{1}{k_1 k_2} \sum_{l=1}^{k_2} \sum_{k=1}^{k_1} 20 \ln \left(\frac{I_{\max , k, l}^W}{I_{\min , k, l}^W}\right)$ (12)
where, $\mu_x$ and $\mu_y$ are the local means, $\sigma_x$ and $\sigma_y$ are the standard deviations and $\sigma_{x y}$ is the cross-covariance for images $x$ and $y$ sequentially, $c_1$ and $c_2$ two variables to stabilize the division with a weak denominator.
Table 1. Comparison of IQA scores for EME
|
Image |
Proposed |
HE |
CLAHE |
|
1 |
24.3919 |
104.4621 |
62.8726 |
|
2 |
32.0498 |
140.0044 |
90.1145 |
|
3 |
39.4326 |
145.9599 |
117.1302 |
|
4 |
41.5525 |
146.5350 |
137.8118 |
|
5 |
41.1482 |
147.0174 |
123.8849 |
|
6 |
31.7376 |
121.0559 |
77.2641 |
|
7 |
33.2997 |
142.2255 |
90.0648 |
|
8 |
33.5473 |
135.4575 |
88.4845 |
|
9 |
38.9503 |
146.0272 |
124.6939 |
|
10 |
29.0535 |
121.1223 |
102.9055 |
|
Average |
34.5163 |
134.987 |
101.523 |
Table 2. Comparison of IQA Scores for SSIM
|
Image |
Proposed |
HE |
CLAHE |
|
1 |
0.9486 |
0.3667 |
0.6744 |
|
2 |
0.8260 |
0.5997 |
0.7158 |
|
3 |
0.9040 |
0.8136 |
0.7641 |
|
4 |
0.8460 |
0.7979 |
0.7864 |
|
5 |
0.8430 |
0.8263 |
0.7347 |
|
6 |
0.9061 |
0.7328 |
0.7222 |
|
7 |
0.8664 |
0.6990 |
0.7107 |
|
8 |
0.9403 |
0.7531 |
0.7711 |
|
9 |
0.8966 |
0.8716 |
0.8146 |
|
10 |
0.9124 |
0.8704 |
0.7878 |
|
Average |
0.88894 |
0.73311 |
0.74818 |
In EME, a lower score indicates an image with better contrast, while in SSIM, a higher score indicates better contrast. Table 1 and Table 2 present the EME scores and SSIM measures between original and enhanced images for the proposed algorithm, HE and CLAHE, for the aerial images used in the experiment. The proposed approach obtained the highest EME score and the lowest SSIM score for all ten images. This indicates that the proposed approach outperforms HE and CLAHE for both IQA metrics. The scores also mean that the proposed approach produces images of better quality than that of HE and CLAHE.
Figure 1. Illustrations of image 1: (a) Original woods image, (b) Proposed approach result, (c) HE approach result, and (d) CLAHE approach result
Figure 2. Illustrations of image 2: (a) Original series image, (b) Proposed approach result, (c) HE approach result, and (d) CLAHE approach result
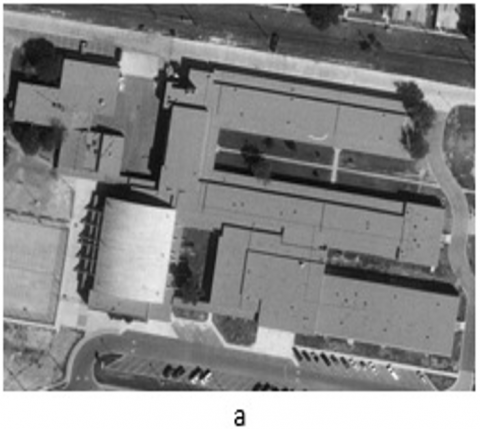
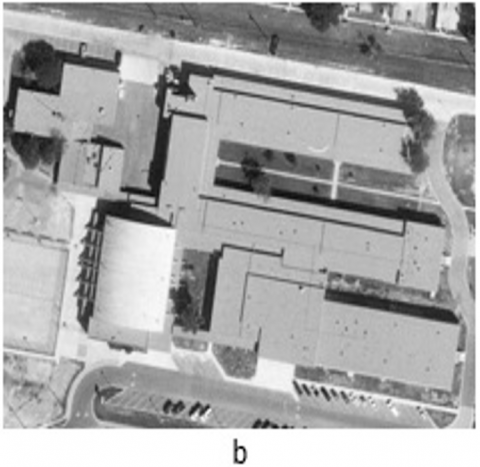
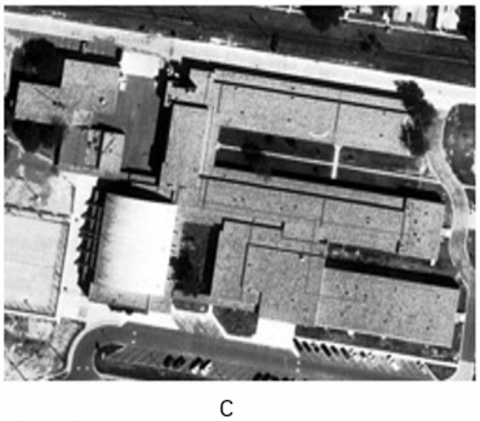
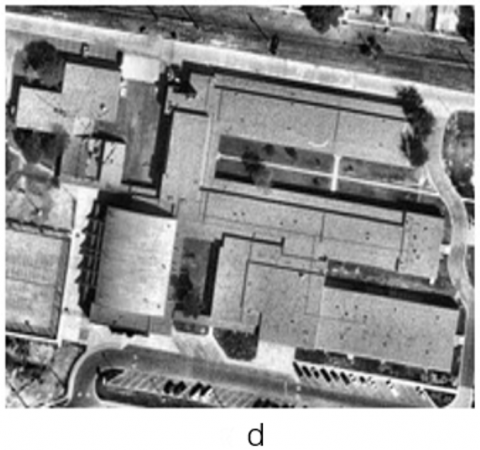
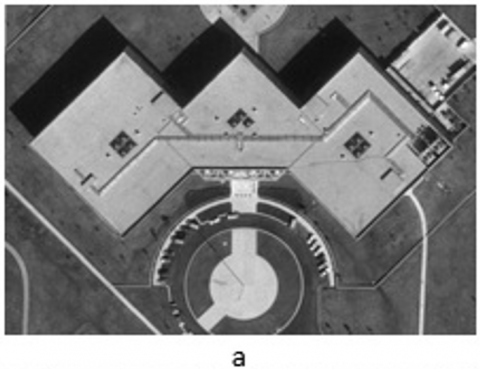
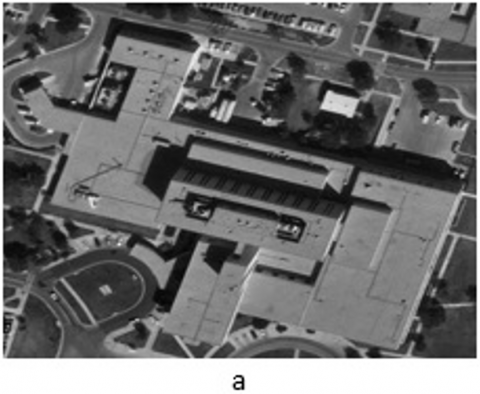
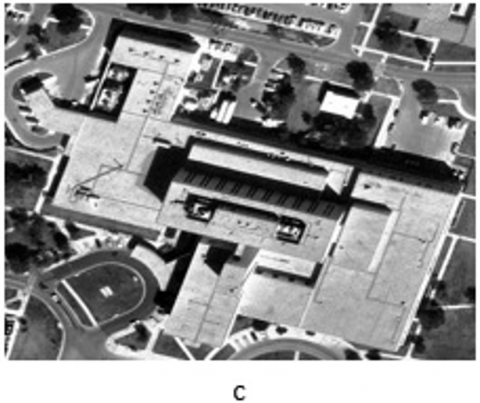
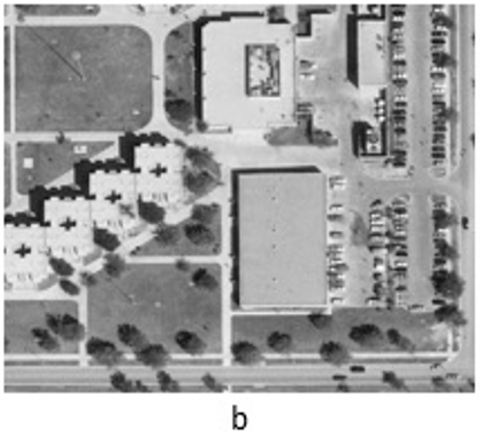
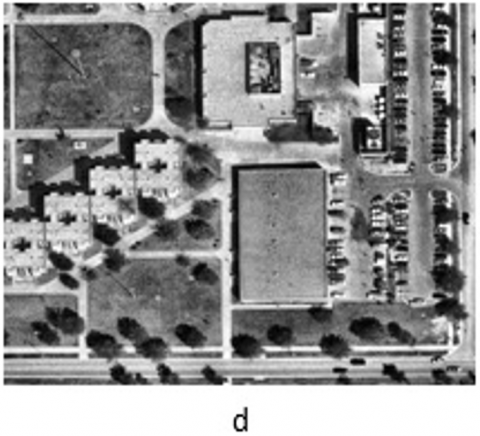
Figure 3. Illustrations of image 3: (a) Original school image, (b) Proposed approach result, (c) HE approach result, and (d) CLAHE approach result
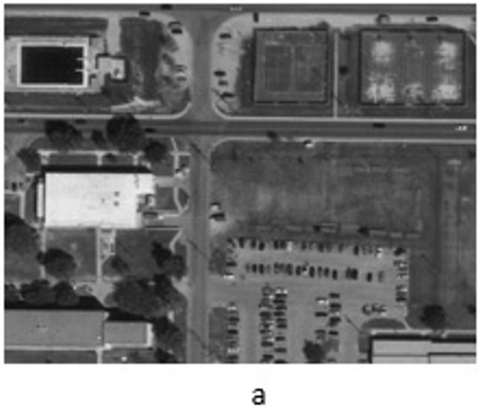
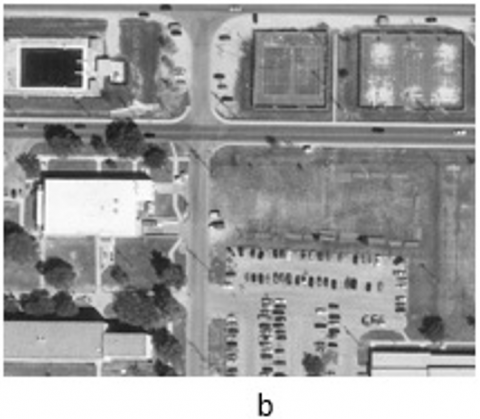
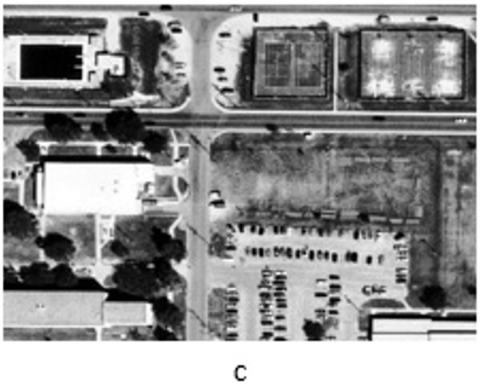
Figure 4. Illustrations of image 4: (a) Original pool tennis image, (b) Proposed approach result, (c) HE approach result, and (d) CLAHE approach result
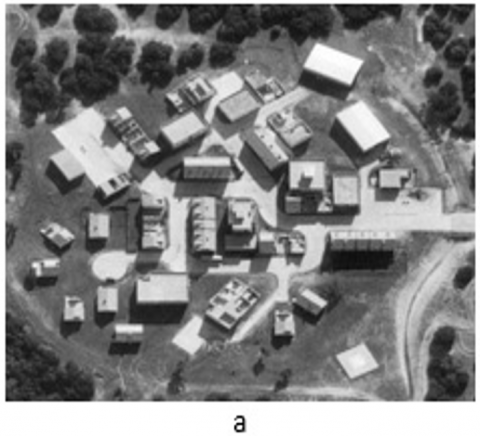
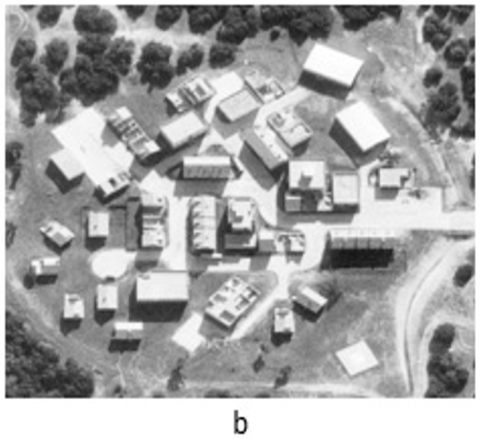
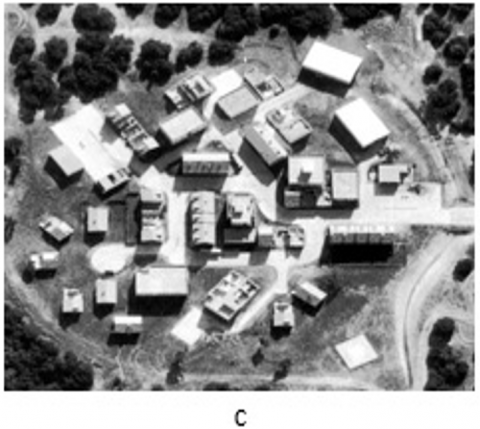
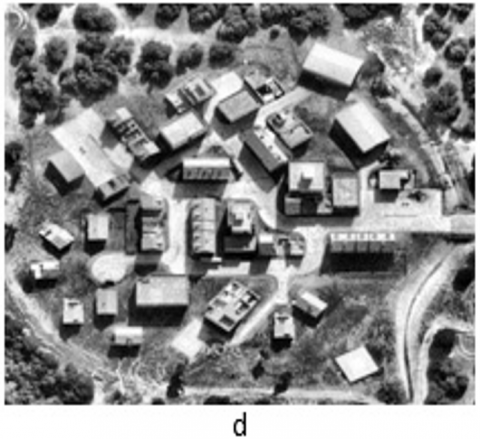
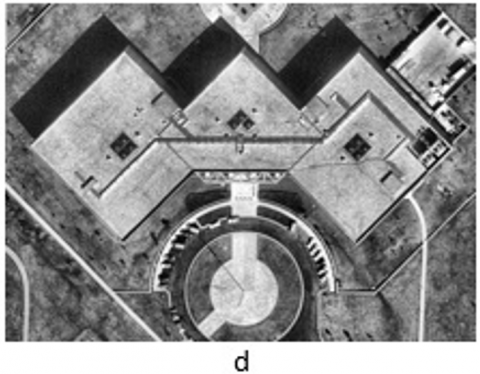
Figure 5. Illustrations of image 5: (a) Original main building image, (b) Proposed approach result, (c) HE approach result, and (d) CLAHE approach result
Figure 6. Illustrations of image 6: (a) Original large building image, (b) Proposed approach result, (c) HE approach result, and (d) CLAHE approach result
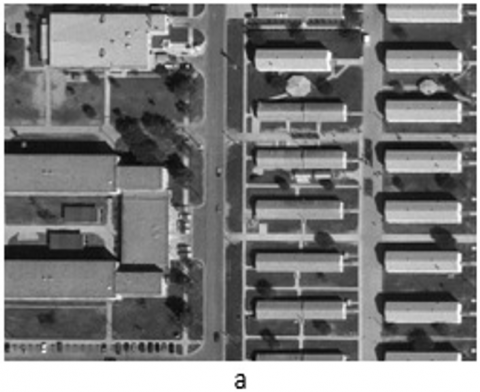
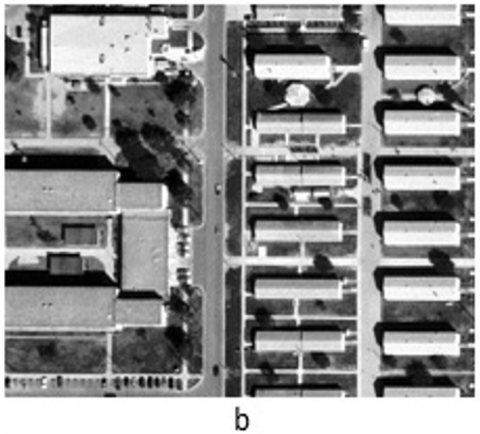
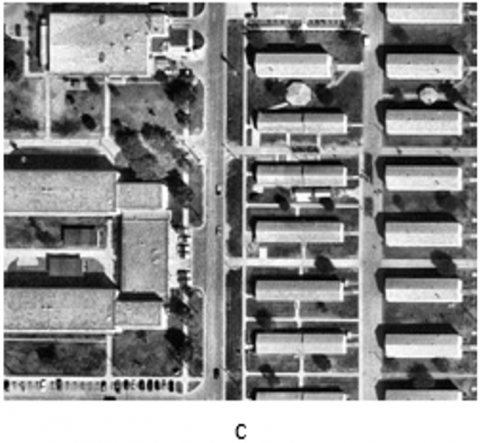
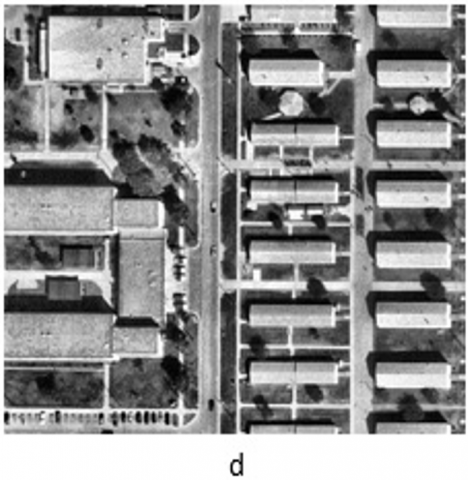
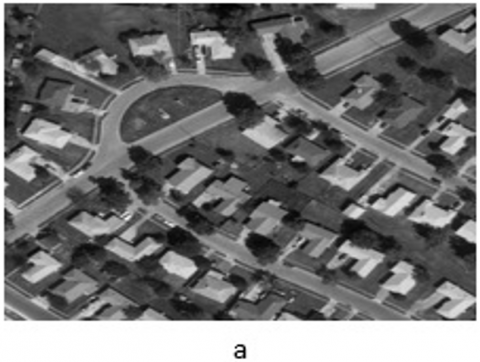
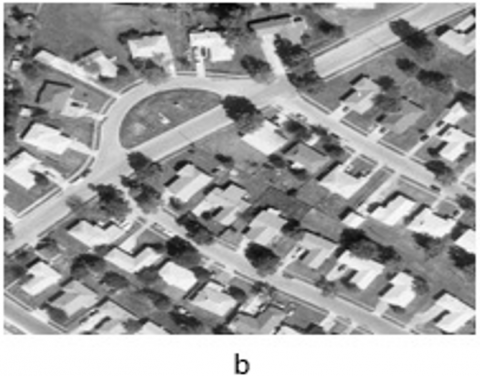
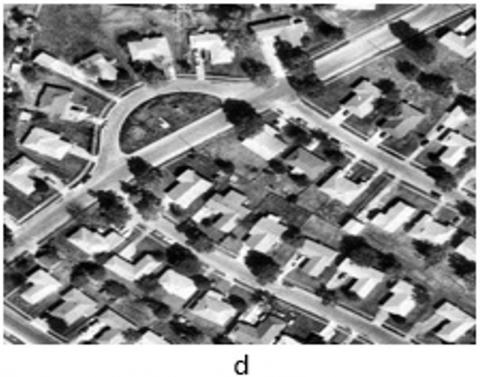
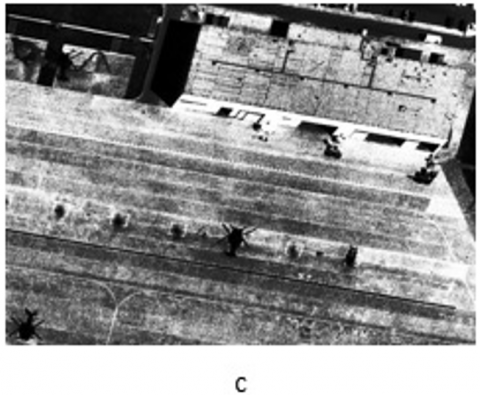
Figure 7. Illustrations of image 7: (a) Original homes image, (b) Proposed approach result, (c) HE approach result, and (d) CLAHE approach result
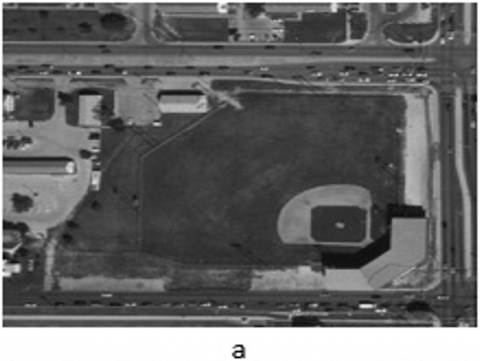
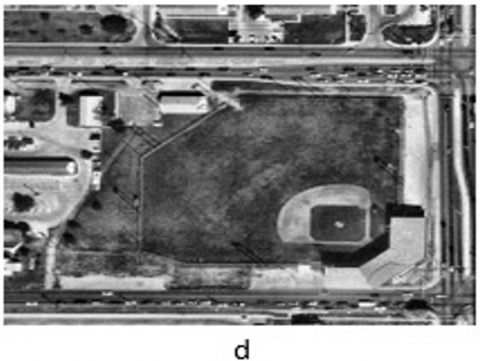
Figure 8. Illustrations of image 8: (a) Original baseball image, (b) Proposed approach result, (c) HE approach result, and (d) CLAHE approach result
Figure 9. Illustrations of image 9: (a) Original buildings image, (b) Proposed approach result, (c) HE approach result, and (d) CLAHE approach result
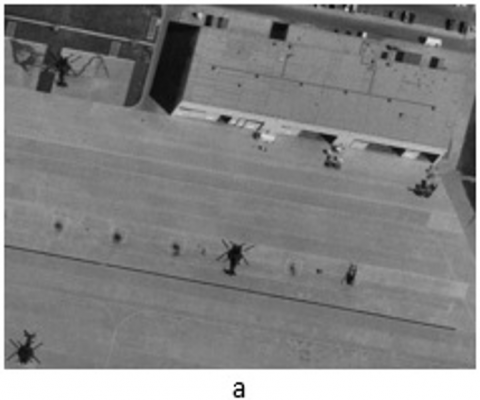
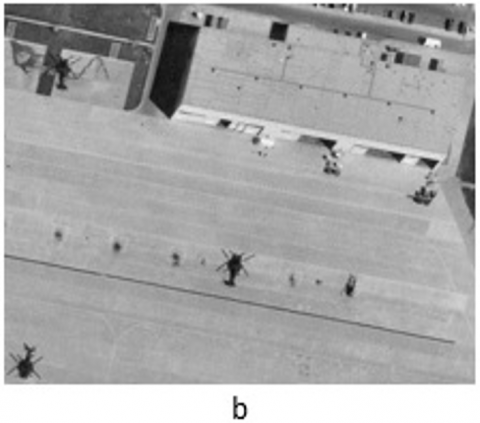
Figure 10. Illustrations of image 10: (a) Original airfield image, (b) Proposed approach result, (c) HE approach result, and (d) CLAHE approach result
Figures 1–10 illustrate ten original images (subfigure (a) in each figure) and their processed outputs using the proposed approach (subfigure (b)), HE (subfigure (c)), and CLAHE (subfigure (d)), respectively. Compared to the original images in subfigure (a), the outputs in subfigure (b) are brighter, exhibit higher contrast, and better preserve details, while also containing less noise. Moreover, the proposed approach (subfigure (b)) produces results with better contrast and detail preservation than those generated by HE (subfigure (c)) and CLAHE (subfigure (d)). The modified conventional standard logistic function, as defined in Eq. (9), combined with gamma correction, allows for adjustable modification levels. Additionally, the histogram spikes are effectively smoothed, as demonstrated in subfigures (b)-(d) of Figures 1–10.
The proposed method, while effective in enhancing aerial image contrast, does face certain limitations. Specifically, its performance may degrade in images with extreme noise, high dynamic range, or very low brightness, where the enhancement algorithms could struggle to yield satisfactory results. Additionally, processing high-resolution images may introduce computational constraints, potentially leading to longer processing times or increased resource consumption. Acknowledging these challenges is essential for providing a balanced perspective on the method's applicability and guiding future research to address these issues.
Aerial imagery is highly beneficial for real-world applications. However, these images often suffer from low contrast caused by imperfect atmospheric conditions and limitations in imaging systems. The proposed method demonstrates significant potential for real-world applications, particularly in areas such as UAV-based monitoring, disaster management, and urban planning. Its ability to enhance the contrast of aerial images efficiently makes it a valuable tool for real-time analysis in these fields. For instance, in disaster management, improved image clarity can aid in assessing damage and coordinating response efforts. Similarly, urban planners can utilize enhanced imagery for better visualization of land use and infrastructure. These applications underscore the method's practical relevance, enabling stakeholders to make informed decisions based on high-quality aerial data. Although several methods exist to improve the quality of aerial images, not all of them are capable of producing satisfactory results. Some methods are complex, while others require multiple inputs. Moreover, the low-contrast impact, which is challenging to prevent during the data collection process, significantly degrades the quality of aerial images. A new approach for enhancing the contrast of aerial images has been suggested in this research by combining well-known image processing methods. The proposed algorithm was applied to several low-contrast aerial images and compared with two commonly used contrast enhancement algorithms, HE and CLAHE, using two advanced IQA metrics, EME and SSIM. The proposed algorithm produced good EME and SSIM scores when applied to various aerial images based on the experimental results. The images processed with the proposed algorithm are also visually better than the original image and those processed by HE and CLAHE.
This research was funded by the Deanship of Scientific Research and Libraries at Princess Nourah bint Abdulrahman University, through the “Nafea” Program (Grant No.: NP- 45-093).
[1] Hinchcliffe, T. (2010). Aerial photography and the postwar urban planner in London. The London Journal, 35(3): 277-288. https://doi.org/10.1179/174963210X12814015170232
[2] Chen, S.E., Rice, C., Boyle, C., Hauser, E. (2011). Small-format aerial photography for highway-bridge monitoring. Journal of Performance of Constructed Facilities, 25(2): 105-112. https://doi.org/10.1061/(ASCE)CF.1943-5509.0000145
[3] Sidike, P., Sagan, V., Qumsiyeh, M., Maimaitijiang, M., Essa, A., Asari, V. (2018). Adaptive trigonometric transformation function with image contrast and color enhancement: Application to unmanned aerial system imagery. IEEE Geoscience and Remote Sensing Letters, 15(3): 404-408. https://doi.org/10.1109/LGRS.2018.2790899
[4] Asokan, A., Anitha, J., Ciobanu, M., Gabor, A., Naaji, A., Hemanth, D.J. (2020). Image processing techniques for analysis of satellite images for historical maps classification-An overview. Applied Sciences, 10(12): 4207. https://doi.org/10.3390/app10124207
[5] Lee, K., Kim, J.H., Lee, H., Park, J., Choi, J.P., Hwang, J.Y. (2021). Boundary-oriented binary building segmentation model with two scheme learning for aerial images. IEEE Transactions on Geoscience and Remote Sensing, 60: 1-17. https://doi.org/10.1109/TGRS.2021.3089623
[6] Singh, K., Kapoor, R. (2014). Image enhancement via median-mean based sub-image-clipped histogram equalization. Optik, 125(17): 4646-4651. https://doi.org/10.1016/j.ijleo.2014.04.093
[7] Samanta, S., Mukherjee, A., Ashour, A.S., Dey, N., Tavares, J.M.R., Abdessalem Karâa, W.B., Taiar, R., Azar, A.T., Hassanien, A.E. (2018). Log transform based optimal image enhancement using firefly algorithm for autonomous mini unmanned aerial vehicle: An application of aerial photography. International Journal of Image and Graphics, 18(4): 1850019. https://doi.org/10.1142/S0219467818500195
[8] Wong, C.Y., Liu, S., Liu, S.C., Rahman, M.A., Lin, S. C.F., Jiang, G., Kwok, N., Shi, H. (2016). Image contrast enhancement using histogram equalization with maximum intensity coverage. Journal of Modern Optics, 63(16): 1618-1629. https://doi.org/10.1080/09500340.2016.1163428
[9] Akay, B., Karaboga, D. (2015). A survey on the applications of artificial bee colony in signal, image, and video processing. Signal, Image and Video Processing, 9: 967-990. https://doi.org/10.1007/s11760-015-0758-4
[10] Lal, S., Narasimhadhan, A.V., Kumar, R. (2015). Automatic method for contrast enhancement of natural color images. Journal of Electrical Engineering and Technology, 10(3): 1233-1243. https://doi.org/10.5370/JEET.2015.10.3.1233
[11] Liu, C., Cheng, I., Zhang, Y., Basu, A. (2017). Enhancement of low visibility aerial images using histogram truncation and an explicit Retinex representation for balancing contrast and color consistency. ISPRS Journal of Photogrammetry and Remote Sensing, 128, 16-26. https://doi.org/10.1016/j.isprsjprs.2017.02.016
[12] Saha, S., Chatterjee, S., Sen, S., Oliva, D., Perez-Cisneros, M., Sarkar, R. (2024). Contrast enhancement of digital images using dragonfly algorithm. Journal for Control, Measurement, Electronics, Computing and Communications, 65(4): 1545-1557. https://doi.org/10.1080/00051144.2024.2404365
[13] Rahman, H., Paul, G.C. (2023). Tripartite sub-image histogram equalization for slightly low contrast gray-tone image enhancement. Pattern Recognition, 134: 109043. https://doi.org/10.1016/j.patcog.2022.109043
[14] Zhang, W., Zhuang, P., Sun, H.H., Li, G., Kwong, S., Li, C. (2022). Underwater image enhancement via minimal color loss and locally adaptive contrast enhancement. IEEE Transactions on Image Processing, 31: 3997-4010. https://doi.org/10.1109/TIP.2022.3177129
[15] Mukhopadhyay, S., Hossain, S., Malakar, S., Cuevas, E., Sarkar, R. (2023). Image contrast improvement through a metaheuristic scheme. Soft Computing, 27(18): 13657-13676. https://doi.org/10.1007/s00500-022-07291-6
[16] Demirel, H., Ozcinar, C., Anbarjafari, G. (2009). Satellite image contrast enhancement using discrete wavelet transform and singular value decomposition. IEEE Geoscience and Remote Sensing Letters, 7(2): 333-337. https://doi.org/10.1109/LGRS.2009.2034873
[17] Kwok, N., Shi, H. (2015). An integrated framework for aerial image restoration. In 2015 International Conference on Machine Learning and Cybernetics (ICMLC), Guangzhou, China, pp. 322-327. https://doi.org/10.1109/ICMLC.2015.7340942
[18] Talebi, H., Milanfar, P. (2016). Fast multilayer Laplacian enhancement. IEEE Transactions on Computational Imaging, 2(4): 496-509. https://doi.org/10.1109/TCI.2016.2607142
[19] Sheet, D., Garud, H., Suveer, A., Mahadevappa, M., Chatterjee, J. (2010). Brightness preserving dynamic fuzzy histogram equalization. IEEE Transactions on Consumer Electronics, 56(4): 2475-2480. https://doi.org/10.1109/TCE.2010.5681130
[20] Singh, K., Kapoor, R. (2014). Image enhancement using exposure based sub image histogram equalization. Pattern Recognition Letters, 36: 10-14. https://doi.org/10.1016/j.patrec.2013.08.024
[21] Min, X., Zhai, G., Gu, K., Zhu, Y., Zhou, J., Guo, G., Yang, X., Guan, X., Zhang, W. (2019). Quality evaluation of image dehazing methods using synthetic hazy images. IEEE Transactions on Multimedia, 21(9): 2319-2333. https://doi.org/10.1109/TMM.2019.2902097
[22] Tan, X., Triggs, B. (2010). Enhanced local texture feature sets for face recognition under difficult lighting conditions. IEEE Transactions on Image Processing, 19(6): 1635-1650. https://doi.org/10.1109/TIP.2010.2042645
[23] Wang, W., Peng, Y., Cao, G., Guo, X., Kwok, N. (2020). Low-illumination image enhancement for night-time UAV pedestrian detection. IEEE Transactions on Industrial Informatics, 17(8): 5208-5217. https://doi.org/10.1109/TII.2020.3026036
[24] Pham, N.T., Park, S., Park, C.S. (2021). Fast and efficient method for large-scale aerial image stitching. IEEE Access, 9: 127852-127865. https://doi.org/10.1109/ACCESS.2021.3111203
[25] Kim, B.H., Bohak, C., Kwon, K.H., Kim, M.Y. (2020). Cross fusion-based low dynamic and saturated image enhancement for infrared search and tracking systems. IEEE Access, 8: 15347-15359. https://doi.org/10.1109/ACCESS.2020.2966794
[26] Megahed, Y., Shaker, A., Yan, W.Y. (2020). A phase-congruency-based scene abstraction approach for 2d-3d registration of aerial optical and LiDAR images. IEEE Journal of Selected Topics in Applied Earth Observations and Remote Sensing, 14: 964-981. https://doi.org/10.1109/JSTARS.2020.3033770
[27] Park, J., Lee, J.Y., Yoo, D., Kweon, I.S. (2018). Distort-and-recover: Color enhancement using deep reinforcement learning. In Proceedings of the IEEE Conference on Computer Vision and Pattern Recognition, pp. 5928-5936. https://doi.org/10.48550/arXiv.1804.04450
[28] Gao, T., Li, K., Chen, T., Liu, M., Mei, S., Xing, K., Li, Y.H. (2020). A novel UAV sensing image defogging method. IEEE Journal of Selected Topics in Applied Earth Observations and Remote Sensing, 13: 2610-2625. https://doi.org/10.1109/JSTARS.2020.2998517
[29] Zhuang, L., Guan, Y. (2019). Image enhancement by deep learning network based on derived image and retinex. In 2019 IEEE 3rd Advanced Information Management, Communicates, Electronic and Automation Control Conference (IMCEC), Chongqing, China, pp. 1670-1673. https://doi.org/10.1109/IMCEC46724.2019.8983874
[30] Peng, Y.T., Lu, Z., Cheng, F.C., Zheng, Y., Huang, S.C. (2019). Image haze removal using airlight white correction, local light filter, and aerial perspective prior. IEEE Transactions on Circuits and Systems for Video Technology, 30(5): 1385-1395. https://doi.org/10.1109/TCSVT.2019.2902795
[31] Xi, Y., Jia, W., Zheng, J., Fan, X., Xie, Y., Ren, J., He, X. (2020). DRL-GAN: Dual-stream representation learning GAN for low-resolution image classification in UAV applications. IEEE Journal of Selected Topics in Applied Earth Observations and Remote Sensing, 14: 1705-1716. https://doi.org/10.1109/JSTARS.2020.3043109
[32] Nomani, T., Mohsin, M., Pervaiz, Z., Shafique, M. (2020). xUAVs: Towards efficient approximate computing for UAVs-Low power approximate adders with single LUT delay for FPGA-based aerial imaging optimization. IEEE Access, 8: 102982-102996. https://doi.org/10.1109/ACCESS.2020.2998957
[33] Zhang, Y., Huang, X., Jia, J., Liu, X. (2019). A recognition technology of transmission lines conductor break and surface damage based on aerial image. IEEE Access, 7: 59022-59036. https://doi.org/10.1109/ACCESS.2019.2914766
[34] Jiang, G., Lin, S.C.F., Wong, C.Y., Rahman, M.A., Ren, T.R., Kwok, N., Shi, H., Yu, Y., Wu, T. (2015). Color image enhancement with brightness preservation using a histogram specification approach. Optik, 126(24): 5656-5664. https://doi.org/10.1016/j.ijleo.2015.08.173
[35] González, J. (2014). SNSequate: Standard and nonstandard statistical models and methods for test equating. Journal of Statistical Software, 59(7): 1-30. https://doi.org/10.18637/jss.v059.i07
[36] Łoza, A., Bull, D.R., Hill, P.R., Achim, A.M. (2013). Automatic contrast enhancement of low-light images based on local statistics of wavelet coefficients. Digital Signal Processing, 23(6): 1856-1866. https://doi.org/10.1016/j.dsp.2013.06.002
[37] Heath, M., Sarkar, S., Sanocki, T., Bowyer, K. (1997). Edge Detector Comparison. http://www.eng.usf.edu/cvprg/edge/edge_detection.html.
[38] Bhateja, V., Yadav, A., Singh, D. (2023). OGIF: A novel optimized guided image filter for image enhancement. Expert Systems. https://doi.org/10.1111/exsy.13281
[39] Wang, Z., Bovik, A.C., Sheikh, H.R., Simoncelli, E.P. (2004). Image quality assessment: from error visibility to structural similarity. IEEE Transactions on Image Processing, 13(4): 600-612. https://doi.org/10.1109/TIP.2003.819861