Ramasamy Kaliaperumal![]() | Srinivasan Anandan*
| Srinivasan Anandan*![]()
© 2025 The authors. This article is published by IIETA and is licensed under the CC BY 4.0 license (http://creativecommons.org/licenses/by/4.0/).
OPEN ACCESS
Hand gesture recognition is so versatile and easy to use, it is among the best methods for facilitating human-computer interaction. High recognition performance, user-independent interfaces should be the goal of real-time manual recognition systems. Convolutional neural networks (CNNs) have demonstrated impressive recognition rates in image classification tasks in recent times. Thus, we employ multi-scale deep convolutional neural networks and the Entropy Controlled Tiger Optimization (ENcTO) classification method, which is motivated by CNN performance, to recognize and classify human palms and palmprints. Finger segmentation, feature extraction, preprocessing of hand regions of interest using mask images, and finger recognition using a multi-scale deep CNN classifier are all included in the processing flow. A mask picture is used to preprocess the whole image's hand region. To boost the contrast of every pixel in the image, the adaptive histogram equalization approach is used. Next, features are extracted from the preprocessed images using SIFT (Scale Invariant Feature Transform). The gesture recognition pipeline first separates the fingers in the mask picture, then segments the hand's region of interest and normalizes the segmented finger images. Hand images with segmented finger regions are input into a multi-scale deep CNN that classifies the images into several categories using the Entropy Controlled Tiger Optimization (ENcTO) classification method. This research presents a high-performance state-of-the-art approach for gesture detection and identification combining multi-scale deep CNN and Entropy Controlled Tiger Optimization (ENcTO) classification algorithm and augmentation techniques with a recognition rate of 96.72%, the results demonstrate the superiority of the proposed method over alternative approaches. These results demonstrate how well gray wolf optimization and deep learning work together to increase the precision of human identification from palmprint images.
human palm prints and hand gesture, multiscale deep CNN classification, scale-invariant feature transformation, adaptive histogram equalization
Undoubtedly, one of the biggest problems of the twenty-first century is human-computer interaction. That's because most work is currently done entirely by robots, but robots often require human supervision, guidance, and collaboration with humans to receive and process their data. Start a trade or complete a challenge.
In certain professions, working with people is necessary. For instance, it's crucial to understand what people desire regarding entertainment. Consider a robot serving customers as a barman. The robot must interact with humans, determine their wants, and carry them out. Another illustration is the detection of bombs, which necessitates skilled supervision to lower danger [1]. People are developing new techniques for facilitating communication to address these demands. Every customer or bar professional can learn how to program a robot and enter the proper instructions [2]. Therefore, we must develop methods for organically interacting with robots so that they may get information from the humans in their environment. Human-computer interaction, or HRI, satisfies these requirements [3].
The approach to the long text recognition problem was adapted according to the type of images available [4]. Utilize various gadgets to capture palm images. These devices can produce non-contact or contact images, high or low resolution, 2D or 3D, or images captured using different methods [5]. The palm fingerprint databases utilized in the tests may be split into three groups for non-contact images. The hand has a set position and orientation across all images in the category with the tightest restrictions, and the backdrop is uniform. The semi-constrained dataset groups have no varied hand locations, directions, or non-uniform backgrounds. Cell phone cameras often generate such images [6]. The last category is unrestricted, knowledge, and gesture, not subject to restriction rules.
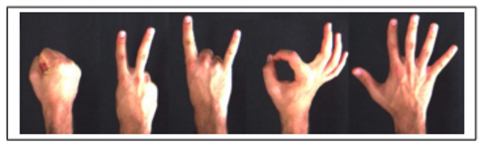
In reality, gestures are used for various purposes, including pointing toward specific individuals and expressing explicit or implicit information. Studies have revealed that gestures are an essential component of language development and an ornament to spoken language [7]. A person's sentiments and ideas are sometimes challenging to convey without utilizing extra gestures. Gestures play a significant function as an accompaniment to the horse as a way of input, among other vital aspects of HRI [8]. This essay focuses on the challenge of identifying and categorizing various hand forms used by human users, often known as static gesture identification. Static gestures imply that the state and direction of the movement are more important than the movement's style [9]. Figure 1 illustrates various hand movements. The entire procedure is done to create a cooperative human-robot.
Figure 1. Different hand movements
Although hand recognition was one of the first biometric formats used, more research is needed on using this authentication method. Among hand-based methods, vein pattern recognition is one of the most promising to characterize images obtained from fingers, palms, etc., or palm regions. The advantage of using a vein pattern is that the vascular network is located under the skin and, unlike many other biometrics, is not easily visible to the naked eye and is thus challenging to forge [10]. Another advantage of using vein patterns for biometric identification is that they are considered unique to each individual, including identical twins [11], and the ways often do not change significantly over time. From the acquisition point of view, a non-contact venous pattern acquisition system can be designed. Such methods are more acceptable to users as they cause minimal user discomfort and reduce the possibility of cross-contamination. It's also important to note that the palm is usually the most reliable area on the hand from which vein patterns for biometrics can be derived. This is because it usually does not show hair growth, affecting the captured image's quality [12].
Another SIFT method can register images to discover properties like points, lines, edges, and objects. Face identification methods are often employed, particularly in the security sector. The rotation, magnification, and brightness variations do not affect the SIFT algorithm. SIFT features can be used to calculate large-scale feature data when paired with other kinds of feature matching. Each of the four concentric circles that made up the circular region had a radius of two pixels. Then, each sub-region is divided into ten directions in order to create a 40-dimensional feature descriptor.
1.1 Contribution
Our primary contributions are as follows:
• Developed a ROI method that separates the image into one channel and then applies average-based contrast enhancement to it. A straightforward merge is used to combine several enhanced channels into a single frame.
• This gesture identification pipeline segments the hand region of interest using a mask image that separates the fingers and normalizes the segmented finger images.
• It merges the features extracted from both streams using the proposed SIFT algorithm.
• Combination of multiscale deep convolutional neural network with Entropy Controlled Tiger Optimization algorithm for the best classification.
For sign language recognition, many writers have suggested various video processing and machine learning (ML) techniques. Here are a few similar tasks. Gestures are identified, and color characteristics and contour extraction are utilized [13]. Its usage of contour extraction means that it can only be used to count stray fingers and no other motions, which is a drawback. The drawback in this situation is that some gesture symbols used in HMIs in place of hydration motions cannot be detected. However, it does not mention how to recognize hand movements [14]. The disadvantage of using LSTM and 3DCNN for dynamic gesture recognition is that letter motions are not recognized and are instead used for military gestures.
Suboptimal architecture methods used to improve large-scale blurring [15]. A unified blur kernel with a Gaussian process used to produce many blurred images. Then, we convolve it with explicit images from the ImageNet dataset [16] to provide pairs of crisp and blurred images for network training. Deconvolutional CNN that can blur images instead of blinds in the blur setting is proposed which break down (inverse) blur kernels into a few critical filters and build networks based on separable kernel features [17]. To lessen visual artifacts like noise and color saturation, we additionally integrate a denoising network [18] that links proposal modules at the network's end. A blind deblurring technique for CNNs is suggested, and their proposed network iterative kernel estimation, latent image estimation, and feature extraction methods resemble conventional optimization-based deblurring methods [19].
A sequential deblurring approach was suggested by making two blur and sharpening patches using 73 potential blur kernels. We next trained a classification CNN to calculate the likelihood of a specific blur kernel for local patches [20]. The energy model, which consists of the CNN likelihood and smoothness dictionary, is then optimized to provide a blur kernel that varies smoothly. The energy model, which consists of the CNN likelihood and smoothness dictionary, is then optimized to provide a blur kernel that varies smoothly. As stated by Peng et al. [21], the edit distance enhanced CNN model was able to obtain 90.79% accuracy in the static and dynamic gesture detection of Pakistani individuals. To improve performance, we use fusion techniques by globalizing the regional features identified in the 3D CNN model. On three color video gesture datasets, this method achieves recognition rates of 98.12%, 100%, and 76.67%.
Using LSTM blocks, Conv1D, and Conv2D pyramids, Ali et al. [22] presented a multi-level functional LSTM. This approach utilizes the deep form features of the hand segmentation model and the skeletal point cloud features of the skeletal data. The 14-class- and 28-class Dynamic Gesture Recognition (DHG) datasets show 96.07% and 94.40% accuracy for the approach. In this study, we use an LSTM model with two pyramid convolution blocks to extract dynamic gesture variety from 28 skeletal and 14 depth data. Of the eighteen categories, 94.40% of them are accurate. Convolutional extended short-term memory networks, or ConvLSTMs, are utilized by Gholami and Khashe [23] to recognize the temporal relationship between color images' spatiotemporal properties and to generate high-level gesture expressiveness.
Gholami and Noori [24], Combining the feature fusion network with the ConvLSTM network allowed for the extraction of spatiotemporal feature information from local, global, and deep perspectives. Regarding the Jester and SHIG (Sheffield Kinect Gesture) datasets, the suggested technique obtains accuracy levels of 95.59% and 99.65%, respectively. For hand movement recognition, Mambou et al. [25] introduced EDenseNet, an enhanced densely connected convolutional neural network. With three datasets of gestures, the approach obtains an average accuracy of 99.64%. Venmathi et al. [26] put forth a 3D convolutional neural network (3DCNN) that can detect hand movements in real time and retrieve fingerprint positions. For a video dataset with seven manual procedures, the 3DCNN model's accuracy was 92.6%.
Studied the translation of symbolic words from gesture to text [27]. With an accuracy of 97.28%, we could categorize symbolic gestures using Support Vector Machines (SVM) on a data set of 11 one-handed and nine two-handed gestures. Examined sexual assault-related gestures made in both indoor and outdoor settings at night [28]. How the gesture recognition system is being implemented consists of a bounding box picture classification stage that generates attack alerts after a YOLO CNN architecture has been used to extract motions. Overall, the network model's accuracy needs to be improved; light must be enough.
Adel for interpreting finger spells and gestures in films called Compact Spatial Pyramid Pooling (SPP) was proposed by Ewe et al. [29]. The model runs three times faster than conventional classifiers and requires 65% fewer parameters. TEM (Temporal Segment Network) and TSM (Temporal Shift Module) were improved upon by Alsharif et al. [30] using the lightweight semantic segmentation FASSD-Net network. The suggested 13-gesture dataset, which focuses on in-the-moment non-touchscreen interactions, was adequate.
In conclusion, academics' most difficult task is creating a solid framework for gesture recognition that addresses the most prevalent issues with the fewest restrictions and yields precise and trustworthy outcomes. There are several real-time gesture processing restrictions, including distance, lighting, background, and numerous motions. While specific approaches for hand action identification that use non-machine learning techniques are available, their accuracy could be more consistent, and specific actions can overlap with each other in different conditions (e.g., illumination), making this approach unsustainable. It is more independently adaptable than machine learning techniques. Consequently, system development uses a machine learning methodology. The exciting aspect of this work is how deep learning methods are implemented in gesture recognition systems using novel segmentation approaches.
2.1 Problem formulation
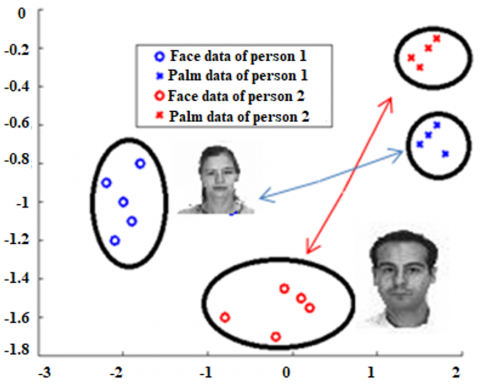
This paper uses two common types of biometric data as examples to keep things simple. Face data is one type, and fingerprint data is the other. It makes sense, from a distinction standpoint, to believe that an individual's whole set of biometric data falls into a single category. Furthermore, in the same feature space, his face and palm print data can be viewed as two subclasses of this class. Figure 2 displays samples of palm prints and faces from two individuals.
In this case, data for two persons is displayed. Each has twelve pieces of information, six faces, and a palm print. The original data had an order of magnitude of 1e4, which I used for illustration when I performed PCA on it.
Figure 2. An example of the corresponding palmprint data and the mix-Gaussian distribution of the face data (blue-face and palm data of first person, red-face and palm data of second person)
Figure 2 illustrates a typical Gaussian mixture distribution on a sample of IDs belonging to a single individual [31]. Stated differently, a Gaussian is formed by grouping the face data and a second Gaussian is formed by grouping the fingerprint data. In the combined space, there is a high likelihood of data from two individuals overlapping if you apply traditional LDA, which requires the grouping of one person's face and fingerprint data. The SDA in Figure 2 undoubtedly provides a better description of this distribution of data.
Let k be the face sample and i be the palm print sample of person, respectively. The sample number for every subclass is denoted by nc. Next, we create the dispersion matrix within subclass SW and the dispersion matrix between subclass SB as follows:
SB=∑c−1i=1∑2j=1∑ck=i+1∑2l=1PijPkl(μij−μkl)(μij−μkl)T (1)
SW=1N∑ci=1∑2j=1∑nck=1(xkij−μij)(xkij−μijT) (2)
where,
N=c×nc,Pij=Pkl=ncN,μij=∑nck=1xkijnc (3)
Let be the ideal transform vector that needs to be determined. It can be found by:
max (4)
3.1 PolyU hand gesture dataset
Seven thousand seven hundred fifty-two images of left and right hands from 193 people are included in the PolyU collection. Three hundred eighty-six palm images with 11 to 27 samples each are available. The images have a 384x284 pixels resolution, are in the.bmp format, and were captured throughout two sessions separated by around 60 days. Each dataset's sample is shown in Figure 3(a).
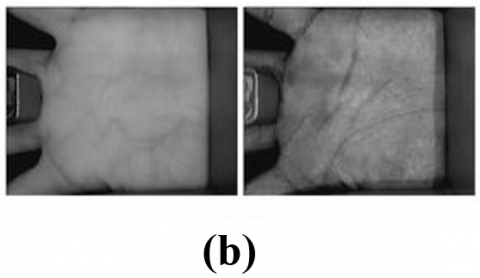
Figure 3. (a) PolyU palmprint databas (b) PolyU Multi-Spectral palmprint database
In an experiment combining the AR database and the PolyU handprint database, 119 subjects were chosen from the face and palmprint databases, with each category having 20 samples, as evidence for the suggested fusion technique. Similarly, 189 participants were chosen from the face and palmprint databases, with each category containing 20 samples, for an experiment that combined the FRGC database and the PolyU handprint database. We take it for granted that a subject's sample from the face database and the handprint database match. We randomly choose samples from each individual for training from any of the two databases and remaining samples used for testing in the two database chosen. Every method under comparison was executed 20 times. The comparison kernel method used in the experiment is the Gaussian kernel as:
k(x, y)=e^{-\frac{|x-y|^2}{2 \delta \mathrm{i}^2}}
where, the parameter \delta_{\mathrm{i}}=\mathrm{i} \times \delta, \mathrm{i} \in 1 to 20, where δ is the training data. This is the set's standard deviation. In order to achieve the best classification performance for every kernel comparison technique, parameter I was selected.
3.1.1 PolyU Multi-Spectral palmprint database
250 left-handed and 250 right-handed samples were gathered for the PolyU multispectral palmprint image database, yielding 500 categories, as shown in Figure 3(b) [31]. Two images taken for each palm, with each session consisting of six palm images and a 10-day turnaround on average. Each acquisition was carried out in fewer than four distinct spectral lighting conditions to obtain long-term images in four bands, including red, green, blue, and near-infrared.
3.2 American Sign Language (ASL) database
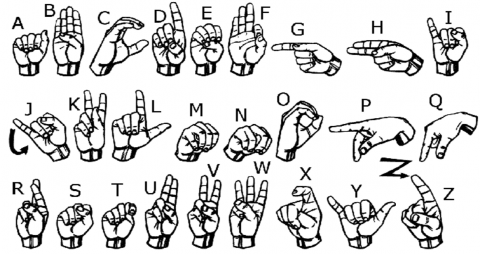
In the alphabetic symbol recognition system, each letter of the American alphabet is signed individually by the signer with one hand. The deaf community uses the alphabet to spell names of people, places, and other words. As with the representation of the letters ‘C’, ‘D’, ‘L’, ‘M’, ‘N’ and ‘W’ the semantic meaning of hand gestures to alphabetic letters is derived from their shapes. Additionally, some descriptions of how different letters appear need further investigation. When representing the letters J and Z, the signer must use movements that imitate the shape of each letter. All image recognition systems rely on image processing. It is influenced by visual depictions, which play an important role. Symbols in the ASL alphabet, such as A, E, M, N, and S, have some similarities, leading to a simple deep learning model that can distinguish between gestures for classification purposes very difficult to find. The aim of this study was to find a visual descriptor capable of distinguishing different gestures of the ASL alphabet, see Figure 4.
Figure 4. ASL hand gestures for each alphabet
3.3 Image preprocessing
This step's objective is to resize the hand region to the pretrained CNN input image size by segmenting it within the hand gesture image frame. The Kinect depth camera provides color and depth map images, as seen in Figure 5. For static hand gesture recognition, only images from the depth map are taken into account between two inputs. The hand region in the depth map is divided using the depth threshold. As seen in Figure 5, the depth threshold to separate the hand from the background is set at the experimentally determined value of 10cm [14]. The hand region is located and the noisy portion of the hand is eliminated using a maximum area based filtering technique. The segmented image as displayed in Figure 5's bounding box model. The bounding box region is then cropped from the image that has been segmented. Three-channel input images are used by every pretrained CNN to function.
Figure 5. Preprocessing of images
As a result, (1) is used to normalize the cropped hand motion image and create a single-channel image in the range [0, 255].
\begin{aligned} & D(x, y)=\left\{\begin{array}{c}\frac{\max (D)-D(x, y)}{\max (D)-\min (D)} \times 255 \text { if } D(x, y) \neq 0 \\ 0 \quad \text { if } D(x, y)=0\end{array}\right.\end{aligned} (5)
In this case, D stands for the depth value of the depth map image, and (x) for the depth map's pixel index. The depth map's maximum and minimum depth values are max(D) and min(D). One way to convert a single channel to three channels is to manually crop a single-channel image and then apply a jet color map. The segmented images are manually resized to match the pretrained CNN AlexNet and VGG-16 input image sizes. Consequently, all images in the dataset are resized to a resolution of 227×227×3227×227×3 for pretrained AlexNet, and to a resolution of 224×3224×224×3 for pretrained VGG-16.
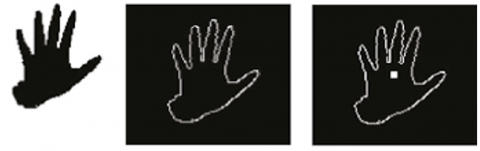
Figure 6. ROI area obtained using image processing
The ROI area's relative location on the palm is fixed and situated in its middle. We suggest a commonly utilized edge-based palm fingerprint localization technique to extract ROI images. In the following portion of this work, we apply this method to handle ROI areas with many features. Figure 6 displays the PolyU Multi-Spectral-Palmprint ROI region.
4.1 Scale-Invariant feature transform (SIFT) feature extraction
The SIFT image technique is calculated using a configurable number of essential points throughout four steps. The number of critical issues calculated is based on the image's content. Each of these points is subsequently assigned a feature vector of 128 elements. Based on the proportion of critical points that match between test and training images and categories test images using the SIFT feature.
The procedure of matching feature points between two images goes like this. SIFT descriptors (key points) are first computed for each image in the collection. Think about two ideas, U and V, described by m and n descriptors, respectively, as shown by u1, u2,..., um and v1, v2,..vn.
The keypoint matching of two images is calculated as follows:
(1). Compute the distance between each eigenvector associated with image U and each eigenvector associated with image V; compute the m x n distance.
(2). A critical point with feature vector ui in image U matches key point vk in image V [32].
The argument T is a positive actual number less than 1. The threshold parameter can be used to control the critical point-matching process. One key point in image U can only match one key point in image V. Details of the key point extraction and matching process can be found. In our first experiments, we used default values for the parameters of the SIFT algorithm. We then examined the effect of the number of octaves, contrast-related thresholds, and edge-related thresholds in each layer on classification results. We reasoned that the contrast-dependent entry would provide the most pronounced effect. A predetermined and fixed set of SIFT parameters may be used to calculate images with no connected key points, few key points, and many key points.
This condition has the following discomforts:
- Images can only be classified with crucial points.
- Images with few associated vital points are often misclassified.
- Matching an image with a few key points with an image with numerous vital points appears to be complicated.
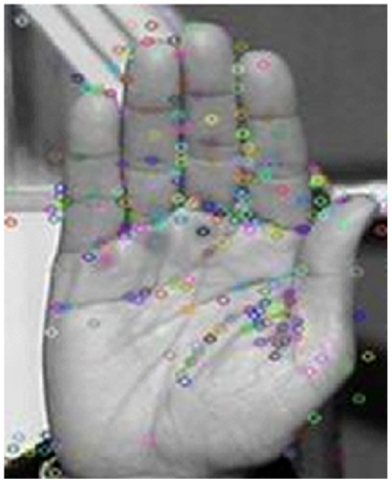
The calculation duration of the matching algorithm is influenced by the number of critical points produced for the two images being compared. Therefore, the matching process is computationally expensive, and the classification time for images with many vital points is long. For example, Figure 7 shows matching key points according to distance measures. Crucial points of comparison between the reference and subject palm patterns in the picture are used to compare textures for palm pattern matching.
Figure 7. Detection of Keyspots
4.2 SIFT algorithm
The rotation, magnification, and brightness variations do not affect the SIFT algorithm. SIFT features can be used to calculate large-scale feature data when paired with other kinds of feature matching. The blood component of the skin leaves fingerprints on the hand. Utilizing infrared light, which guards against harm from the outside, spoofing, and fraudulent assaults, may be obtained. The touchless palm design has various benefits, including cleanliness and touchless collecting. The SIFT technique is used in this suggested method to segment palm patterns. The SIFT method, invariant to the image's translation, rotation, and scaling, is employed in image recognition and matching. SIFT is used to estimate scale-space extrema with DOG (difference of Gaussian), identify core points, and remove low-contrast problems. The assignment of key point orientation is then carried out based on local image gradients. The amplitude and direction of the image gradient are then used to determine the image description for each key point.
• Obtain the desired picture
Utilizing the DOG function, determine the image's scale-space constraints and the location of the core point.
• Calculating descriptors for images.
Local extrema estimates for each key point (x,y) are provided as
D(x, y, \sigma)=(G(x, y, \sigma)-G(x, y, \sigma)) * I(x, y) (6)
D(x, y, \sigma)=L(x, y, s \sigma)-L(x, y, \sigma) (7)
where,
L(x, y, \sigma)=G(x, y, \sigma) (8)
The scaling parameter is L(x, y), which indicates a Gaussian-smoothed image with a keypoint. By adding a Taylor series to the DOG scale-space function D(x, y), the interpolation for every key point is found.
D(x)=D+\frac{\lambda D^T}{\lambda x}+\frac{1}{2} x^T \frac{\lambda^2 D}{\lambda x^2} x (9)
The image tilt One can calculate the direction θ(x,y) and magnitude m(x,y) as
m(x, y)=\sqrt{\begin{array}{l}(L(x+1, y)-L(x-1, y))^{\wedge} 2 \\ +(L(x, y+1)-L(x, y-1))\end{array}} (10)
\theta(x, y)=\tan ^{-1}\left(\frac{L(x, y+1)-L(x, y-1)}{(L(x+1, y)-L(x-1, y)}\right) (11)
Algorithm of SIFT:
|
Stage |
Description |
|
Step 1 |
Compute Gaussian scale and space |
|
Step 2 |
Calculating (DoG) |
|
Step 3 |
Identifying the feature keypoints |
|
Step 4 |
keypoints localization |
|
Step 5 |
Identify and eliminate unstable extrema key points |
|
Step 6 |
Filter inaccurately localized edge key points |
|
Step 7 |
Define a position reference to every key point location |
|
Step 8 |
Create a set of features using the SIFT |
4.3 Segmentation of hand gestures
Backgrounds are divided into two categories in this subsection: backgrounds that resemble skin and backgrounds that do not. To segment hand gestures on backgrounds that are not skin, we use SGM; for backgrounds that resemble skin, we use the SGM-Kmeans method.
Figure 8. Segmentation of gestures in non-skin backgrounds skin-like background using SGM and SGM K-Means
Skin color is one of the most noticeable physical characteristics of the human body, and its detection can be used to segment gestures. SGM is able to segment gestures from non-skin backgrounds as demonstrated in Figure 8, but it is unable to eliminate interference from backgrounds that resemble skin. Three different types of pixels can be seen in Figure 8(b)'s image after SMG segmentation: skin color, skin color background, and black background. Three types of pixels must be grouped together and skin-like overlap must be eliminated in order to segment skin-tone hand gestures on a skin-like background. Based on the results of experiments, the K-means algorithm is chosen to be 3, as Figure 8(c) illustrates, in order to effectively separate three different types of pixels and remove interference such as skin. To lessen the load on the data processing system during feature extraction and gesture classification, convert the segmented gesture image to a black and white image and scale it to 64×6464×64 pixels.
4.3.1 Deep convolutional neural networks classifier
Convolutional neural networks have been highly successful in recent visual identification tasks, including image categorization [5], object recognition [8], and scene analysis [10]. The deep learning based on CNN would be a strong contender for all image identification tasks. In contrast to current object detection, Saliency detection is commonly classified as a low-level problem in computer vision. Squeeze prediction must not understand what is within an image region but how it compares to neighbouring areas. The contrastive information concealed in multi-scale deep CNN features is thoroughly examined in this study, and a straightforward and effective neural network structure is suggested to determine the saliency score of each area. Hierarchical feature vectors appropriate for scene labeling are extracted using a multi-scale convolutional network. Before being fed to the three-level convolutional network, the Laplacian pyramid transforms the original input image into three scales. Each pixel's feature stack corresponds to the response of the same pixel in all convolutional layers. In contrast to the region-oriented functions utilized in our technique, the pixel-oriented parts do not emphasize region contrast, which is crucial for saliency detection.
A deep neural network (DNN) is employed to learn local patch characteristics, and we use these features to calculate the extrusion score for the centre pixel. Because we only consider local patches, the quality of the resulting extrusion maps is vulnerable to high-frequency background noise, which may cause homogenous regions inside extruded objects to be misclassified. A global search phase is implemented to take advantage of the intricate connections among globally squeezed cues conveyed using manual features. It is suggested to use an end-to-end deep contrastive network that takes fractional and pixel-wise saliency inference into account. It uses both the global and local context and incorporates them into a framework for collective deep learning to identify saliency. Their model gives each super pixel a crimp score. A super pixel’s local context is fixed to be one-third the size of the global context, the super pixel is centred on the context, and the global context's scope is comprised of the whole image:
The actual size of the surrounding environment affects how the local context is sized spatially. Given our local context, the contrast between each location and the background may be more accurately estimated.
Instead of straight regression, we provide an architecture for a neural network that can extract hidden contrastive information from connected multi-scale deep features. To address mistakes brought on by super pixels, we employ segmentation at multiple levels and CRF-based pixel-level refinement. According to experimental findings, the suggested approach performs better than any other CNN-based extrusion model.
4.4 Multiscale deep convolutional neural networks
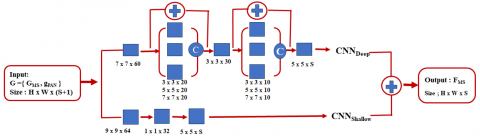
We provide two ideas to improve the network design built on the aforementioned basic CNN architecture with three convolutional layers for sector sharpening: a multi-scale feature extraction block and skip connections. There are two sub-networks in the suggested MSDCNN. Examples of CNNs include a deep CNN with two multi-scale convolutional layered blocks and a straightforward 3-layer CNN with the same architecture. Figure 9 displays the whole MSDCNN architecture.
A deep neural network architecture called VGG-16 was pre-trained using a large ImageNet dataset. Convolutional and max-pooling layers, which steadily decrease the spatial dimension while increasing the number of channels, make up the VGG-16 backbone. To begin the feature extraction process, the model can make use of pre-trained weights that utilize information acquired from millions of images. This facilitates the capturing of common visual characteristics that are helpful for different image classification processes, such as HGR classification. Several convolutional layers that have been layered on top of the backbone model make up the CNN head. Such convolutional layers allow the architecture of the model to be tailored to extract characteristics at different sizes.
The higher layers at the top of the CNN capture more complex and abstract features, while the VGG16 layers closer to the input focus on learning low-level properties such as edges and textures. This distinction is vital for Hand Gesture Recognition (HGR) classification, as anomalies in images can appear with unusually large or complex shapes. Multi-scale feature maps enhance the model's ability to detect abnormalities of varying sizes, improving the overall accuracy of HGR classification. The VGG16 architecture consists of five blocks, with the core of the model processing an input image of 300×300 pixels. Blocks 1 through 5 of the VGG16 backbone help extract hierarchical features from the input image.
Each block contains a MaxPooling2D layer that reduces the size of the feature map and a Conv2D layer with increasing filter sizes. The first two blocks (Blocks 1 and 2) include two Conv2D layers (convX_1 and convX_2) and one MaxPooling2D layer (maxpoolX). For Block 1, the Conv2D layer outputs a size of 300×300×64, while Block 2’s Conv2D layer produces a size of 150×150×128. The MaxPooling2D layers output sizes of 150×150×64 and 75×75×128, respectively, effectively downsampling the feature map to reduce spatial dimensionality. The subsequent blocks (Blocks 3, 4, and 5) consist of three Conv2D layers (convX_1, convX_2, and convX_3) along with one MaxPooling2D layer (maxpoolX). The feature maps progressively shrink in spatial dimensions, with sizes of 75×75×256 (Block 3), 37×37×512 (Block 4), and 18×18×512 (Block 5). MaxPooling2D layers continue to downsample the feature maps, with output sizes of 37×37×256, 18×18×512, and 18×18×512.
The first active layer, conv4_3, used for HGR classification, has a spatial dimension of 38×38, which is significantly smaller than the input image. High-resolution feature maps greatly enhance the model's ability to identify fine edges and patterns in images. The CNN head, consisting of blocks 6 through 11, adds further convolutional layers, allowing the model to capture more intricate and abstract features from the HGR input images. As the Conv2D structure's spatial dimensions continue to decrease, the resolution of the feature maps progressively drops.
The feature map from Block 4 (conv4_3) is linked to the Concatenate layer, while the feature map from Block 5 (maxpool5) connects to Conv6, which has an output size of 18×18×1024. Conv6 is then connected to Conv7, followed by additional convolutional blocks (Conv8 through Conv11). Each of these blocks, consisting of two Conv2D layers, builds on the features extracted by the previous block. In the Conv8 block, the first layer (conv8_1) has an output size of 18×18×256, while the second layer (conv8_2) produces an output of 9×9×512. The output from conv8_2 is linked to the first layer of Conv9 (conv9_1), which has a size of 9×9×128, and the second layer (conv9_2) produces an output of 5×5×256. Conv9_2 connects to Conv10_1 (5×5×128), Conv10_2 (3×3×256), and Conv11_1 (3×3×128), completing the sequence.
Figure 9. Proposed multiscale deep convolutional neural networks (MSDCNN) model
4.5 Multi-scale feature extraction block
We use the open-source framework to train deep layers on the unprocessed ImageNet dataset and then fine-tune them for object recognition. Multi-scale characteristics are extracted from each visual area using artificial neural networks. This CNN has eight-layer architecture, with three fully linked layers and five convolutional layers. For features, take 4096 neurons make up the output of the second and final fully connected layer. However, autonomously generated CNN features are widely employed in several visual computing applications and are highly prevalent. For CNN feature extraction, CNN features are specified in areas such as the rectangle regions established and which are exclusively related to pixels. Image regions can have irregular forms, but we must extract CNN features from the square areas. The pixels outside the region are filled in, serving as the image's bounding box. The average pixel value of the same position across all ImageNet training images is used to fill the bounding box. After average subtraction, these pixel values become 0, which does not affect the outcomes. It is unknown if the region stands out about its neighbors and the rest of the image because Feature A does not offer information about the area around the considered image region. In order to add the region-surrounding property, which takes into account the understanding of neighborhood contrast, we extract a second feature vector from the rectangular neighborhood that acts as the bounding box for the inspected area and its neighbors. Within this enclosing box, all pixel values stay constant. Once more, after warping, this rectangle neighbor is sent into a deep CNN-a result of invoking CNN function B in a vector form.
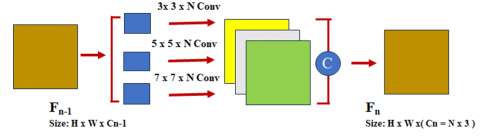
Figure 10. MSDCNN model's first layer
(a) Fundamental convolution layer
(b) A multi-scale feature convolutional layer
Figure 11. Multi-scale feature extraction layers
As we all know, how distinct (in terms a region's comparison to the remainder of the image (in terms of color and content) is a critical indicator in extrusion calculations. Another crucial indicator is where a particular visual section is located within the larger picture. We extract feature C from full-rectangular images to achieve these requirements using a deep CNN. The characteristics used to train and evaluate the extrusion model are collectively defined by these three feature vectors acquired at various sizes. The three CNN feature vectors are combined to create the final feature vector, giving S-3CNN its name, as shown in Figure 10 and Figure 11.
The classifications efficiently use the rich spatial information in high-resolution images, enhancing the feature extraction's resistance under various challenging ground conditions.
The nth layer multi-scale layer block's convolution kernels are configured with three sizes: 33, 55, and 77, as seen in Figure 11. N groups N are grouped for each dimension. The output is created by concatenating N functional maps along the kernel's spectral measurements.
4.6 Entropy Controlled Tiger Optimization
In this paper, we employ entropy values to alter the tiger optimization algorithm [17], which we refer to as entropy-controlled tiger optimization (ENcTO). A tiger approaches a target it wants to chase using the tiger optimization (TO) algorithm, and the tiger chases the target once it begins to run. The tiger always takes the shortest path in order to escape from its target. This new route leads to a place where the goal can be reached via an alternate route rather than the shortest route to it. To do this, common mistakes like taking a direct route to the destination must be eliminated, and the path can be modified based on the most recent experience. But if the target changes his mind, the tiger does too, and it takes the shortest path. Lastly, tigers can track their targets even if they run faster because they cover less ground than their targets. More importantly, the tiger will seek out and pursue a target whose behavior is dynamic (i.e., has parameter values that vary over time).
According to the Tiger Optimization (TO) algorithm, the target runs as the tiger approaches it, and the tiger chases after it in an attempt to catch up. The tiger will always choose the quickest path when it comes to escaping its prey. This new road is the point when there are alternative routes to reach the goal, not the shortest one. This may be achieved by removing typical mistakes (such taking the direct route to a goal) and adjusting the path based on the most recent experience. But if the target decides to alter course, the tiger will follow suit and go for the shortest path. Ultimately, despite running a lesser distance than the objective, the tiger was still able to follow it. Furthermore, the tiger will identify and pursue a prey whose behavior is dynamic that is, characterized by parameter values that vary over time.
They locate their prey and give birth to young tigers that are able to travel and possess all of their parents' memories. Tigers' speed won't slow down the system; instead, it will cause them to die of old age, become too weak to identify the best prey, or commit suicide as a result of overpopulation. Removing weak tigers from regions where they are abundant is another strategy to lower the population of tigers. In search of a better life, some children decide to change their ambitions and relocate at random. The technique seeks to identify the function's global and regional optimum values. Finding additional ideal values will be aided by adding more tigers to the population. This method lessens the influence on local values while increasing the possibility of discovering global values.
There are two categories of tigers in this metaphysical approach: male and female. Assume that there are ‘m’ men and ‘f’ women, despite the fact that m and f are initially equal. After locating their prey, they give birth to new tigers. These young tigers are capable of migrating to different regions and retain all of their parents' memories. Because of their rapidity, tigers will eventually grow old, become too numerous to successfully hunt, or commit suicide. The system will also be unable to slow down. Eliminating weak tigers from populated areas is another strategy to decrease the number of tigers. Certain cubs relocate at random to seek out better settlements and new targets. The goal of this approach is to locate a function's local and global optima. Finding a more ideal value will be aided by adding more new tigers. This technique lessens the influence on local values while increasing the likelihood of discovering global values. But once a tiger locates a good spot, it attacks to secure the best possible outcome. The Tiger algorithm stops searching and shows the best result when, at a given moment, it reaches the optimal outcome. TA [17] is distinct from other recent techniques since it doesn't call for population identification. In order to address improvements through births, migrations, deaths, and suicides, change populations by either removing existing tigers or breeding new ones. New tigers will be automatically created based on births and migrations if the current population of tigers is insufficient and nothing improves within the allotted time. The tiger will kill itself and commit suicide, though, if there is an excessive number of people present and the procedure is not carried out in a timely manner.
The distance between the target and the tiger determines TO. It will be challenging for a tiger to get to its target if it is far away. Distance is the inverse of two, as demonstrated by the equation below.
D(a)=\frac{D 1}{a^2} (12)
In the given equation, a is the distance, D(a) is a function that represents the dispersion between tigers, and Dl is the distance parameter between the target and the estimated time. The formula for β, if it signifies the absorption coefficient between the tiger and the target, is as follows:
D=D_p K^{-\beta \alpha} (13)
The distance between the tiger and the target, or Dp, is the primary parameter in this case. In order to prevent zero division in Eq. (14) two distinct formulas utilizing Gaussian discretization are applied:
D(a)=D_p K^{-\beta a^2} (14)
The σ coefficient is used to represent the grip volume for a target. Thus:
V=\varpi_p K^{-\beta a^2} (15)
In the case where a=0, \varpi_p is gripping, using an alternative approximation:
\bar{\omega}=\frac{\overline{\bar{\omega}}_p}{1+\beta a^2} (16)
The following is the formula for the separation between two tigers, l and m, located in al and am:
d_{l m}=\left|a_l-a_m\right|=\sqrt{\sum_{r=1}^d\left(a_{l, r}-a_{m, r}\right)^2} (17)
where, so dlm=√ (al−am)2+(bl−bm)2, and al,r is the rth element of the spatial coordinate of the lth tiger in 2-Devent. The degree to which a tiger l is preoccupied with another, superior tiger m is shown as:
a_l=a_l+\omega_p K^{-\beta a^2 i m}\left(a_l-a_m\right)+\varrho \tau_l (18)
The values of ϱ and τl for facilitation in Eq. (18) range from 0 to 1, and TA employs these values. At first, there are exactly equal numbers of male and female tigers. The algorithm is typically stopped by a few criteria, like the generation number, time, and other techniques. Every step in the process is intended to increase the number of tigers by a specific percentage in order to control the Ta population. In order to prevent them from staying in one place, tigers in the research site may first be constantly dispersed. A tiger cub is born when a female approaches a male tiger and is placed in an unpredictable spot. A tiger that folds simultaneously, whether male or female, always dies because it was weaker.
At each stage of this process, the search is initiated from the current region of the various search techniques. It is possible to detect points with larger object values more accurately by evaluating the range of steps towards each location using an inverse square law that is weighted by object value. Performance was assessed using error rate, with weighted KNN serving as the fitting function. Originality in optimization: A new function that removes uncertainty between specific TO features was designed by us, based on the information entropy equation. The formula below is first used to determine the information entropy value of a given vector:
E\left(\alpha_l\right)=-\sum_{i=1} P\left(\alpha_{l i}\right) \log p\left(\alpha_{l i}\right) (19)
where, \alpha_{l i} represents the feature value as of right now, E(αl) is the entropy value of the chosen TO-based feature vector, and (\alpha_{l i}) is the likelihood index of \alpha_{l i}. The following is how features are chosen using the generated entropy value:
T=\left\{\begin{array}{l}\text { Fsel for } \alpha_{l i} \geq E\left(\alpha_l\right) \\ \text { Ignore, } \text { Elsewhere }\end{array}\right. (20)
The features that have been chosen and satisfy the entropy-based selection criteria are denoted by Fsel in the formula above. In order to calculate fitness, these features are sent to the fitness function. After selecting the features, an Extreme Learning Machine (ELM) classifier is tasked with performing the final classification. The output is a feature vector with a dimension of N×726.
A simulation program written in Python (version 2.7) is used to test the suggested gesture detection and identification technique. Python Scientific Distribution supports this open-source program. Each module simulates the suggested tasks using the Python programming language and is integrated into the Python core. Using a Core i3 processor and 4GB of RAM, Windows 8 is used to install the Python program. It was Kawulok et al. who devised the suggested gesture detection and identification technique. Many diverse gesture patterns recorded at various orientation angles make up this collection.
Hand gesture Images of the American Sign Language alphabet that were collected from Kaggle [5] and there are 87,000 images in the collection, each measuring 200 by 200 pixels. Since they are not static, the letters J and Z are not included in the data set. 8,700 images are used for testing and validation, while 69,600 images are used for training in this dataset. In PolyU dataset, with a novel contactless collecting technique, 12,000 images from 600 distinct palms make up the Tongji Contactless Palm Fingerprint Dataset [9]. At the beginning, 300 participants as 192 men and 108 women as provided images for Notified University to utilize.
Different background backgrounds and lighting conditions were used to gather or record the gesture included in this dataset. In this work, we employ 200 images of each hand gesture posture together with eight hand motions. This paper's training set comprised 1600 gesture images from this publicly available dataset. Eight hundred images that depict eight distinct movements make up the test set. There is no relationship between the gesture images found in the test dataset and the training dataset's gesture images. Moreover, 700 non-gesture images are included in the collection. The performance of the proposal task outlined in this article is measured using the following parameters.
Sensitivity=\frac{T P}{T P+F N} (21)
Specificity =\frac{T N}{T N+F P} (22)
Accuracy=\frac{T P+T N}{T P+F N+T N+F P} (23)
\begin{aligned} & { Recognitionrate } =\frac{\text { Number of images correctly classified }}{\text { Total number of images }}\end{aligned} (23)
This time, TP stands for true positive, suggesting that 154 images were successfully detected as gestures, and TN stands for true negative, indicating that 50 images were accurately recognized as gestures. There are two types of gesture image errors: false negative (FN) and false positive (FP), which represent the total number of misidentified gesture images (6 movements) and $5 images, respectively-determined as a percentage, the sensitivity, specificity, and accuracy values span from 0 to 100. The suggested gesture detection and identification method is more efficient when these parameters have more significant discounts.
The findings indicate that when compared to the standard CV test, the LOO CV test performs better. The explanations for the reasons follow. One CV technology that is user-independent is LOO CV [9]. This method uses user-provided gesture samples from non-model-development users to assess how well a trained model performs. On the other hand, in a typical CV, training and testing procedures involve gesture samples from each user in the dataset. As such, there is user bias in this CV test.
The model performs better on the regular CV test than it does on the LOO CV test, for this reason. Referencing the LOO CV test, Figures 12 and 13 display the confusion matrices of test gesture samples from the PolyU dataset and the ASL dataset. In PolyU dataset, ‘w’ and ‘6’ are the most perplexing gestures. According to Figure 12, 52.9% of the six gesture poses in total were incorrectly identified as ‘w’ gesture poses, and 48.6% of the 'w' gesture poses were incorrectly identified as ‘6’ gesture poses.
PolyU Hand Gesture Dataset
The experiments in this study are performed on the Hong Kong Polytechnic University (PolyU) extended text database. Table 1 shows the characteristics of the two databases [33]. Existing methods produced promising results on PolyU images (GAR=99.7, FAR=0.01), which are contact-based images. Therefore, better authentication schemes are needed, especially for contactless images.
Figure12. Confusion matrix for the PolyU dataset using test gesture examples for the LOO CV assessment
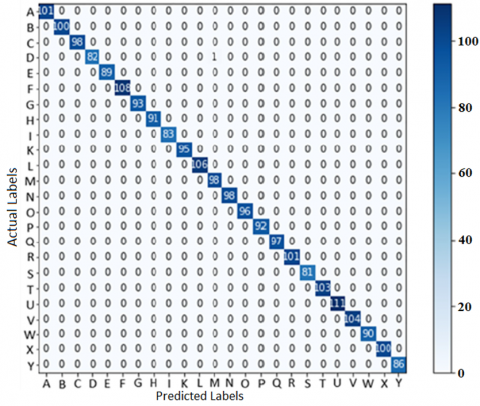
Figure 13. ASL dataset confusion matrix using test gesture samples for the LOO CV exam
Table 1. Dataset [33]
|
Characteristics |
ASL Database |
PolyU Database |
|
No of Users |
235 |
345 |
|
No of Samples |
7(1645 in total) |
7(2415 in total) |
|
Hands Acquired |
Left |
Left |
|
ROI size |
150×150 |
128 |
5.1 ASL dataset
As a result of their use of algorithms for data analysis and intelligent prediction, machine learning and deep learning are generally very data-centric. Sign language recognition and translation systems face numerous challenges, chief among them being the limited availability of sign language databases. Databases with both manual and non-manual gestures at the same time are hard to come by Vaitkevičius et al. [2]. In order to operate and study sign language recognition systems, researchers in this field must build a respectably sized database from scratch. Employing a common camera to take images of symbols from the American alphabet makes it simple for even a non-expert signer to create a fingerspelling dataset. There are only 26 characters in the vocabulary, and the majority of the characters are static in position. The proposed system represents the American alphabet in sign language exclusively with hand gestures. Images in the fingerspelling database only display the signer's motionless hands. The "IEEE Dataport" dataset is therefore appropriate for our system. There are 87,000 images in the IEEE Dataport dataset, categorized into 29 different groups. There are 3,000 images in each class; 26 classes match the 26 alphabets used in ASL, while the remaining classes include nothing, spaces, and deletions. The RBG formatted images in the dataset have different shapes and a pixel size of 200×3200 [3].
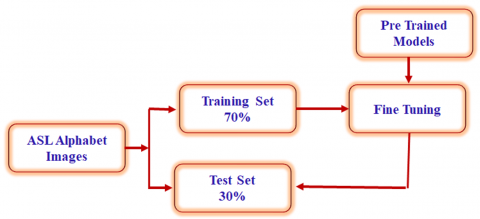
We resized the dataset for Vision Transformer to 224×224×3 pixels after training the AlexNet, ConvNeXt, EfficientNet, and ResNet-50 models with 200×200×3 pixels as the pixel size. Figure 14 displays the procedure used to partition the dataset [34]. A 5-fold cross-validation strategy was then used to train the model after 70% of the dataset was divided into training and validation sets. The test set is comprised of the last 30% of the data collection.
Figure 14. Data pipeline for splitting the ASL Alphabet dataset
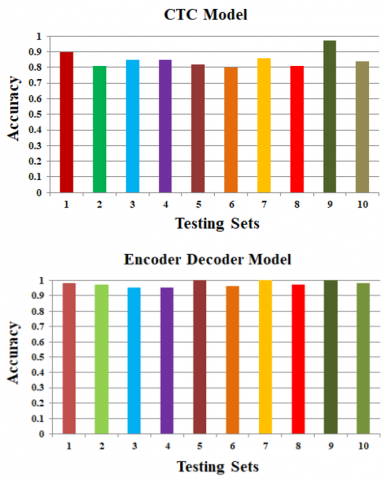
Figure 15. Ten-fold cross-validation of sequence recognition models: CTC-based model (Top) and Bottom-Encoder Decoder Model (Bottom)
The results of the isolated hand gesture recognition indicate that the best features for sequence recognition in this section are four groups of R_Z differences between non-adjacent joints. Ten-fold cross-validation is used to assess both the encoder-decoder recognition model and the CTC-based sequence recognition model. Ten subsets are randomly selected from the data set. Use the remaining nine subsets to train the model, with each subset serving as the test set. Figure 15 displays the precise word accuracy of both models during cross-validation [34]. The average accuracy of the encoder-decoder model is 96.4%, and the average accuracy of the CTC-based model is 86.4% when multiple users are not taken into account.
5.2 Preprocessing
Eight distinct classes, each of which represents a distinctive gesture, are produced by the CNN classification method. Images of training gestures in various stances and settings are shown in Figure 16.
Figure 16. Images of practice hand gestures in various poses and settings
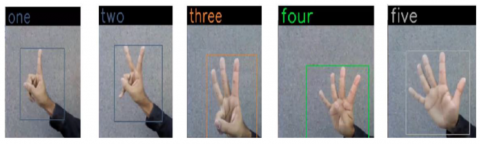
5.3 Feature extraction
Figure 17 displays sample gesture recognition image findings for the letters 1 to 4 numbers. Hand gesture are represented by the points connected to the hand region lines. Certain characters use similar motions. As a result, it is challenging to identify movements accurately. As a result, after altering and enhancing gestures, you may prevent these erroneous detections. In Table 2, Precision, recall, F1 score, and support are employed assessment criteria. As can be observed, most alphabets have vital recognition precision, memory, and F1 scores. L, M, Q, R, U, V, and W are the letters that are trickier to recognize; the other letters are correctly identified. Figure 18 depicts as the performance of the proposed model gesture recognition. The overall performance metrices are tabulated as Table 2.
Figure 17. Simulation result of gesture detection
Figure 18. The performance of the proposed model gesture recognition
Table2. Precision, recall, F1-score and support report
|
Alphabet |
Precision |
Recall |
Column A |
Support |
|
A |
0.95 |
0.97 |
0.99 |
12 |
|
B |
0.96 |
0.98 |
1 |
13 |
|
C |
1 |
1 |
0.95 |
12 |
|
D |
0.98 |
0.97 |
1 |
12 |
|
E |
1 |
0.95 |
1 |
9 |
|
F |
1 |
0.93 |
0.98 |
13 |
|
G |
0.94 |
1 |
0.97 |
15 |
|
H |
0.96 |
0.97 |
1 |
10 |
|
I |
1 |
1 |
1 |
11 |
|
J |
0.97 |
0.98 |
0.96 |
12 |
|
K |
1 |
0.97 |
1 |
9 |
|
L |
0.98 |
1 |
0.95 |
16 |
|
M |
0.97 |
0.95 |
0.97 |
18 |
|
N |
1 |
1 |
1 |
13 |
|
O |
0.99 |
0.96 |
0.98 |
11 |
|
P |
1 |
0.96 |
1 |
11 |
|
Q |
0.94 |
1 |
0.97 |
14 |
|
R |
1 |
0.92 |
0.96 |
10 |
|
S |
0.98 |
1 |
1 |
12 |
|
T |
1 |
0.94 |
0.98 |
10 |
|
1 |
0.97 |
1 |
0.99 |
19 |
|
2 |
1 |
0.91 |
0.94 |
13 |
|
3 |
0.97 |
0.94 |
0.95 |
12 |
|
4 |
0.99 |
0.92 |
1 |
12 |
|
5 |
0.98 |
0.97 |
0.93 |
12 |
|
6 |
0.96 |
1 |
1 |
11 |
|
Accuracy |
|
|
0.98 |
312 |
|
Average(Micro) |
0.98 |
0.97 |
0.98 |
312 |
|
Average(Weighted) |
0.98 |
0.97 |
0.98 |
312 |
5.4 Classification result
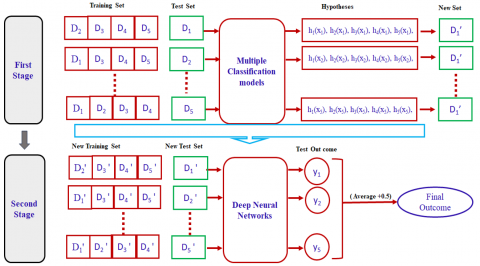
Figure 19 depicts as deep learning classification processes.
Table 3 presents the performance analysis of the suggested handshake recognition technique. 97.9% sensitivity, 95.9% specificity, 98.7% accuracy, and 98.2% recognition rate are attained by the camera shaking detection and identification technique presented in this study that employs the multi-scale DCNN classification algorithm. Real-time gesture picture recognition for various applications is inappropriate with these simulation results. Consequently, we integrate the ANN algorithm with the multi-scale DCNN classification technique to enhance the false positive system's performance. The ensemble approach attained 96.9% sensitivity, 91.1% specificity, 96.2% accuracy, and 97.1% identification rate.
When the multi-scale DCNN with ANN approach was used instead of the multi-scale DCNN without ANN method, the sensitivity of the multi-scale DCNN rose by 6.5%. When compared to multi-scale DCNN without ANN technology, the specificity ratio of the latter improved by 8.9%. When reaching the multi-scale DCNN with the ANN method to the multi-scale DCNN without the ANN method, the accuracy of the former is increased by 4.5%. Comparing multi-scale DCNN with ANN technology to multi-scale DCNN without, there is a 7% increase in recognition rate. The suggested hand action recognition system is characterized by 98.9% sensitivity, 95.6% specificity, 98.9 % accuracy, and 98.2% recognition rate (AHE+multi-scale DCNN classification approach). When comparing solely the multi-scale DCNN classification approach, Table 4 clearly shows that the suggested gesture detection method utilizing this method yields the most outstanding performances.
The suggested method is examined by employing the ANN classification approach. As demonstrated in Table 5, the AHE+DCNN+ANN classification approach yielded 94.5% sensitivity, 92.1% specificity, 98.6% accuracy, and 96.2% recognition rate. We contrast the suggested gesture recognition systems based on multi-scale DCNN. There are two types of ANN classifier kernels: nonlinear and linear. These are used in machine learning. ANN regression patterns are more exponential than ANN classifier regression patterns. This study contrasts the classification outcomes of multi-scale DCNN with ANN.
Figure 19. Deep learning classification processes
Table 3. Performance metrics- proposed hand gesture method
|
Parameters |
(%) |
|
Sensitivity |
97.9 |
|
Specificity |
95.9 |
|
Accuracy |
98.7 |
|
Recognition rate |
98.2 |
Table 4. Performance measures-proposed multiscale DCNN
|
Parameters |
CNN Classification |
DCNN Classification |
MSDCNN-ENcTO |
|
Sensitivity |
92.8 |
96.9 |
98.9 |
|
Specificity |
86 |
91.1 |
95.6 |
|
Accuracy |
92.5 |
96.2 |
98.9 |
|
Recognition rate |
93.6 |
97.1 |
98.2 |
Table 5. Performance metrics-proposed hand gesture detection methodologies using EncTO
|
Parameters |
ANN Classification |
DCNN Classification |
MSDCNN-ENcTO |
|
Sensitivity |
89.5 |
90.4 |
94.5 |
|
Specificity |
80.1 |
87.4 |
92.1 |
|
Accuracy |
88.6 |
92.7 |
98.6 |
|
Recognition rate |
89.3 |
91.6 |
96.2 |
Table 6. State of Art Techniques with the proposed method for PolyU dataset
|
References |
Model |
Accuracy |
|
[12] |
Fuzzy c-means |
76% |
|
[15] |
ANN |
91% |
|
[13] |
CNN |
93.94% |
|
[11] |
CNN-PSO |
98.12% |
|
[10] |
DCNN |
98.75% |
|
Proposed |
Multiscale DCNN |
99.54% |
The model was executed on several computers with varying preprocessing steps applied, and the outcomes are displayed below. The model using input ROI color space images was found to get the best results. To determine which hyper parameter value gives the highest accuracy and loss, we evaluated a variety of them on the model. By doing this, one of the objectives stated in the introduction is achieved in addition to making future research easier. The performance comparison between current method and conventional method is displayed in Table 5. Table 6 Shows the performance of proposed method in comparison with existing methods.
For hand gesture identification, this research suggests a lightweight model that is based on the Multiscale DCNN learning models with Entrophy Controlled Tiger Optimization (ENcTO). With an accuracy of 99.16%, the developed hand gesture recognition system recognizes objects and movements in real-time from video frames. The ASL and Poly U dataset is used for reorganization by the proposed vision-based system, which can then be translated into text. For gesture detection, we discovered Media Pipe hand gesture characteristics and SIFT models to be helpful. In the Real-time gesture image recognition, integrate the ANN algorithm with the multi-scale DCNN classification technique to enhance the false positive system's performance. The ensemble approach attained 96.9% sensitivity, 91.1% specificity, 96.2% accuracy, and 97.1% identification rate. As demonstrated in the AHE+DCNN+ANN classification approach yielded 94.5% sensitivity, 92.1% specificity, 98.9% accuracy, and 96.2% recognition rate. The capture, matching, recognition, and authentication of palmprint images may be done using the SIFT approach, and OpenCV is used to mimic the matching performance. Instead of inputting the alphabet from the keyboard or into a search engine, you may utilize the alphabet you discover in a Word document. Real-time application tasks that use multiple characters or word recognition to interact or control the program might be added to this task.
[1] Al-Hammadi, M., Muhammad, G., Abdul, W., Alsulaiman, M., Bencherif, M.A., Alrayes, T.S., Mathkour, H., Mekhtiche, M.A. (2020). Deep learning-based approach for sign language gesture recognition with efficient hand gesture representation. IEEE Access, 8: 192527-192542. https://doi.org/10.1109/ACCESS.2020.3032140
[2] Vaitkevičius, A., Taroza, M., Blažauskas, T., Damaševičius, R., Maskeliūnas, R., Woźniak, M. (2019). Recognition of American sign language gestures in a virtual reality using leap motion. Applied Sciences, 9(3): 445. https://doi.org/10.3390/app9030445
[3] Rezende, T.M., Almeida, S.G.M., Guimarães, F.G. (2021). Development and validation of a Brazilian sign language database for human gesture recognition. Neural Computing and Applications, 33(16): 10449-10467. https://doi.org/10.1007/s00521-021-05802-4
[4] Žemgulys, J., Raudonis, V., Maskeliūnas, R., Damaševičius, R. (2020). Recognition of basketball referee signals from real-time videos. Journal of Ambient Intelligence and Humanized Computing, 11: 979-991. https://doi.org/10.1007/s12652-019-01209-1
[5] Afza, F., Khan, M.A., Sharif, M., Kadry, S., Manogaran, G., Saba, T., Ashraf, I., Damaševičius, R. (2021). A framework of human action recognition using length control features fusion and weighted entropy-variances based feature selection. Image and Vision Computing, 106: 104090. https://doi.org/10.1016/j.imavis.2020.104090
[6] Zhao, L., Li, S. (2020). Object detection algorithm based on improved YOLOv3. Electronics, 9(3): 537. https://doi.org/10.3390/electronics9030537
[7] Kulikajevas, A., Maskeliunas, R., Damaševičius, R. (2021). Detection of sitting posture using hierarchical image composition and deep learning. PeerJ Computer Science, 7: e442. https://doi.org/10.7717/peerj-cs.442
[8] Annamalai, M., Muthiah, P.B. (2022). An early prediction of tumor in heart by cardiac masses classification in echocardiogram images using robust back propagation neural network classifier. Brazilian Archives of Biology and Technology, 65: e22210316. https://doi.org/10.1590/1678-4324-2022210316
[9] Huu, P.N., Minh, Q.T. (2020). An ANN-based gesture recognition algorithm for smart-home applications. KSII Transactions on Internet and Information Systems (TIIS), 14(5): 1967-1983. http://doi.org/10.3837/tiis.2020.05.006
[10] Abraham, L., Urru, A., Normani, N., Wilk, M.P., Walsh, M., O’Flynn, B. (2018). Hand tracking and gesture recognition using lensless smart sensors. Sensors, 18(9): 2834. https://doi.org/10.3390/s18092834
[11] Rufus, N.H.A., Anand, D., Rama, R.S., Kumar, A., Vigneshwar, A.S. (2022). Evolutionary optimization with deep transfer learning for content based image retrieval in cloud environment. In 2022 International Conference on Augmented Intelligence and Sustainable Systems (ICAISS), Trichy, India, pp. 826-831. https://doi.org/10.1109/ICAISS55157.2022.10011122
[12] Ali, R., Manikandan, A., Xu, J. (2023). A novel framework of adaptive fuzzy-GLCM segmentation and fuzzy with capsules network (F-CapsNet) classification. Neural Computing and Applications, 35(30): 22133-22149. https://doi.org/10.1007/s00521-023-08666-y
[13] Gopalan, S.H., Vignesh, V., Mahendran, N., Dinesh, M.T.P.P. (2021). Dynamic clinical trials management in anunreliable environment using blockchain. Design Engineering (London), 5: 817-822.
[14] Del Rio Guerra, M.S., Martin-Gutierrez, J., Acevedo, R., Salinas, S. (2019). Hand gestures in virtual and augmented 3D environments for down syndrome users. Applied Sciences, 9(13): 2641. https://doi.org/10.3390/app9132641
[15] Ramalingam, T., Umamaheswari, R., Karpagalakshmi, R.C., Chandramohan, K., Sabari, M.S. (2021). Location of plant leaf maladies utilizing image division. Journal of Image Processing and Artificial Intelligence,7(3).
[16] Mezari, A., Maglogiannis, I. (2018). An easily customized gesture recognizer for assisted living using commodity mobile devices. Journal of Healthcare Engineering, 2018(1): 3180652. https://doi.org/10.1155/2018/3180652
[17] Namrata, K., Karpagalakshmi, R.C., Manikandasaran, S.S. (2017). Implementation of novel technique for image watermarking using 2D-DCT. International Journal of Pure and Applied Mathematics, 117(16): 221-226.
[18] Namrata, K., Karpagalakshmi, R.C., Tensing, D. (2016). Survey on 2D-DCT based image watermarking with high implanting limit and robustness. International Journal on Recent and Innovation Trends in Computing and Communication, 4(10): 161-164. https://doi.org/10.17762/ijritcc.v4i10.2576
[19] Karpagalakshmi, R.C., Tensing, D., Kalpana, A.M. (2016). Image localization using deformable model and its application in health informatics. Journal of Medical Imaging and Health Informatics, 6(8): 1972-1976. https://doi.org/10.1166/jmihi.2016.1959
[20] Young, G., Milne, H., Griffiths, D., Padfield, E., Blenkinsopp, R., Georgiou, O. (2020). Designing mid-air haptic gesture controlled user interfaces for cars. Proceedings of the ACM on Human-Computer Interaction, Honolulu, HI, USA, 4(EICS): 1-23. https://doi.org/10.1145/3397869
[21] Peng, Y., Tao, H., Li, W., Yuan, H., Li, T. (2020). Dynamic gesture recognition based on feature fusion network and variant ConvLSTM. IET Image Processing, 14(11): 2480-2486. https://doi.org/10.1049/iet-ipr.2019.1248
[22] Ali, R., Manikandan, A., Lei, R., Xu, J. (2024). A novel SpaSA based hyper-parameter optimized FCEDN with adaptive CNN classification for skin cancer detection. Scientific Reports, 14(1): 9336. https://doi.org/10.1038/s41598-024-57393-4
[23] Gholami, S., Khashe, S. (2022). Flight delay prediction using deep learning and conversational voice-based agents. American Scientific Research Journal for Engineering, Technology, and Sciences, 89: 60-72.
[24] Gholami, S., Noori, M. (2021). You don’t need labeled data for open-book question answering. Applied Sciences, 12(1): 111. https://doi.org/10.3390/app12010111
[25] Mambou, S., Krejcar, O., Maresova, P., Selamat, A., Kuca, K. (2019). Novel hand gesture alert system. Applied Sciences (Basel, Switzerland), 9(16): 3419. https://doi.org/10.3390/app9163419
[26] Venmathi, A.R., David, S., Govinda, E., Ganapriya, K., Dhanapal, R., Manikandan, A. (2023). An automatic brain tumors detection and classification using deep convolutional neural network with VGG-19. In2023 2nd International Conference on Advancements in Electrical, Electronics, Communication, Computing and Automation (ICAECA), Coimbatore, India, pp. 1-5. https://doi.org/10.1109/ICAECA56562.2023.10200949
[27] Ashiquzzaman, A., Lee, H., Kim, K., Kim, H.Y., Park, J., Kim, J. (2020). Compact spatial pyramid pooling deep convolutional neural network based hand gestures decoder. Applied Sciences, 10(21): 7898. https://doi.org/10.3390/app10217898
[28] Trojovsky, P., Dehghani, M., Hanus, P. (2022). Siberian tiger optimization: A new bio-inspired metaheuristic algorithm for solving engineering optimization problems. IEEE Access: Practical Innovations, Open Solutions, 10: 132396-132431. https://doi.org/10.1109/access.2022.3229964
[29] Ewe, E.L.R., Lee, C.P., Kwek, L.C., Lim, K.M. (2022). Hand gesture recognition via lightweight VGG16 and ensemble classifier. Applied Sciences, 12(15): 7643. https://doi.org/10.3390/app12157643
[30] Alsharif, B., Altaher, A.S., Altaher, A., Ilyas, M., Alalwany, E. (2023). Deep learning technology to recognize American Sign Language alphabet. Sensors, 23(18): 7970. https://doi.org/10.3390/s23187970
[31] Jing, X.Y., Li, S., Li, W.Q., Yao, Y.F., Lan, C., Lu, J.S., Yang, J.Y. (2012). Palmprint and face multi-modal biometric recognition based on SDA-GSVD and its kernelization. Sensors, 15(5): 5551-5571. https://doi.org/10.3390/s120505551
[32] Lowe, G. (2004). Sift: Scale Invariant Feature Transform. https://pdfs.semanticscholar.org/19d1/c9a4546d840269ef534f6c1c8e3798ce81ac.pdf.
[33] Parihar, A.S., Kumar, A., Verma, O.P., Gupta, A., Mukherjee, P., Vatsa, D. (2013). Point based features for contact-less palmprint images. In 2013 IEEE International conference on technologies for homeland security (HST), Waltham, MA, USA, pp. 165-170. https://doi.org/10.1109/THS.2013.6698994
[34] Gu, Y., Wei, W., Li, X., Yuan, J., Todoh, M. (2022). American Sign Language alphabet recognition using inertial motion capture system with deep learning. Inventions, 7(4): 112. https://doi.org/10.3390/inventions7040112