Shaista Farhat![]() | Anuradha Chokka*
| Anuradha Chokka*![]()
© 2025 The authors. This article is published by IIETA and is licensed under the CC BY 4.0 license (http://creativecommons.org/licenses/by/4.0/).
OPEN ACCESS
Preliminary detection of plant foliage diseases and classification can reduce the need for expensive agricultural procedures and help increase food production for farmers. Disease control and age prediction is therefore crucial for the development of agriculture, and it may be effectively carried out through early detection of plant diseases, which is necessary for timely usage of pesticides and control of diseases. Farmers often check for plant leaf diseases with their unaided vision, which is labor-intensive, prone to error, and can result in substantial losses in yield if predictions are incorrect. Several researchers use visual analysis and artificial intelligence approaches to efficiently handle this procedure. In order to address the shortcomings of human processing and the low recognition rate of other machine learning, statistical, and other methods, this work introduces a unique idea for identification of diseases in plants and age prediction by employing the hybrid model VGG16+ResNet 50 model. The class of diseases from various plant leaves can be recognized and categorized by the suggested VGG16+ResNet 50 model. Given that the two most current deep learning architectures are ResNet 50 and VGG16. The suggested work aims to integrate these two methodologies to design a hybrid architectural prototype for successful plant foliage disease identification, given their improved prediction performance and degree of accuracy. Adopting this hybridized methodology has the distinct advantage of accurately identifying the class of leaf disease from leaves of various plants, including fruits and vegetables. Performance evaluation is conducted using a variety of widely used open-source datasets and assessment metrics to test and validate the efficacy of the advanced hybrid architecture.
agriculture, artificial intelligence (AI), classification, deep learning, plant leaf disease detection, ResNet 50, VGG 16
In most of the countries across the world, agriculture has been a significant driver for economic growth. By 2050, there will be 10 billion individuals on the entire globe. Since there is a limited supply of agricultural land, crop production must maintain up with population growth. In 2050, the Food and Agriculture Organization of the United Nations (FAO) estimates that an additional 70% of food will be needed to sustain the world's population, yet more than one third of all food produced would be lost due to illnesses or diseases of plants. The cultivator selects the required crop based on factors such as soil type, local weather, and crop value. Expanding human populations, changing weather patterns, and political unrest drove the sectors to seek for new ways to increase food production [1]. This enables researchers to discover new, highly productive, accurate, and successful technologies.
Farmers are able to collect data and information using information technology and precision agriculture to help people make informed decisions about high yields of agriculture. Precision agriculture, or PA, is a cutting-edge technology that provides advanced methods for maximizing agricultural output. Leveraging this advanced technology can help foster agricultural economic growth [2, 3]. A farmer uses pesticides to prevent diseases at bay, handle insects, and boost crop productivity. Farmers are facing difficulties as a consequence of crop diseases brought about by industrial farming, reduced yield, and financial losses. As a result, the focus of disease severity and diagnosis is on the requirement for adequate terminology. Agriculture is essential to the domestic financial system and the quality of life for the people in many countries. Abnormalities in leaf development, chromatic distortion, growth delays, wilted and damaged units constitute typical symptoms. Despite the fact that diseases and pests can seriously harm crops or spread to other plants, they can also have a legitimate impact on the well-being of people. To prevent excessive losses on the yields, these need to be carefully evaluated and properly maintained. Diseases can occur in a variety of different plant parts, including the leaves, root, and products from nature [4, 5]. Leaf provides a few interesting advantages over flowers and organic products in every season of the year. The precision of the results and the acknowledgement rate have been enhanced through the deployment of advanced technologies such as ML and DL. Unique investigations took place in the field of machine learning for the identification and verification of plant contaminants. Machine learning techniques are fundamentally employed in agricultural research to identify, sense, and predict plant pressure characterization and crop diseases [6]. Typically, data is gathered from significant standard images or sensor data and then retaken shortly after to eliminate irrelevant but interesting information. The purpose of ML is to interpret data and extract knowledge from it. They applied to receive the decision according to the specifications. To handle numerous tasks of classification, clustering, mining association rules, anomaly identification, and others, several algorithms have been developed [7, 8]. A component of machine learning's evolution that adjusts to various dataset types in a compatible way is deep learning. In the factors of deep learning setting, CNN is a great tool for image recognition tasks [9, 10]. The structural relationship corresponds with the understanding process that humans go through from learners to information that can be processed by neurons in the brain. The standard plant leaf disease identification system is shown in Figure 1.
Figure 1. Plant leaf disease detection system
Conventional studies develop several CNN architectural models [11, 12] and other techniques [13, 14] for plant leaf disease identifying and classifying. However, the primary issues facing most approaches are their high complexity, longer training and validation times, higher mistake rates, and decreased efficiency. Thus, the proposed work seeks to advance a novel and distinctive deep learning methodology for plant leaf disease detection and classification. The paper's unique contribution is the development of the VGG16+ResNet 50 hybrid architecture model, which is intended to detect plant leaf diseases. These are the most well-liked and frequently utilized CNN designs, each of which has the advantage of greater accuracy, rapid processing, and the capacity to handle increasingly complicated images. The proposed effort seeks to combine these two approaches to advance an automated system for identifying plant leaf diseases. The remaining sections of this paper are organized as follows: Section 2 presents a literature review, exploring various deep learning architecture models utilized in plant leaf disease detection. For a deeper understanding, it also looks into the specifics of the dataset, the benefits, and the drawbacks of each work. The architecture model, mathematical examples, and a comprehensive explanation of the suggested hybrid VGG 16 + ResNet 50 models are provided in Section 3. Using a number of factors, Section 4 validates the performance outcomes and results of the suggested methodology. The suggested method is also contrasted with some of the most recent cutting-edge methods. Section 5 provides a summary of the paper's problems, findings, outcomes, and recommendations for future work.
1.1 Objectives of the work
(1) Design and implement a hybrid DL model that integrates VGG16 and ResNet 50 architectures, optimized for reduced computational complexity and resource efficiency.
(2) Improve the recognition rate of plant leaf diseases compared to traditional ML, statistical methods, and standalone DL models.
(3) Implement a model capable of accurately identifying and categorizing disease affecting leaves of various plant species, including fruits and vegetables.
(4) Achieve high accuracy in identify and analyze plant leaf diseases and age which maintain a lightweight model suitable for deployment on resource constrained device.
(5) Develop techniques to optimize the training and inference stages of the hybrid model, ensuring faster processing times and lower energy consumption.
This section looks into some of the most modern methods for categorizing and detecting plant leaf diseases that involve learning and detecting age using machine learning. In order to facilitate comprehension and analysis, it also looks at the benefits and difficulties associated with earlier research projects. Khanna et al. [15] created a strong deep CNN algorithm identifies the kind of plant disease based on the given pictures. This article describes deep learning-based techniques for detecting and grouping plant diseases using leaf photos captured at various resolutions. The goal of this research is to assist in differentiating both wholesome and unhealthy leaves making use of deep CNN based image analysis. Additionally, the authors develop a brand-new model named PlaNet, whose effectiveness is contrasted with that of other widely used CNN models. Stephen et al. [16] implemented a deep GAN model for identifying disease from the rice plants. This research establishes a new strategy that uses a deep GAN with an optimized backtracking search (IBS) method for classification and feature extraction. In order to obtain features that are associated with rice disease, including blemishes and structure, a 2DCNN and a 3D fast-learning component are integrated to produce a 3D2D deep CNN model. Moupojou et al. [17] built a new dataset named as, Field Plant for detecting and classifying plant leaf diseases. Here, 2,569 field images that were taken from the Internet and tagged to determine every distinctive leaf served to create the PlantDoc. Nevertheless, as some of the pictures in this collection have been taken in laboratories, misclassification may have occurred owing to the shortage of knowledge among plant pathologists in the annotation stage. Field Plant is offered as a dataset in this study, which has 5,170 images of plant diseases that originated from actual farms. To ensure method excellence, image's particular leaf parts have been manually marked under the tutelage of plant pathologists.
CNNs [18, 19] can independently learn hierarchical features from raw pixel data, making them ideal for handling image-related tasks. Their ability to detect local patterns through convolutional layers makes them highly effective for recognizing object, detecting images and classifying problems. Both DL and ML play a part in the detection and classification of images. SVMs and other machine learning algorithms might be enough for basic image recognition and classification tasks with established features. But for intricate image assignments [20], DL-including CNNs-is usually effective and adaptable. These models eliminate the requirement of manual feature generation by developing intricate properties and interpretations. Because CNNs can beat standard ML algorithms in accordance with precision as well as effectiveness, DL-and especially CNNs-is the favored method for the majority of contemporary image detection and classification applications [21, 22]. Because CNNs are capable of learning relevant image features and understand spatial hierarchies, they are frequently the preferred option for image recognition and categorization. The decision between traditional ML and DL hinges on the particular problem, the type and volume of data, and the available computing resources [23, 24]. When there is an abundance of data and computational power, DL-primarily via CNNs-is the method of choice for many complex image recognition and classification problems. To intensify the accuracy of plant disease identification and categorization, it becomes essential to gather large datasets that have significant variation, strengthen data, use transfer learning, and visualize CNN activation maps. When it came to their own datasets, the majority of the DL frameworks put forth in the survey works shown strong detection and classification effects; but, when applied to other datasets, the models performance was lacking. Therefore, in order to adjust to the various disease datasets, more resilient deep learning models have to be developed. In most research, the effectiveness of both DL and ML approaches was gain the Plant Village dataset [25-27]. The images in the collection were all shot in a testing facility, despite the fact that they show a variety of plant types with illnesses. Consequently, one might anticipate a sizable dataset of plant diseases in actual settings.
Numerous techniques that have been developed and made accessible in order to achieve significant advancements in the domains of machine learning, deep learning, and image processing have been discussed in the scientific literature [28]. According to the assessment, increasing the amount of datasets used for both training and testing the algorithms can improve their detection and classification efficiency, hence increasing the percentage of accuracy. Modern and updated DL algorithms that can offer more precise results in identifying and categorizing plant leaf or crop illnesses must constantly be developed and put in place in sequence to solve the issue of plant leaf or crop disease [29]. In the past, several kinds of methods of classification for plant leaf diseases have been generated and implemented. However, because of their versatility and attribute extraction property-which enables them to autonomously identify features-neural networks, like the CNN network, seem to be the best method for classifying plant diseases [30]. CNN has the capacity to extract additional characteristics from images in order to generate better outcomes than previous machine learning models. Among others, the CNN is a good choice for automated vision and image analysis research due to their sophisticated ability to learn from images and extract information for reliable output [31, 32]. Additionally, CNNs are frequently preferred option for image identification and categorization due to their intrinsic ability to automatically extract relevant image features and recognize hierarchical patterns. The selection of learning technique relies on the amount of data available and the resources provided for computational tasks [33-36]. Because of this, DL-primarily using CNNs-is recommended in many complex image recognition and classification tasks when there is a sufficient amount of data and processing power at hand.
This part includes architecture designs, mathematical formulations, and a thorough description of the ResNet 50, VGG 16, and suggested hybrid models. The proposed work's unique contribution lies in the improvement of a lightweight, combined deep learning approach for identifying plant diseases. Furthermore, the age prediction is carried out by machine learning using lightweight VGG 16. To do this, the most well-liked and effective architectures, such as ResNet 50 and VGG 16, are combined to create a hybridized algorithm that can identify various diseases with their respective ages from the plant leaves of any fruit or vegetable.
3.1 VGG 16 architecture
To enhance performance and differentiate the disease affected crop images and healthy ones, a pre-trained VGG16 models relied on Convolutional Neural Networks (CNNs) are employed. To recognize and analyze plant leaf images for effectiveness, the primary model uses data from previously trained VGG16 models. New field images have been retained by the CNN model, which also trained to operate as a disease identification and classification method. Large kernel filters, consisting of 11 and 5 convolutional layers having a 3×3-kernel filter size, strengthened the VGG model. 224×224 is the fixed size of the input image. After pre-processing, a convolutional layer with a 3×3 filter size had been applied to the images. The filter size has been set to 1 x 1 for the input channel's linear transformation. With a fixed stride size of 1 and max pooling using 2×2 sizes, the length of the stride is set to 2 [35]. The fully interconnected layers in the following stages all consist of 4096 channels have an identical configuration. The softmax activation layers is the last layer, and the RELU function of activation comes next. From additional feature maps or unprocessed images, the CNN layer is extracted. The majority of the user-specified parameters are stored on this part of the network. The two most crucial characteristics are the total number and size of the kernels. Specifically, the feature map of the convolution layer is computed as follows:
vi,j,m=MaxmK×Pi,j+Bm,0 (1)
where, vi,j,m indicates the activation factor of input image m, i, j is the position of input image, Pi,j denotes the location centered input patch, and Bm is the bias value. The ReLU activation function is significant since, even in an instance that the neuron activates, the gradient remains high (which is equivalent to 1). Simply stated, the ReLU layer applies the function to every value in the source region and sets all negative activations to 0.0. Without altering the convolution layer's receptive fields, this layer strengthens the nonlinear characteristics of the model and the entire network.
vi,j,m=Max(Si,j,m,0) (2)
where, Si,j,m represents the activation function’s input at mth channel. Pooling layers, like convolution layers, have a specific function. For example, they can be applied for maximum pooling, which captures the highest value from a specific area, which measures the average value by pooling. Typically, these processes are used to attenuate the dimensionality of the network.
Hi,j,m=[∑(a,b)∈τi,j(va,b,m)z]1/z (3)
where, Hi,j,m denotes the output of pooling at region (i,j) in the feature map, va,b,m indicates the feature value with the pooling region τi,j at the location of (a,b). The main purpose of pooling is to assist with extract features that are lightweight and sharp. Additionally, it is carried out to decrease calculations and error. Max-pooling facilitates elimination of low-level features like points, edges, etc. The function map's area covered by the philtre's protection will yield the greatest feature. The result that follows pooling layer(max) will be a map that involves the feature of the notable elements from the prior feature map. This operation is mathematically represented as follows:
hi,j,m=βmax (4)
where, \beta represents the random number that 0 or 1 indicates the option. The pooling layes in the fully connected network are utilised to flatten the results before to classification in order to improve network performance in classification. This is the same as the output layer of an MLP [37]. A neural network regularization method called dropout aids in reducing interdependent neuron learning. The term "dropout" in a neural network describes units that fall out (both transparent and hidden). Dropout, to put it simply, is the act of forgetting units, or neurons, that are chosen at random from any set of neurons at the learning stage.
y=r \times v\left(\omega^K s\right) (5)
s=\left[s_1, s_2 \ldots s_n\right]^K (6)
where, s indicates the input of fully connected layer, \omega is the weight matrix, r is the size of matrix, and y is the resultant output. The Softmax process gets an integer vector as input, normalizes it, and then creates a probability distribution with values that are proportionate to the exponential functions of the input integer. The values of units in a softmax category use a non-local linearity distribution, and is mathematically represented in below:
\mathcal{P}(x=z \mid y)=\frac{e^{y_k}}{\sum_j e^{y_j}} (7)
where, y and z are the probability values obtained from the softmax layer.
3.2 ResNet architecture
The structure of Residual Networks, or ResNet, consists of fifty levels. Compared to VGG-16, ResNet50 has an extra identification map, and the ResNet model predicts delta for the final prediction from a particular layer to the next. ResNet50 offers a different route to deal with the vanishing gradient problem and permits gradient flow in Figure 2 [38]. The very first layer of this architecture is input layer, which is used to read the image from the given set. Customized linear processes make up the convolution process. In this case, convolution is used rather than matrix multiplication. Generating feature maps can be the concise definition for this layer's function. The discrete time convolution procedure is carried out using the following equation:
x(k)=(z \times \omega)(k)=\sum_{m=-\infty}^{\infty} p(m) \omega(k-m) (8)
where, \omega represents the kernel filter, p denotes the input data, k indicates the time, and x is the result. If the image is in the two dimensional form, the expression can be represented as follows:
X(i, j)=(Q \times T)(i, j)=\sum_a \sum_b Q(i, j) T(i-a, j-b) (9)
where, i, j indicates the positions of matrix, which is used to obtained the result of convolution. Typically, it is positioned with the filter's center at the origin.
X(i, j)=(Q \times T)(i, j)=\sum_a \sum_b(i+a, j+b) T(a, b) (10)
Typically, the activation functions are used to convert the value found in deep learning operations to a non-linear form. Multi-layer artificial neural networks use activation functions for non-linear transformation processes [39]. There are usually numerous methods to activate something. The most widely used are Relu, Sigmoid, and Tanh. The method that was created makes use of Relu.
\textit{Sigmoid:}\; \mathscr{f}(p) = \frac{1}{1 + e^{-p}}, \; \mathscr{f}'(p) = \mathscr{f}(p)(1 - \mathscr{f}(p)) (11)
\begin{gathered}\text { Tanh: } \mathscr{f}(p)=\tanh (p)=\frac{2}{1+e^{-2 p}}-1, \mathscr{f}^{\prime}(p) =1-\mathscr{f}(p)^2\end{gathered} (12)
ReLu =\mathscr{f}(p)=\left\{\begin{array}{ll}0 & p<0 \\ p & p \geq 0\end{array}, \mathscr{f}^{\prime}(p)= \begin{cases}0 & p<0 \\ 1 & p \geq 0\end{cases}\right. (13)
Figure 2. Architecture of VGG 16
The final result of convolutional or fully connected layers has been normalized by batch normalization. This procedure restores the layer output and typically occurs prior the activation function. The network is trained more quickly as a result of this approach. Furthermore, the batch normalization approach lessens the covariance shift, and the function is represented as shown in the following equation:
Z_i=\frac{P_i-\delta_\alpha}{\sqrt{\varphi_\alpha^2+\varepsilon}} (14)
\varphi_\alpha=\frac{1}{A} \sum_{i=1}^A\left(P_i-\delta_\alpha\right)^2 (15)
\delta_\alpha=\frac{1}{A} \sum_{i=1}^A\left(P_i\right) (16)
where, A indicates the count of input, P_i: i=1,2, \ldots A, \delta_\alpha denotes the average stack value, \varphi_\alpha represents the standard deviation, and Z_i is the obtained value of batch normalization process. A model's capacity to extrapolate can be lost if it learns to memorize training material. By randomly removing nodes and connections throughout the network's training process, the dropout layer inhibits overlearning. Weights are kept from over matching the data by utilizing this method. The only purpose of the dropout layer in training is to avoid overlearning, and is typically used for testing and validation [40]. The fully interconnected layer's neurons rely on every part of the layer before them. In this stage, the data that came before is transformed into a one-dimensional matrix. Depending on the model, various number of fully connected layers may be employed, and the operation is mathematically represented as shown in below:
c_i^{\ell}=\sum_j \mathfrak{w}_{i j}^{\ell-1} y_j^{\ell-1} (17)
y_i^{\ell-1}=\mathscr{f}\left(c_i^{\ell}\right)+\mathscr{b}^{(\ell)} (18)
where, \ell indicates the layer number, i, j are the neuron number, y_j^{\ell} denotes output layer value, \mathfrak{w}_{i j}^{\ell} represents the value of the hidden layer, c_i^{\ell} represents the value of output layer before activation function, and \mathscr{b}^{(\ell)} is the value of deviation. Typically, the convolutional layer is employed before the pooling layer. Reducing the insights in the convolutional layer's output is the pooling layer's task as shown in Figure 3. Condensed feature maps have been generated by the pooling layer integrating each feature map's information obtained from the convolutional layer. The most popular techniques are max-pooling and average-pooling. There is no process of learning going on in this layer.
This layer selects N×N size filters, and the following equation determines the size of the image that emerges from the pooling layer:
X=\mathfrak{w} 2 \times \mathfrak{h} 2 \times \mathfrak{d} 2 (19)
\mathfrak{w} 2=\frac{(\mathfrak{w} 1-\mathscr{f})}{\mathfrak{X}+1} (20)
\mathfrak{y} 2=\frac{(\mathfrak{h} 1-\mathscr{f})}{\mathfrak{X}+1} (21)
\mathfrak{d} 2=\mathfrak{d} 1 (22)
where, \mathfrak{w} 2, \mathfrak{h} 2, and \mathfrak{d}2 are the width, height and depth of input, \mathscr{f} represents the size of filter, \mathfrak{X} denotes the number of steps used, and X indicates the size of original image. Here, the maximum pooling operation is performed for an improved classification. Prior to the Classification operation, the Softmax function is employed, which makes use of the network's probabilistic computation to produce a value for every class. Employing the following equation, this layer computes the probability for every class:
\mathcal{T}(z=j \mid p ; \mathcal{W}, \mathscr{b})=\frac{\exp ^{P^K \mathcal{W}_j}}{\sum_{j=1}^b \exp ^{P^K \mathcal{W}_j}} (23)
where, \mathcal{W} and \mathscr{b} are the weight vector. Lastly, the final layer is the classification layer, which is employed following the Softmax layer. The total number of classes produced is the outcoome of this layer.
Figure 3. Architecture of ResNet 50
3.3 Hybrid VGG16+ResNet 50
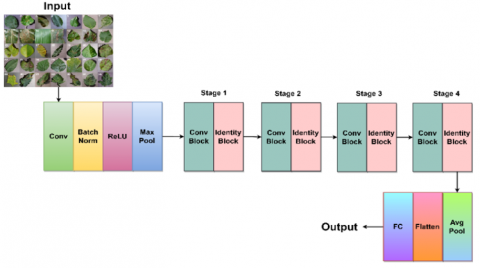
The hybrid VGG16+ResNet 50 model is developed in the proposed research to make efficient disease prediction and classification. The layered architecture model of the suggested proposed approach is presented in Figure 4. The VGG16 +ResNet50 architecutre is employed for obtaining the features from the input images. Deep CNN is built using the CNN algorithm by combining a convolutional layer with additional layers such fully connected layers, pooling, and non-linear [41]. CNN trains members through the method of backpropagation and convolutional filters to train them. Within the application, one filter does edge extraction and another handles classification. CNN filters are not very customizable, and learning determines what values have been selected. For obtaining features, the intricate designs of the VGG16 and ResNet50 models have been picked. Convolutional layers, activation functions, and fully-connected layers are the core elements of the CNN architecture paradigm. Training multilayer networks is made simple with ResNet50, as it does not raise the training error %. Furthermore, compared to ResNet50, AlexNet lacks depth, which tends technical loss. The subspace value is perfect when the ResNet50 is considered, where there is a possibility that the feature sub-space will overlap. When those features are used in the training and testing stage, the error value varies according to the change in error. The technique of detecting leaf diseases is enhanced with high accuracy and performance yields by employing the hybrid model.
Figure 4. Hybrid VGG 16+ResNet 50 classifier architecture model
3.3.1 Hybrid architecture overview
The suggested model is a mixture of two state-of-the-art Convolutional Neural Networks (CNNs) namely VGG16 and ResNet50 in order to improve feature extraction. We use the VGG16 model to provide high-resolutions features for the images as well as the ResNet50 model due to its residual learning ability which enables it to train deeper models as it solves the vanishing gradient problem.
Detailed Integration Process:
Feature Extraction: Initially, input is fed to the VGG16 model to obtain high level parameters (features) from the image. In the meantime, the same image is forwarded into ResNet50 for the extraction of the more profound, and abstract level features.
Feature Fusion: The output feature maps from both the VGG16 and ResNet50 are then combined in order to develop a more inclusive presentation of the image. This combination makes the model to borrow the best from both the worlds; the VGG16 for its ability in feature extraction and the ResNet50 for deep learning.
Global Average Pooling: Finally, a GAP layer is added to decrease the spatial dimensionality of the feature map, which helps in reducing the computational complexity while maintaining all the necessary information.
Classification: The image features are then combined and fed through fully connected layers and end with a SoftMax layer to produce the probabilities of the image falling under which category of disease.
3.3.2 Specific benefits of the integration
Improved Accuracy: VGG16 and ResNet50 are used in this work to enhance the accuracy of the model due to its capability to identify various features, both minute and general to enhance the distinction between various disease patterns.
Balanced Complexity: The hybrid model therefore has the advantage of complexity and performance and can therefore be implemented in scenarios where there are resources constraints while at the same achieving high classification accuracy.
Robustness Across Datasets: The adopted approach helps improve the model’s flexibility since it is capable of performing well across different datasets as seen from the results.
Algorithm 1. Hybrid VGG 16+ResNet 50 Classification Model
Input: Given plant image;
Output: Classified result;
Step 1: Perform convolutional layer operation;
For each layer in VGG 16
Obtain all the features for training F_1;
End for;
For each layer in ResNet 50
Obtain all the features for training F_2;
End for;
Step 2: Integrate the outputs of both models VGG 16+ResNet 50 as represented in below:
FeaL = Concatenation F1+F2;
Step 3: Initialize G = Global Avg Pool (FeaL);
G=Dense (1024, \mathcal{R});
P=Dense (N_C, \delta);
where, NC -Number of classes, P represents the prediction result, \mathcal{R} denotes the ReLU function and \delta indicates the softmax function;
Step 4: Determine the final model \mathbb{T} as shown in below:
\mathbb{T}= Model \left(F_1, F_2\right)+P;
Step 5: Estimate the loss function with Adam optimizer;
Step 6: Return the final output result;
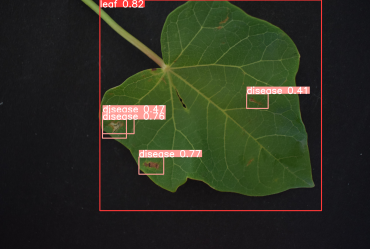
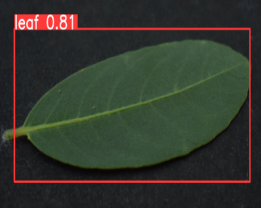
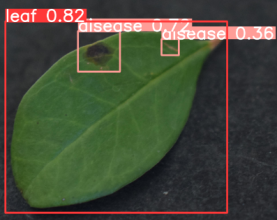
It uses a variety of plant datasets and assessment metrics to examine the results of the VGG 16, ResNet 50, and hybrid models. Additionally, the suggested VGG16+ResNet 50 model is compared with a few current ML and advanced DL architecture models to assess its efficacy in the identification and recognition of disease type categorization. In this work, popular datasets like Plant Village, Plant Doc, Field Plant, and Rice Plant are used for performance measurement and comparison. PlantVillage is the most comprehensive dataset on plant diseases, in which 54,000+images comprising 14 crop species were included. The pre-existing web portal, PlantVillage, provided access to this carefully chosen input of both healthy and diseased agricultural leaves. 17 microbial illnesses, 4 infections caused by bacteria, 2 fungal diseases, 2 infectious diseases, and 1 insect disease are there to harm these plants. Covering 13 plant families with 30 subclasses, PlantDoc is a collection of 2,569 images supporting defining objects and image analysis. In order to build models to determine plant disorders from real-world images, PlantDoc includes actual diseased plant pictures that have been downloaded from online sources. Figures 5(a) and (b) display a selection of the sample training and testing images, respectively. Consequently, Figure 6 displays the disease-detected zones that were found on the plant leaves.
The frequency of datasets utilized in this investigation with regard to various leaf classes is displayed in Figures 7-9. Additionally, the many assessment metrics taken into account for analysis in this paper are shown below:
(a)
(b)
Figure 5. (a) Sample training images; (b) Sample testing images
Figure 6. Disease detection regions
Figure 7. Frequency for PlantVillage dataset
Figure 8. Frequency for PlantDoc dataset
Figure 9. Frequency for PlantDoc dataset
Accuracy: In AI learning approaches, the predictability score of an algorithm, also referred to as accuracy, represents a classification metric that shows % of accurate predictions that they generate. It is represented as follows:
Accuracy =\frac{T P+T N}{T P+F P+T N+F N} (24)
Recall: Recall is the capacity of a predictive algorithm to precisely determine TPs. The proportion of properly identified positive outcomes compared to correctly defined outcomes is how it is defined, which is mathematically represented in below:
Recall =\frac{T P}{T P+F N} (25)
Precision: The ability to determine only the most significant items is an indicator of precision. The meaning of it is the proportion of all positive outcomes to correctly identified affirmative results. The following formula is used to compute this parameter:
Precision =\frac{T P}{T P+F P} (26)
F1-score: To determine the degree of precision of the method, the f1 score is also laid out. Precision and recall of the model are taken hold into account by the f1-score. The formula that follows has been employed to compute it:
F 1- score =\frac{2 \times \text { Precision } \times \text { Recall }}{\text { Precision }+ \text { Recall }} (27)
where, True Positive (TP), True Negative (TN), False Positive (FP), and False Negative (FN). The performance of the suggested VGG16+ResNet50 model is validated to the various variants of plant diseases in Figure 10 and Table 1. The findings of this study show that the suggested developed model has better prediction outcomes and works well for the provided dataset as in Table 2.
Table 1. Performance assessment using PlantVillage data
|
Class |
Precision |
Recall |
F1-Score |
|
Baterial_Spot |
98.9 |
99 |
99.1 |
|
Early_Blight |
98.8 |
98.7 |
98.8 |
|
Healthy |
99 |
98.9 |
98.9 |
|
Late_Blight |
99 |
99 |
99 |
|
Leaf_Mold |
99.1 |
99.1 |
99.1 |
|
Septoria_Spot |
98.8 |
99 |
99 |
|
Spider_Mites |
98.9 |
98.9 |
99 |
|
Target_Spot |
98.7 |
98.8 |
98.8 |
|
Mosaic_Virus |
99 |
99 |
98.9 |
|
Yellow_Leaf |
99.1 |
98.9 |
99 |
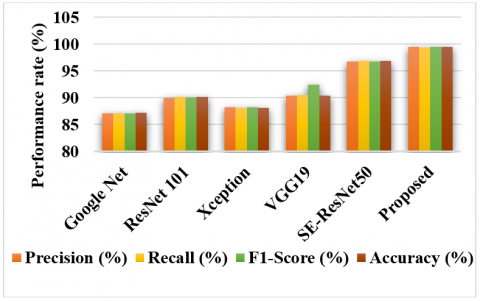
The accuracy of the proposed hybrid model is compared for several kinds of plant leaves in Table 3 and Figure 11. The outcomes show that the suggested hybrid model works effectively by correctly determining the disease class from the available data. Furthermore, Table 4 and Figure 12 present a comparison between the suggested hybrid method and a few of the most recent deep learning architectural models. The hybrid VGG 16+ResNet 50 offers a better accuracy and detection rate by detecting the class of plant disease from the leaf images, according to the overall comparison assessment. Since the primary factor producing better results is the combination of two effective deep learning architectures.
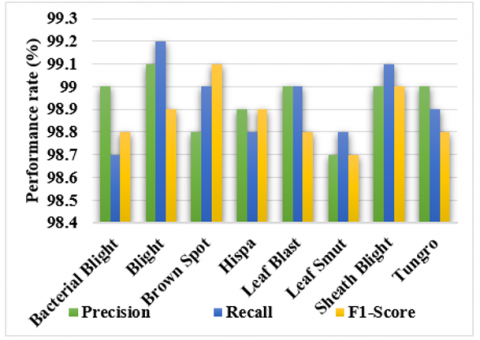
Using a dataset of rice plants, Table 5 and Figure 13 present an accuracy-based comparison of the suggested hybrid VGG16+ResNet 50 models with some of the most advanced deep learning architecture models. Consequently, Table 6 and Figure 14 provide validation of the hybrid learning methodology's overall performance across several disease classes in the rice plant dataset. Based on the findings, it is concluded that, in comparison to recent sophisticated deep learning architecture models, the suggested VGG16+ResNet 50 offers better detection outcomes.
Figure 10. Precision, recall and f1-score analysis using Plant Village dataset
Figure 11. Accuracy with respect to different classes of images in Plant Village data
Figure 12. Comparative study with other deep learning architectures using Plant Village dataset
Figure 13. Accuracy with different deep learning architecture models using rice plant dataset
Table 2. Prediction of plant village data health and age
|
Infected Area: 9.246% Infected Disease: Fungus Age: 51 Days |
Infected Area: 3.97% Infected Disease: Fungus Age: 61 Days |
|
Infected Area: 0% Leaf Class: Healthy Age: 60 Days |
Infected Area: 4.52% Infected Disease: Virus Age: 51 Days |
|
Infected Area: 0.0% Leaf Class: Healthy Age: 68 Days |
Infected Area: 46.6% Leaf Class: Healthy Age: 61 Days |
Table 3. Accuracy
|
Class |
Accuracy |
|
Baterial_Spot |
99 |
|
Early_Blight |
99 |
|
Healthy |
98.9 |
|
Late_Blight |
99.1 |
|
Leaf_Mold |
99.1 |
|
Septoria_Spot |
99 |
|
Spider_Mites |
98.9 |
|
Target_Spot |
98.7 |
|
Mosaic_Virus |
99 |
|
Yellow_Leaf |
99.1 |
Table 4. Overall comparative analysis
|
Architectures |
Precision (%) |
Recall (%) |
F1-Score (%) |
Accuracy (%) |
|
Google Net |
87.16 |
87.09 |
87.12 |
87.27 |
|
ResNet 101 |
89.95 |
90.13 |
90.04 |
90.13 |
|
Xception |
88.25 |
88.14 |
88.19 |
88.16 |
|
VGG19 |
90.39 |
90.47 |
92.43 |
90.42 |
|
SE-ResNet50 |
96.77 |
96.81 |
96.79 |
96.81 |
|
Proposed |
99.48 |
99.38 |
99.42 |
99.5 |
Table 5. Accuracy using rice plant dataset
|
Class |
Accuracy |
|
Solo DenseNet 121 |
97 |
|
Solo Inception V3 |
97 |
|
Solo MobileNet V2 |
94 |
|
Solo ResNet 101 |
96 |
|
Solo ResNet 152V |
93 |
|
Solo Seresnext 101 |
79 |
|
TL DenseNet 121 |
97 |
|
TL SeresNext 101 |
96 |
|
TL EfficientNet |
95 |
|
TL Xception |
92 |
|
Ensemble model |
97.62 |
|
Proposed |
99 |
Table 6. Performance analysis using rice leaf dataset
|
Classes |
Precision |
Recall |
F1-Score |
|
Bacterial Blight |
99 |
98.7 |
98.8 |
|
Blight |
99.1 |
99.2 |
98.9 |
|
Brown Spot |
98.8 |
99 |
99.1 |
|
Hispa |
98.9 |
98.8 |
98.9 |
|
Leaf Blast |
99 |
99 |
98.8 |
|
Leaf Smut |
98.7 |
98.8 |
98.7 |
|
Sheath Blight |
99 |
99.1 |
99 |
|
Tungro |
99 |
98.9 |
98.8 |
Figure 14. Comparative study with other deep learning architectures using rice leaf dataset
The proposed effort aims to propose a new yet unique deep learning technology for plant leaf disease identifying and categorizing. The creation of the VGG16+ResNet 50 hybrid deep learning architecture model, which aims to identify plant leaf diseases, is the paper's original contribution. With the advantages of increased accuracy, quick processing, and the ability to handle increasingly complex images, these are the most popular and widely used CNN architectures. In order to create an automated system for identifying plant leaf disease, the suggested work aims to integrate these two methodologies. The ability to reliably identify the class of leaf disease from the variants of plants and leaves, including fruits and vegetables, is a clear benefit of using this hybridized technology. Performance evaluation is carried out to test and evaluate the suggested hybrid model's efficacy utilizing a range of extensively used open-source datasets and assessment metrics. Furthermore, the impact of the proposed VGG16+ResNet 50 model in plant disease identification and type categorization is assessed by comparing it with a few state-of-the-art machine learning and advanced deep learning architecture models. Popular datasets for performance comparison and measurement, such as Plant Village, Plant Doc, Field Plant, and Rice Plant, are used in this work. Based on the overall comparison assessment, the results show that the hybrid VGG 16+ResNet 50 delivers a greater accuracy and detection rate by detecting the class of plant disease from the leaf images. Given that the combination of two powerful deep learning architectures is the main factor resulting in superior results. In future, we plan to continue with the application of the optimized hybrid model to mobile applications and edge devices. These developments could allow farmers to get instant information on the status of the plants and hence help in the implementation of precision agriculture and may also decrease crop loss due to diseases.
[1] Sahu, S.K., Pandey, M. (2023). An optimal hybrid multiclass SVM for plant leaf disease detection using spatial Fuzzy C-Means model. Expert Systems with Applications, 214: 118989. https://doi.org/10.1016/j.eswa.2022.118989
[2] Sharma, V., Tripathi, A.K., Mittal, H. (2023). DLMC-Net: Deeper lightweight multi-class classification model for plant leaf disease detection. Ecological Informatics, 75: 102025. https://doi.org/10.1016/j.ecoinf.2023.102025
[3] Singh, P., Singh, P., Farooq, U., Khurana, S.S., Verma, J.K., Kumar, M. (2023). CottonLeafNet: Cotton plant leaf disease detection using deep neural networks. Multimedia Tools and Applications, 82(24): 37151-37176. https://doi.org/10.1007/s11042-023-14954-5
[4] Yeswanth, P.V., Deivalakshmi, S., George, S., Ko, S.B. (2023). Residual skip network-based super-resolution for leaf disease detection of grape plant. Circuits, Systems, and Signal Processing, 42(11): 6871-6899. https://doi.org/10.1007/s00034-023-02430-2
[5] Towfek, S.K., Khodadadi, N. (2023). Deep convolutional neural network and metaheuristic optimization for disease detection in plant leaves. Journal of Intelligent Systems and Internet of Things, 10(1): 66-75. http://doi.org/10.54216/JISIoT.100105
[6] Dhakshayani, J., Surendiran, B. (2023). GF-CNN: An enhanced deep learning model with Gabor filters for maize disease classification. SN Computer Science, 4(5): 538. https://doi.org/10.1007/s42979-023-01988-7
[7] Rao, A., Kulkarni, S.B. (2023). RETRACTED: A hybrid approach for plant leaf disease detection and classification using digital image processing methods. International Journal of Electrical Engineering & Education, 60(1_suppl): 3428-3446. http://dx.doi.org/10.1177/0020720920953126
[8] Chowdhury, M.E., Rahman, T., Khandakar, A., Ayari, M.A., Khan, A.U., Khan, M.S., Al-Emadi, N., Reaz, M.B.I., Islam, M.T., Ali, S.H.M. (2021). Automatic and reliable leaf disease detection using deep learning techniques. AgriEngineering, 3(2): 294-312. https://doi.org/10.3390/agriengineering3020020
[9] Li, L., Zhang, S., Wang, B. (2021). Plant disease detection and classification by deep learning-A review. IEEE Access, 9: 56683-56698. https://doi.org/10.1109/ACCESS.2021.3069646
[10] Jasim, M.A., Al-Tuwaijari, J.M. (2020). Plant leaf diseases detection and classification using image processing and deep learning techniques. In 2020 International Conference on Computer Science and Software Engineering (CSASE), Duhok, Iraq, pp. 259-265. http://doi.org/10.1109/CSASE48920.2020.9142097
[11] Mahum, R., Munir, H., Mughal, Z.U.N., Awais, M., Sher Khan, F., Saqlain, M., Mahamad, S., Tlili, I. (2023). A novel framework for potato leaf disease detection using an efficient deep learning model. Human and Ecological Risk Assessment: An International Journal, 29(2): 303-326. https://doi.org/10.1080/10807039.2022.2064814
[12] Vishnoi, V.K., Kumar, K., Kumar, B. (2022). A comprehensive study of feature extraction techniques for plant leaf disease detection. Multimedia Tools and Applications, 81(1): 367-419. https://doi.org/10.1007/s11042-021-11375-0
[13] Tugrul, B., Elfatimi, E., Eryigit, R. (2022). Convolutional neural networks in detection of plant leaf diseases: A review. Agriculture, 12(8): 1192. https://doi.org/10.3390/agriculture12081192
[14] Pandian, J.A., Kanchanadevi, K., Kumar, V.D., Jasińska, E., Goňo, R., Leonowicz, Z., Jasiński, M. (2022). A five convolutional layer deep convolutional neural network for plant leaf disease detection. Electronics, 11(8): 1266. https://doi.org/10.3390/electronics11081266
[15] Khanna, M., Singh, L.K., Thawkar, S., Goyal, M. (2024). PlaNet: A robust deep convolutional neural network model for plant leaves disease recognition. Multimedia Tools and Applications, 83(2): 4465-4517. https://doi.org/10.1007/s11042-023-15809-9
[16] Stephen, A., Punitha, A., Chandrasekar, A. (2024). Optimal deep generative adversarial network and convolutional neural network for rice leaf disease prediction. The Visual Computer, 40(2): 919-936. https://doi.org/10.1007/s00371-023-02823-z
[17] Moupojou, E., Tagne, A., Retraint, F., Tadonkemwa, A., Wilfried, D., Tapamo, H., Nkenlifack, M. (2023). FieldPlant: A dataset of field plant images for plant disease detection and classification with deep learning. IEEE Access, 11: 35398-35410. https://doi.org/10.1109/ACCESS.2023.3263042
[18] Ulutaş, H., Aslantaş, V. (2023). Design of efficient methods for the detection of tomato leaf disease utilizing proposed ensemble CNN model. Electronics, 12(4): 827. https://doi.org/10.3390/electronics12040827
[19] Ahad, M.T., Li, Y., Song, B., Bhuiyan, T. (2023). Comparison of CNN-based deep learning architectures for rice diseases classification. Artificial Intelligence in Agriculture, 9: 22-35. https://doi.org/10.1016/j.aiia.2023.07.001
[20] Peyal, H.I., Nahiduzzaman, M., Pramanik, M.A.H., Syfullah, M.K., Shahriar, S.M., Sultana, A., Ahsan, M., Haider, J., Khandakar, A., Chowdhury, M.E. (2023). Plant disease classifier: Detection of dual-crop diseases using lightweight 2D CNN architecture. IEEE Access, 11: 110627-110643. https://doi.org/10.1109/ACCESS.2023.3320686
[21] Singh, V., Chug, A., Singh, A.P. (2023). Classification of beans leaf diseases using fine tuned CNN model. Procedia Computer Science, 218: 348-356. https://doi.org/10.1016/j.procs.2023.01.017
[22] Hu, B., Jiang, W., Zeng, J., Cheng, C., He, L. (2023). FOTCA: Hybrid transformer-CNN architecture using AFNO for accurate plant leaf disease image recognition. Frontiers in Plant Science, 14: 1231903. https://doi.org/10.3389/fpls.2023.1231903
[23] Lanjewar, M.G., Parab, J.S. (2024). CNN and transfer learning methods with augmentation for citrus leaf diseases detection using PaaS cloud on mobile. Multimedia Tools and Applications, 83(11): 31733-31758. https://doi.org/10.1007/s11042-023-16886-6
[24] Ajra, H., Nahar, M.K., Sarkar, L., Islam, M.S. (2020). Disease detection of plant leaf using image processing and CNN with preventive measures. In 2020 Emerging Technology in Computing, Communication and Electronics (ETCCE), Bangladesh, pp. 1-6. https://doi.org/10.1109/ETCCE51779.2020.9350890
[25] Falaschetti, L., Manoni, L., Di Leo, D., Pau, D., Tomaselli, V., Turchetti, C. (2022). A CNN-based image detector for plant leaf diseases classification. HardwareX, 12: e00363. https://doi.org/10.1016/j.ohx.2022.e00363
[26] Tejaswini, P., Singh, P., Ramchandani, M., Rathore, Y.K., Janghel, R.R. (2022). Rice leaf disease classification using CNN. IOP Conference Series: Earth and Environmental Science, 1032(1): 012017. http://dx.doi.org/10.1088/1755-1315/1032/1/012017
[27] Kurmi, Y., Saxena, P., Kirar, B.S., Gangwar, S., Chaurasia, V., Goel, A. (2022). Deep CNN model for crops’ diseases detection using leaf images. Multidimensional Systems and Signal Processing, 33(3): 981-1000. https://doi.org/10.1007/s11045-022-00820-4
[28] Karthik, R., Hariharan, M., Anand, S., Mathikshara, P., Johnson, A., Menaka, R. (2020). Attention embedded residual CNN for disease detection in tomato leaves. Applied Soft Computing, 86: 105933. https://doi.org/10.1016/j.asoc.2019.105933
[29] Asif, M.K.R., Rahman, M.A., Hena, M.H. (2020). CNN based disease detection approach on potato leaves. In 2020 3rd International Conference on Intelligent Sustainable Systems (ICISS), Thoothukudi, India, pp. 428-432. https://doi.org/10.1109/ICISS49785.2020.9316021
[30] Liu, Y., Gao, G., Zhang, Z. (2022). Crop disease recognition based on modified light-weight CNN with attention mechanism. IEEE Access, 10: 112066-112075. https://doi.org/10.1109/ACCESS.2022.3216285
[31] Zhang, Y., Wa, S., Liu, Y., Zhou, X., Sun, P., Ma, Q. (2021). High-accuracy detection of maize leaf diseases CNN based on multi-pathway activation function module. Remote Sensing, 13(21): 4218. https://doi.org/10.3390/rs13214218
[32] Karlekar, A., Seal, A. (2020). SoyNet: Soybean leaf diseases classification. Computers and Electronics in Agriculture, 172: 105342. https://doi.org/10.1016/j.compag.2020.105342
[33] Agarwal, M., Singh, A., Arjaria, S., Sinha, A., Gupta, S. (2020). ToLeD: Tomato leaf disease detection using convolution neural network. Procedia Computer Science, 167: 293-301. https://doi.org/10.1016/j.procs.2020.03.225
[34] Hassan, S.M., Maji, A.K., Jasiński, M., Leonowicz, Z., Jasińska, E. (2021). Identification of plant-leaf diseases using CNN and transfer-learning approach. Electronics, 10(12): 1388. https://doi.org/10.3390/electronics10121388
[35] Gokulnath, B.V. (2021). Identifying and classifying plant disease using resilient LF-CNN. Ecological Informatics, 63: 101283. https://doi.org/10.1016/j.ecoinf.2021.101283
[36] Yao, J., Tran, S.N., Garg, S., Sawyer, S. (2024). Deep learning for plant identification and disease classification from leaf images: Multi-prediction approaches. ACM Computing Surveys, 56(6): 1-37. https://doi.org/10.1145/3639816
[37] Kc, K., Yin, Z., Li, D., Wu, Z. (2021). Impacts of background removal on convolutional neural networks for plant disease classification in-situ. Agriculture, 11(9): 827. https://doi.org/10.3390/agriculture11090827
[38] Jadhav, S.B., Udupi, V.R., Patil, S.B. (2021). Identification of plant diseases using convolutional neural networks. International Journal of Information Technology, 13(6): 2461-2470. https://doi.org/10.1007/s41870-020-00437-5
[39] Islam, A., Islam, R., Haque, S.R., Islam, S.M., Khan, M.A.I. (2021). Rice leaf disease recognition using local threshold based segmentation and deep CNN. International Journal of Intelligent Systems and Applications, 10(5): 35-45. https://doi.org/10.5815/ijisa.2021.05.04
[40] Agrawal, M.M., Agrawal, S. (2020). Rice plant diseases detection & classification using deep learning models: A systematic review. Agricultural and Food Sciences, Computer Science, 7(11): 4376-4390. https://doi.org/10.1049/icp.2023.1783
[41] Nawaz, M., Nazir, T., Javed, A., Masood, M., Rashid, J., Kim, J., Hussain, A. (2022). A robust deep learning approach for tomato plant leaf disease localization and classification. Scientific Reports, 12(1): 18568. https://doi.org/10.1038/s41598-022-21498-5