Huiling Xiang*![]() | Min Lou
| Min Lou![]()
© 2025 The authors. This article is published by IIETA and is licensed under the CC BY 4.0 license (http://creativecommons.org/licenses/by/4.0/).
OPEN ACCESS
With the rapid development of global capital markets, the impact of international capital flows on the global economy has become increasingly significant. Effectively extracting valuable information from related image data to assist in the prediction and analysis of capital flow trends has become an important research direction in the financial field. Deep learning, as a powerful data analysis tool, has made significant progress in image processing, feature extraction, and trend prediction in recent years. However, existing methods often encounter issues such as inaccurate feature extraction and limited model generalization when dealing with complex financial image data, which restricts their practical application. To address these challenges, this paper proposes a deep learning-based framework for analyzing international capital flow images, aiming to improve the accuracy and efficiency of feature extraction from capital flow-related images. The research in this paper is centered around two main aspects: first, the design of a deep learning framework tailored to the specific needs of international capital flow image processing, selecting appropriate algorithm architectures; second, the construction of a bar-pooling module and a bar-attention module for the recognition of price trend line features, with the goal of enhancing the model's performance in price trend prediction. Through these innovative designs, this paper contributes to enhancing the capability of deep learning models in processing financial image data and provides new ideas and methods for the analysis of international capital flows.
international capital flows, deep learning, image processing, feature extraction, price trend line, bar-pooling module, bar-attention module
With the acceleration of global economic integration, international capital flows play an increasingly important role in global markets [1-3]. Capital flows not only influence the formulation and implementation of national economic policies but also have a profound impact on global financial stability, asset price fluctuations, and market risk management [4-6]. In recent years, with the rapid development of data science technologies, research on capital flows based on images and graphs has gradually become a hot topic in academia and the financial field, especially through deep learning technologies to conduct in-depth analysis of financial image data, which can provide more accurate and intuitive market trend predictions [7-9]. However, how to efficiently extract and analyze valuable information from complex financial images remains a challenge that needs to be addressed.
Currently, the research on analyzing international capital flow-related images using deep learning algorithms is gradually deepening, and this field has significant theoretical and practical implications. From a theoretical perspective, in-depth analysis of capital flow image features through deep learning can provide more accurate models for dynamic changes in financial markets and offer data support for macroeconomic forecasting and risk assessment [10-14]. From a practical perspective, precise capital flow prediction can effectively assist global investors, financial institutions, and government decision-makers in market deployment, risk management, and policy adjustment. Therefore, conducting research on capital flow image analysis based on deep learning algorithms can not only enrich the existing financial theory system but also provide more reliable decision-making support for practical market operations.
However, existing research methods still have some shortcomings in image processing and feature extraction. Traditional image analysis methods typically rely on manual feature extraction, lacking automation and efficiency. At the same time, many deep learning models struggle to accurately capture the detailed features of images when dealing with complex images, particularly when recognizing price trend lines in capital flow [15-18]. Furthermore, most existing algorithms lack customized designs for specific financial data image features, resulting in weak generalization ability of the models, which cannot adapt well to changes in image features under different market environments [19-22]. Therefore, improving the accuracy of image feature extraction and the adaptability of algorithms is a key issue in current research.
To address these challenges, this paper proposes a deep learning-based image analysis framework aimed at enhancing the feature extraction and analysis capabilities of international capital flow-related images. The main research content of this paper includes two parts: first, the selection of a deep learning algorithm framework for international capital flow-related image processing, proposing an efficient and highly adaptable deep learning framework for different types of financial image data; second, for price trend line feature recognition, a bar-pooling module and bar-attention module are constructed to improve the model's accuracy and robustness in recognizing price trend changes. Through these innovative designs, this paper not only enriches the application of deep learning in financial image analysis but also provides effective technical support for capital flow prediction and decision-making, which has significant academic value and practical significance.
The features of international capital flow-related images typically include multiple dimensions such as price fluctuations, capital flows, trading volumes, and market sentiment. In financial markets, capital flow information is presented through various charts and images, such as candlestick charts, line charts, and price trend charts. These images reflect the dynamic changes of the market and investor decision-making behavior. By extracting features from these images, underlying trends and patterns behind capital flows can be revealed. For example, changes in price trends reflect the supply and demand relationship in the market, while the inflow and outflow of capital reflect market risk preferences or risk-aversion sentiment. Additionally, changes in trading volume and capital flow also present different graphical features on the images, which are important for market trend prediction and risk assessment.
Among these, the price trend line feature is one of the most critical features in international capital flow-related images. The price trend line typically reflects the directionality and persistence of capital flows and is an important basis for analyzing market trends and predicting price movements. In images, the formation and change of price trend lines often accompany major market changes, such as bull markets, bear markets, or price reversals. Therefore, accurately identifying and extracting price trend line features is crucial for predicting the future direction of the market. Deep learning algorithms are particularly suited to processing complex image data, as they can automatically identify potential patterns in price trends and make trend predictions based on this.
Based on the unique advantages of the UNet network in image processing and feature extraction, this paper selects it as the foundational architecture for deep learning algorithms. The UNet network structure enhances the idea of high-low channel feature fusion. By fully merging low-level features at each layer, it can extract more useful information from every detail of the image. In financial image analysis, especially for the extraction of price trend line features, market price fluctuations often present as an interweaving of high-frequency and low-frequency information in images. Price trend line features often lie between these pieces of information, containing substantial local fluctuations and global trends. The design of UNet, through skip connections, merges features from different layers, allowing the network to capture global trend features while retaining low-level detail information. This feature fusion approach is especially suited for handling the highly complex and ever-changing price trend line features in financial images.
When performing price trend line feature extraction, the UNet network adopts a channel concatenation method rather than direct addition, providing the network with greater flexibility and selection space. This is crucial for analyzing international capital flow image data, particularly in capturing price trend lines. Price trends in financial images often contain complex local fluctuations and long-term trends. If different layer features were processed by simple addition, detailed information could be lost or important information inadequately represented. The channel concatenation mechanism of UNet allows the network to selectively concatenate different channels in each region, enabling it to precisely focus on key parts of the price trend line while preserving important contextual information. This strategy allows UNet to flexibly adapt to different market environments when facing complex capital flow images, improving the accuracy and robustness of price trend line feature extraction.
Accurate recognition of price trend lines is one of the core tasks in feature extraction and analysis of international capital flow-related images. However, traditional spatial pooling methods have certain limitations when dealing with price trend line features. Conventional pooling operations, during the process of dimensionality reduction, tend to lose important detailed information of price trend lines, especially near market price fluctuations or trend reversal points. This loss of information can make it difficult for the model to accurately capture the true trends of capital flows. Therefore, this paper introduces a bar-pooling mechanism, leveraging its ability to extract features in different directions to more precisely recognize price trend lines. However, relying solely on bar pooling for feature extraction still has limitations, particularly in complex market environments where different trend lines may be influenced by multiple market factors, causing variations in their form. To further enhance the model's ability to capture price trend line features, this paper introduces an attention mechanism and constructs a bar-attention module. The core goal of this module is to increase the network's focus on key trend information and effectively suppress interference from background noise or irrelevant information.
3.1 Bar-pooling-based module
When extracting and analyzing price trend line features in international capital flow-related images, a major issue faced by traditional convolutional neural networks (CNNs) and pooling operations is the limitation of receptive fields, particularly when processing complex market price trend images. Price trend lines in financial images usually exhibit a relatively simple directional change, presenting as long-duration trend fluctuations, which may manifest as elongated structures or discontinuous curves in the image, such as in stock price trend charts or foreign exchange trend charts. Conventional square pooling windows, such as N×N pooling, can capture some local information, but when faced with these elongated and directionally strong features, they often struggle to effectively extract the key price trend line information. Square pooling windows have limited contextual capturing ability, making them prone to incorporating irrelevant information, especially when capturing long-distance trend changes, where they can be affected by noise. To address this issue, the bar-pooling module is better suited for the price trend line extraction task. Its long and narrow pooling window can aggregate features along the direction of the price trend, thus improving the ability to capture long-distance, strongly directional price trend lines while avoiding the information pollution caused by traditional pooling operations.
Figure 1. Schematic diagram of the bar-pooling module for price trend line feature recognition
Compared to traditional square spatial pooling methods, bar-pooling has significant advantages. On the one hand, bar-pooling uses a long kernel shape along one spatial dimension, allowing it to capture the long-range dependencies of price trend lines over extended time spans. In financial images, price trend lines often exhibit long-duration fluctuation patterns, involving trend changes across multiple trading days, weeks, or even longer periods. Traditional square pooling methods, due to their fixed window shape, are limited by local information and have difficulty effectively capturing these long-term trend features. In contrast, bar-pooling elongates the pooling window along one dimension, enabling the model to aggregate long-range dependencies along the time dimension. This helps to capture the overall changes in price trends, improving the stability and accuracy of trend recognition. On the other hand, bar-pooling maintains a narrow kernel shape along the other spatial dimension, which plays a key role in extracting local features of the price trend line. In financial market price images, trend lines are often thin and directional, and if the pooling window is too large, it may introduce excessive irrelevant background information, reducing the model's sensitivity to the trend line. The narrow kernel structure of bar-pooling effectively focuses on the local features of the price trend line while minimizing interference from unrelated areas. Compared to traditional spatial pooling methods, bar-pooling is capable of capturing long-range dependencies while still maintaining precise extraction of local details. This enables the model to focus on the overall trend of price movements and also detect key inflection points or small trend changes in the short term. The module schematic is shown in Figure 1.
Standard spatial average pooling operations are typically used to capture long-range contextual information in an image. However, their fixed square pooling window often includes background noise or irrelevant areas when processing irregularly shaped or highly directional features, thus impacting the accuracy of feature extraction. Specifically, let a be a two-dimensional input tensor with spatial height G and width Q. The average pooling layer needs a pooling spatial range of g×q, and the output after pooling is b, where each spatial position of b corresponds to a pooling window of size g×q. Let 0≤up<Gp, and 0≤kp<Qp, the formal pooling operation can be written as:
bup,kp=1g×q∑0≤u<g∑0≤k<qaup×g+u,kp×q+k (1)
In the recognition of price trend lines, the trend line often appears as a slender, strip-like structure, especially when spanning over longer periods of price fluctuations. If traditional square pooling methods are used, the pooling window may include a large number of regions unrelated to the price trend, such as local fluctuations of price oscillations or other irrelevant features in the image. In contrast, bar-pooling, by using long rectangular pooling windows along the vertical or horizontal direction, can more precisely aggregate features along the direction of the trend line, avoiding irrelevant regions captured due to the large receptive field in traditional methods, thereby improving the effectiveness of trend line feature extraction.
Bar-pooling aggregates all feature values in a row or column along a certain dimension, ensuring a reasonable integration of both local information and global trends of the price trend line. In images related to international capital flows, price fluctuations often exhibit regular directional changes. Therefore, bar-pooling not only maintains a perception of global trends but also provides precise capture of local details. For example, in stock or foreign exchange markets, price fluctuations often present relatively stable upward or downward trends during certain periods, and bar-pooling, through its long rectangular pooling window, can effectively capture such trend changes without being disturbed by other short-term fluctuations. For a two-dimensional tensor a, the spatial range of bar-pooling is (G,1) or (1,Q). Therefore, the output of horizontal bar-pooling is bg :
bgu=1Q∑0≤k<Qau,k (2)
Similarly, the output of vertical bar-pooling is bn:
bnk=1G∑0≤u<Gau,k (3)
3.2 Bar pooling module
The goal of this paper is to extend the receptive field of the backbone network through the design of bar pooling, to better capture long-term price fluctuations and trends. To this end, a novel bar pooling module based on both horizontal and vertical pooling operations is proposed. Specifically, the bar pooling module consists of two parallel paths: one path focuses on horizontal pooling operations, and the other path focuses on vertical pooling operations. In this way, the bar pooling module can extract long-distance contextual information separately along the time dimension and the price dimension. In the bar pooling module, after encoding the horizontal and vertical information, we use one-dimensional convolution operations to modulate the output of each pooling path, in order to finely adjust the current position and its adjacent features. This step is particularly important for the fine extraction of price trend lines, as price fluctuations in financial images often contain subtle trend changes that may influence the overall market direction. By weighting and balancing these encoded features, the bar pooling module can effectively suppress the interference of local noise and focus on the core features of price trends, thus improving the accuracy of the features. Finally, by combining the outputs of the horizontal and vertical paths, the bar pooling module forms an output feature map that contains richer global prior information. Specifically, let a be the input tensor, and Z represent the number of channels. First, a is input into two parallel paths, each containing horizontal or vertical bar pooling layers, and further processed by a one-dimensional convolution layer with a kernel size of 3, to obtain bg and bn, thus modulating the current position and its adjacent features. To obtain the output ccc that contains more useful global priors, we choose to combine bg and bn:
bz,u,k=bgz,u+bnz,k (4)
Assuming element-wise multiplication is denoted by SC(*), the sigmoid function is denoted by δ, and the 1×1 convolution is denoted by d, the output c is:
c=SC(aδ(d(b))) (5)
For the recognition of price trend lines, this global prior information is very important because it helps the model understand the overall structure of the trend and capture longer-term market dynamics. Therefore, with the construction of this bar pooling module, the model can not only extract features from local price fluctuations but also integrate remote contexts to better recognize and predict price trends, thus enhancing the analysis capability of international capital flow-related images.
3.3 Hybrid pooling module
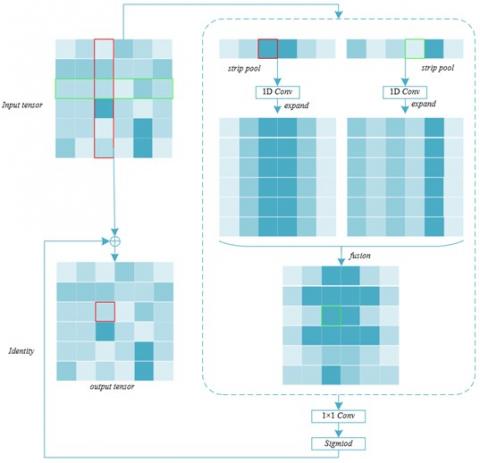
The features of price trend lines are often influenced by multiple factors, such as market volatility, policy changes, economic cycles, etc., leading to complex shapes and a lot of noise. In this case, a single pooling method may struggle to balance different levels of contextual information, while the hybrid pooling module, by combining the advantages of standard spatial pooling and bar pooling, can perform feature aggregation at different scales and directions. Specifically, the hybrid pooling module uses pooling operations with different kernel shapes, enabling the model to simultaneously focus on both local trend changes and global trend patterns, thus constructing more discriminative feature representations. This ability is crucial for identifying key trends in international capital flows, such as long-term uptrends, downtrends, or market consolidation areas, as it ensures that the model can still accurately capture the core features of price trend lines under complex backgrounds. Moreover, in image analysis tasks involving various market disturbance factors, the hybrid pooling module can effectively reduce the impact of background noise and improve the quality of price trend line feature extraction. For example, when processing trend images from the stock market or foreign exchange market, price trend lines often mix with technical indicators, volume charts, market signals, and other information, while traditional pooling methods may be disturbed by these complex backgrounds, leading to less accurate extraction of trend line features. The hybrid pooling module, by combining the long-distance feature capture ability of bar pooling with the local context integration capability of standard spatial pooling, can enhance the core information of trend lines while suppressing the interference of irrelevant background information. Figure 2 illustrates the architecture of the hybrid pooling module for price trend line feature recognition.
Figure 2. Hybrid pooling module for price trend line feature recognition
In the process of price trend line feature extraction and analysis for images related to international capital flows, the construction of the hybrid pooling module relies on its ability to capture both short-range and long-range dependencies simultaneously. First, to effectively capture long-range dependencies, this paper introduces the bar pooling module, which performs both horizontal and vertical pooling operations to expand the receptive field along the time and price dimensions. In this way, the model can recognize the overall changes in price trend lines over different time spans and price fluctuation ranges. For example, some capital markets may experience large fluctuations in the short term, but their trends may show sustained increases or decreases over longer periods. Through the design of bar pooling, the model can span these fluctuations and capture long-range price correlations, providing more accurate global information for subsequent trend recognition. In parallel with this, short-range dependency capture is achieved through the pyramid pooling module. The pyramid pooling module uses standard spatial pooling layers to extract local contextual information, ensuring that the model can accurately grasp short-term trend changes when faced with complex market backgrounds, thus avoiding information loss that may arise from an over-reliance on long-range pooling.
In the construction of the hybrid pooling module, to further improve efficiency and streamline parameters, this paper proposes optimization through residual modules and the "bottleneck" structure. Each submodule is preceded by a 1×1 convolutional layer for channel reduction, which reduces the computational load and improves the operational efficiency of the model. Subsequently, feature fusion is performed using a 3×3 convolutional layer, and by connecting the outputs of the two modules, the feature information from both short-range and long-range dependencies is further integrated. This structure not only ensures computational efficiency but also enhances the model’s ability to recognize price trend lines. Additionally, the "bottleneck" structure effectively prevents overfitting, allowing the model to recognize more refined and reliable price trend features in international capital flow images. Furthermore, using channel expansion ensures that more feature dimensions are retained across layers, further enhancing the model's sensitivity and accuracy to price changes in complex financial images.
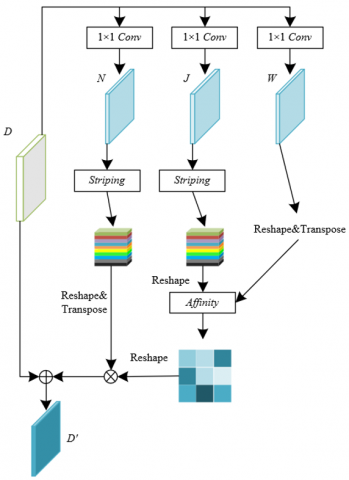
The recognition of price trend lines typically requires considering data over long-time spans, but traditional convolutional neural networks, due to their local receptive field limitations, struggle to capture trend information over longer distances. Therefore, by introducing the bar pooling operation and combining it with an attention mechanism, the constructed bar attention module is able to globally encode information along both the time and price fluctuation dimensions, effectively modeling remote dependencies. For instance, in international capital markets, long-term trends of capital inflows or outflows often influence future price movements, whereas traditional methods may only focus on local fluctuations, leading to less accurate trend recognition. The bar attention module, based on the bar pooling, introduces an attention mechanism that highlights attention to key areas of the trend line while suppressing irrelevant background information, making the feature extraction of price trends more accurate and stable. Figure 3 illustrates the architecture of the bar attention module for price trend line feature recognition.
Figure 3. Bar attention module for price trend line feature recognition
The core principle of this module is to maintain contextual consistency in the vertical direction through affinity operations and to further extract global affinity information along the time dimension. For price trend line feature extraction, market fluctuations and capital flows often exhibit long-term dependencies, especially in the time and price dimensions. This module reduces the input feature map D by using a 1×1 convolution to obtain new feature maps W and J, and then performs vertical pooling through bar operations, thereby maintaining the consistency of the price trend in the vertical direction. This operation helps capture the global changes in the trend line. When the pooling window size is G×1, it is a vertical bar pool, and when the pooling window is 1×Q, it is a horizontal bar pool. In addition, the module also uses affinity operations to further strengthen the global relationship modeling along the horizontal axis, allowing each pixel to interact globally with other pixels, thereby more accurately identifying small fluctuations and changes in the price trend.
Specifically, the local features W and J are reshaped, where V =G×Q represents the number of pixels. Furthermore, affinity operations are performed between WS and J, and attention mapping X is computed along the horizontal direction. Let the correlation between Wu and Jk be represented by Xk,u, then:
Xk,u=exp(Wu⋅Jk)∑Vu=1exp(Wu⋅Jk) (6)
The introduction of bar operations allows this module to balance computational efficiency and accuracy. In traditional self-attention mechanisms, the computational complexity typically grows quadratically, which is particularly unsuitable for high-resolution image analysis. However, through the bar pooling operation, this module significantly reduces the computational load, especially when processing images such as international capital flow images, which contain a large amount of detail and time span. This ensures that important price trend features are still captured under lower computational overhead. Specifically, the module performs bar pooling on the input feature map D, so that both vertical and horizontal information in the image can be effectively encoded along different dimensions. Finally, through matrix multiplication and element-based summation, all information is fused into an accurate output result. Specifically, the feature map D is input into another convolution layer with a kernel size of 1×1 to generate feature map N. N can be obtained through similar operations to get a vertical dimensional representation map with spatial dimensions Z×1×Q. Further, a matrix multiplication is performed between X and NS, and the result is reshaped into E. Finally, an element-based summation operation is performed on the input feature map D, and the feature vector at position k of the output feature map D' is represented as Dk', then:
D′k=∑Vu=1Xk,u⋅Nu+Dk (7)
When performing price trend line feature extraction and analysis on international capital flow-related images, the bar attention module has distinct advantages, especially in capturing long-range dependencies and directional consistency in images. First, the module combines all pixels along the same spatial dimension through bar pooling operations, which is very suitable for processing price trend line feature recognition. In capital market images, price trends often exhibit significant directional features along both the time and price dimensions, especially in response to sudden economic events and long-term capital flows. By performing bar pooling in the vertical or horizontal direction, the module can focus on capturing the anisotropic features of the trend line. This directional consistency allows the module to provide strong contextual modeling capabilities when processing price trend lines. For example, the vertical module can focus on capturing the global context of price fluctuations along the price dimension (vertical direction), while the horizontal module can effectively capture long-range dependencies in the time series. This targeted feature capture approach allows the module to retain key details of market changes during price trend recognition, thereby providing more precise support for trend prediction.
From the data in Table 1, it can be seen that the deep learning framework proposed in this study demonstrates a significant improvement in feature extraction capabilities for international capital flow-related images under the effect of different modules. The baseline model has a mean intersection over union (MIoU) of 36.25% and an overall accuracy (Acc) of 76.59%. With the addition of the bar pooling module, the MIoU increases to 41.27%, and Acc rises to 78.21%, indicating that this module effectively enhances feature extraction. Further introduction of the hybrid pooling module results in a further increase in MIoU to 42.69% and Acc to 78.42%, suggesting that the hybrid pooling design helps capture both local and global information of price trends more comprehensively. Moreover, the introduction of the bar attention module in different directions shows a more significant improvement. Specifically, after adding the horizontal bar attention module, MIoU reaches 42.58%, and Acc rises to 81.23%, while the vertical bar attention module boosts MIoU to 44.36% and Acc to the highest value of 84.36%, indicating that the module has a stronger ability to identify key features for extracting price trend changes.
Table 1. Bar pooling effect evaluation
|
Settings |
MIoU |
Acc |
|
Baseline Model |
36.25% |
76.59% |
|
+ Bar Pooling Module |
41.27% |
78.21% |
|
+ Hybrid Pooling Module |
42.69% |
78.42% |
|
+ Bar Attention Module (horizontal) |
42.58% |
81.23% |
|
+ Bar Attention Module (vertical) |
44.36% |
84.36% |
Table 2. Bar pooling module analysis
|
Settings |
Position |
MIoU |
Acc |
|
Baseline Model |
/ |
36.25% |
76.25% |
|
+ Bar Pooling Module |
Position 1 |
37.51% |
77.89% |
|
+ Bar Pooling Module |
Position 2 |
37.23% |
77.21% |
|
+Squeeze-and-Excitation Module |
Position 1+2 |
36.21% |
77.26% |
|
+ Bar Pooling Module |
Position 1+2 |
42.16% |
78.46% |
According to the data in Table 2, the bar pooling module has different effects on model performance depending on its placement. In the baseline model, the MIoU is 36.25%, and accuracy (Acc) is 76.25%. After adding the bar pooling module, the placement at position 1 increases the MIoU to 37.51% and Acc to 77.89%, showing some improvement. For the placement at position 2, although there is a slight increase in MIoU and Acc to 37.23% and 77.21%, respectively, the improvement is not as significant as that at position 1. When the Squeeze-and-Excitation module is introduced at both positions 1 and 2, the MIoU slightly decreases to 36.21% and Acc to 77.26%. However, when the bar pooling module is applied at both positions 1 and 2, the model's performance is significantly improved, with the MIoU reaching 42.16% and Acc increasing to 78.46%, showing a substantial enhancement in the model's effectiveness.
Table 3. Improvement of the bar pooling module on deep learning algorithm architecture
|
Model |
Accuracy |
Precision |
Recall |
F1_Measure |
|
UNet |
0.965 |
0.885 |
0.887 |
0.875 |
|
UNet+Squeeze-and-Excitation Module |
0.964 |
0.896 |
0.889 |
0.873 |
|
Une + Bar Pooling Module |
0.978 |
0.889 |
0.942 |
0.924 |
|
Une + Bar Attention Module |
0.982 |
0.921 |
0.953 |
0.946 |
From the data in Table 3, it can be seen that the bar pooling module has a significant impact on improving the deep learning algorithm architecture. In the baseline setting of the UNet model, the model achieves an accuracy of 0.965, precision of 0.885, recall of 0.887, and an F1 score of 0.875. After introducing the Squeeze-and-Excitation module, the accuracy slightly decreases to 0.964, but both precision and recall increase slightly to 0.896 and 0.889, respectively, with the F1 score at 0.873. After adding the bar pooling module, the performance of the UNet model significantly improves, with an accuracy of 0.978, recall rising to 0.942, and the F1 score reaching 0.924. Further adding the bar attention module improves the accuracy to 0.982, precision to 0.921, recall to 0.953, and the F1 score to 0.946, showing the module's maximum advantage in enhancing model performance.
Table 4. Training results of the proposed algorithm for price trend lines under different trading cycles and dimensions
|
Cycle |
Dimension |
Recall |
Specificity |
Accuracy |
MCC |
|
7 |
100 |
77.5 |
76.3 |
76.2 |
0.61 |
|
14 |
100 |
83.2 |
82.4 |
81.2 |
0.725 |
|
21 |
100 |
85.4 |
85.7 |
85.6 |
0.779 |
|
7 |
100 |
75.6 |
75.6 |
76.3 |
0.625 |
|
14 |
100 |
82.4 |
81.2 |
81.4 |
0.724 |
|
21 |
100 |
84.6 |
84.3 |
84.6 |
0.745 |
Table 5. Summary of results for price trend lines under the proposed algorithm's training
|
Volume |
Trading Cycle |
Dimension |
Recall |
Specificity |
Accuracy |
MCC |
|
Without |
7 |
100 |
77 |
76.5 |
76.2 |
0.61 |
|
14 |
100 |
81.2 |
82.3 |
81 |
0.725 |
|
|
21 |
100 |
85.6 |
85.4 |
84.5 |
0.774 |
|
|
7 |
100 |
74.5 |
75.3 |
76.2 |
0.625 |
|
|
14 |
100 |
82.3 |
81 |
81.2 |
0.723 |
|
|
21 |
100 |
84.6 |
84.2 |
84.3 |
0.741 |
|
|
With |
7 |
100 |
76.2 |
78.9 |
76.2 |
0.625 |
|
14 |
100 |
82.3 |
81.5 |
81.2 |
0.731 |
|
|
21 |
100 |
87.5 |
83.2 |
88.9 |
0.779 |
|
|
7 |
100 |
77.4 |
75.6 |
76.2 |
0.614 |
|
|
14 |
100 |
81.2 |
82.5 |
82.3 |
0.728 |
|
|
21 |
100 |
74.6 |
85.6 |
84.6 |
0.75 |
From the data in Table 4, the proposed algorithm demonstrates significant performance differences in training results under different trading cycles and dimensions. First, from the perspective of the cycle, the model maintains high accuracy across all cycles, with recall and specificity showing stable trends. For example, at cycle 100, with a dimension of 7, the model's recall is 85.4%, specificity is 85.7%, accuracy is 85.6%, and Matthew’s correlation coefficient (MCC) is 0.7797, indicating that the model achieves a good balance between recall and specificity, with accuracy consistently stable around 80% across all dimensions. Furthermore, at a dimension of 14, the model’s recall reaches 84.6%, specificity is 84.3%, accuracy is 84.6%, and MCC is 0.745, indicating that as the dimension increases, the overall performance of the model improves. This suggests that higher-dimensional information provides more features for the model, contributing to improved image recognition performance.
From Table 5, it is evident that the deep learning algorithm proposed in this study shows noticeable performance fluctuations under different trading cycles, dimensions, and volume settings. Additionally, there are performance differences when volume is included ("With") versus when it is not ("Without").
"Without Volume" Results: As the trading cycle increases, the recall, specificity, accuracy, and MCC values all improve. For example, at a trading cycle of 21 and a dimension of 100, the recall is 85.6%, specificity is 85.4%, accuracy is 84.5%, and MCC is 0.774, demonstrating the best performance in this configuration. For shorter cycles (such as 7), performance slightly decreases, with recall and accuracy being 77% and 76.2%, respectively, and MCC being 0.61, indicating that shorter cycles have a significant impact on model performance.
"With Volume" Results: The model generally performs better when volume is included, especially at a trading cycle of 21 and dimension of 100, where the recall increases to 87.5%, accuracy reaches 88.9%, and MCC is 0.779, significantly higher than the corresponding configuration without volume.
Table 6. Independent testing results for four random price trend lines in the international capital flow market
|
Sample ID |
Recall |
Specificity |
Accuracy |
F-Measure |
|
1 |
81.2 |
75.6 |
77.4 |
0.789 |
|
2 |
82.3 |
82.3 |
82.3 |
0.84 |
|
3 |
82.5 |
81.2 |
82.6 |
0.826 |
|
4 |
66.9 |
65.9 |
66.9 |
0.678 |
In Table 6, the testing results of the deep learning algorithm on four independent price trend line samples show varying levels of precision and robustness.
Sample 1: The model's recall is 81.2%, specificity is 75.6%, accuracy is 77.4%, and F-Measure is 0.789, demonstrating moderate performance, though the balance between recall and specificity could be improved.
Sample 2: This sample shows better performance with recall and specificity both at 82.3%, accuracy at 82.3%, and an F-Measure of 0.843, indicating good adaptability of the model to this sample.
Sample 3: The performance is also strong here, with recall at 82.5%, specificity at 81.2%, accuracy at 82.6%, and F-Measure at 0.826, indicating stable trendline recognition abilities.
Sample 4: The model's performance is less favorable, with recall at 66.9%, specificity at 65.9%, accuracy at 66.9%, and F-Measure at 0.678, suggesting that in more complex or noisy price trend lines, the model's performance may degrade.
From the analysis, it can be concluded that the proposed deep learning framework demonstrates good performance in most samples, especially in balancing recall and accuracy. However, performance variations, particularly in Sample 4, highlight the challenges the model may face with more complex or noisy data. This suggests that further optimizations in data preprocessing and feature selection could improve performance for these more challenging samples. Overall, the deep learning framework presented in this study has shown high precision and robustness in price trend line recognition but still requires further model adjustments and data optimization to enhance performance in specific scenarios, particularly those involving complex or noisy data. Figure 4 provides an example of the price trend line feature recognition using the proposed algorithm.
Figure 4. Price trend line feature recognition example
The deep learning-based image analysis framework proposed in this paper significantly has improved the feature extraction and analysis capabilities of price trend lines in international capital flow-related images by innovatively incorporating the bar pooling module and the bar attention module. This study first designed an efficient and highly adaptable deep learning algorithm architecture, which can flexibly handle different types of financial data under various trading cycles, dimensions, and volume conditions. This framework not only effectively enhances the model’s accuracy and robustness but also demonstrates significant advantages in price trend line feature recognition, especially in the complex international capital flow market, where the model can capture key trends in price changes, providing important technical support for market prediction and decision-making.
However, despite the excellent performance of the proposed deep learning framework under various experimental settings, especially under longer cycles and with volume information included, the model still faces some challenges. Particularly with complex and noisy samples, the model's performance fluctuates significantly, and the accuracy of some test samples decreases. This reveals the limitations of the model when dealing with highly dynamic and unstable data. Therefore, future research could focus on further optimizing data preprocessing and feature extraction steps, exploring how to effectively reduce noise interference, and improving the model's adaptability in complex market environments. At the same time, combining other types of financial data and real-time dynamic information could further enhance the model’s comprehensive prediction ability. Additionally, exploring multimodal data fusion methods could further increase the practical application value of the model.
In summary, this paper makes significant theoretical and practical contributions to the application of deep learning technology in international capital flow-related image analysis, especially in improving the accuracy and robustness of price trend line recognition. However, there are certain limitations in the research, and future efforts should further expand the model's generalization ability and strengthen its ability to process complex market data, in order to better support financial market analysis and prediction.
This paper was supported by Quzhou University's Research Launch Project “Effectiveness Analysis of Capital Controls and Macroprudential Policies on Cross-Border Capital Flows” (Grant No.: BSYJ202140).
[1] Ning, Y., Wang, Y., Yang, Z., Geng, Y. (2017). Measurement and multifractal properties of short-term international capital flows in China. Physica A: Statistical Mechanics and its Applications, 468: 714-721. https://doi.org/10.1016/j.physa.2016.10.063
[2] Meng, Z., Wei, W., Liu, X., Yin, K. (2018). The influence of international capital flow on the effectiveness of Chinese monetary policy. Romanian Journal of Economic Forecasting, 21(4): 21-40.
[3] Yu, C., Wang, Z. (2023). A study on how international portfolio investment flows affect macrofinancial risks and control channels. Discrete Dynamics in Nature and Society, 2023(1): 1888284. https://doi.org/10.1155/2023/1888284
[4] Von Hagen, J., Zhang, H. (2014). Financial development, international capital flows, and aggregate output. Journal of Development Economics, 106: 66-77. https://doi.org/10.1016/j.jdeveco.2013.08.010
[5] Hoti, S. (2004). An empirical evaluation of international capital flows for developing countries. Mathematics and Computers in Simulation, 64(1): 143-160. https://doi.org/10.1016/S0378-4754(03)00128-9
[6] Neumann, R.M. (2006). The effects of capital controls on international capital flows in the presence of asymmetric information. Journal of International Money and Finance, 25(6): 1010-1027. https://doi.org/10.1016/j.jimonfin.2006.07.008
[7] Ning, J., Yu, S. (2021). Barcode location in financial statement system based on the partial differential equation image recognition algorithm. Advances in Mathematical Physics, 2021(1): 9177159. https://doi.org/10.1155/2021/9177159
[8] Cai, X.H., Yi, S., Yu, K.P. (2023). Web-based practical privacy-preserving distributed image storage for financial services in cloud computing. World Wide Web: Internet and Web Information Systems, 26(3): 1223-1241. https://doi.org/10.1007/s11280-022-01090-7
[9] Bhargavan, M., Sunshine, J.H., Hughes, D.R. (2011). Clarifying the relationship between nonradiologists’ financial interest in imaging and their utilization of imaging. American Journal of Roentgenology, 197(5): W891-W899. https://doi.org/10.2214/AJR.11.7019
[10] Zhen, Z., Wang, Z., Wang, F., Mi, Z., Li, K. (2017). Research on a cloud image forecasting approach for solar power forecasting. Energy Procedia, 142: 362-368. https://doi.org/10.1016/j.egypro.2017.12.057
[11] Guan, B., Zhao, C., Yuan, X., Long, J., Li, X. (2024). Price prediction in China stock market: An integrated method based on time series clustering and image feature extraction. The Journal of Supercomputing, 80(7): 8553-8591. https://doi.org/10.1007/s11227-023-05562-z
[12] Wang, J. (2021). Application of wavelet transform image processing technology in financial stock analysis. Journal of Intelligent & Fuzzy Systems, 40(2): 2017-2027. https://doi.org/10.3233/JIFS-189204
[13] Dobni, D.M., D. Racine, M. (2015). Stock market image: The good, the bad, and the ugly. Journal of Behavioral Finance, 16(2): 130-139. https://doi.org/10.1080/15427560.2015.1034858
[14] Bang, J., Ryu, D. (2023). CNN-based stock price forecasting by stock chart images. Romanian Journal of Economic Forecasting, 26(3): 120-128.
[15] Li, P., Xu, J., Li, K. (2022). A stock selection model of image classification method based on convolutional neural network. Computational Intelligence and Neuroscience, 2022(1): 4743427. https://doi.org/10.1155/2022/4743427
[16] Peng, S., Xin, W. (2020). Research on wave image analysis in the implied volatility of stock options. Multimedia Tools and Applications, 79: 6447-6461. https://doi.org/10.1007/s11042-019-08503-2
[17] Kim, T., Kim, H.Y. (2019). Forecasting stock prices with a feature fusion LSTM-CNN model using different representations of the same data. PloS One, 14(2): e0212320. https://doi.org/10.1371/journal.pone.0212320
[18] Pandey, S.K., Chand, N., Nandy, S., Muminov, A., Sharma, A., Ghosh, S., Srinet, R. (2020). High-resolution mapping of forest carbon stock using object-based image analysis (OBIA) technique. Journal of the Indian Society of Remote Sensing, 48: 865-875. https://doi.org/10.1007/s12524-020-01121-8
[19] Perdices-Castillo, L., Perianes-Rodríguez, A. (2011). Image retrieval and visualization systems in stock photography agencies. Profesional de la Información, 20(4): 439-443.
[20] Kvåle, G. (2023). Critical literacy and digital stock images: The interests of the uninteresting images. Nordic Journal of Digital Literacy, 3: 173-185. https://doi.org/10.18261/njdl.18.3.4
[21] Jin, G., Kwon, O. (2021). Impact of chart image characteristics on stock price prediction with a convolutional neural network. Plos One, 16(6): e0253121. https://doi.org/10.1371/journal.pone.0253121
[22] Harvey, K., Brookes, G. (2019). Looking through dementia: What do commercial stock images tell us about aging and cognitive decline? Qualitative Health Research, 29(7): 987-1003. https://doi.org/10.1177/1049732318814542