Vimal Kumar Maanuguru Nagaraju*![]() | Vini Antony Grace Nicholas
| Vini Antony Grace Nicholas![]() | Suresh Raju
| Suresh Raju![]() | Thiyagarajan Jayaraman
| Thiyagarajan Jayaraman![]()
© 2025 The authors. This article is published by IIETA and is licensed under the CC BY 4.0 license (http://creativecommons.org/licenses/by/4.0/).
OPEN ACCESS
Among the many cancers that are diagnosed each year, breast cancer is by far the most common and well-known. New breast cancer statistics are disturbing, and the disease has recently been affecting middle-aged and younger women. If not identified early and treated correctly, it can be extremely deadly. Using a hybrid multilayer deep learning model, this research presents a robust approach for breast cancer categorization. Using medical imaging of the breast, the proposed approach aims to categories breast cancer into four stages: 0 (no disease), I (some disease), II (some disease), and III (some disease) depending on the extent to which the disease has spread. The Breast Cancer Wisconsin Diagnostic Dataset, a dataset obtained from the Kaggle website, contains a variety of pictures related to breast masses, some of which are benign and some of which are malignant. The input images are improved using preprocessing techniques like the Wiener filter and Adaptive Histogram Equalization (AHE). While the UNet model is used for feature extraction, the SegNet approach is used for segmentation. Afterwards, the results are optimized using the Grey Wolf Optimization (GWO) technique. Multilayer Perceptions are used for classification. Classification measures including Accuracy, Precision Recall, F1-Score, and Matthew's correlation coefficient are used to evaluate the suggested system. Additionally, it outperforms all of the current classification methods when tested against them, including Support Vector Machine, Logistic Regression, LeNet, Long Short-Term Memory, and Adaptive Neuro Fuzzy Inference System.
breast cancer, Wiener filter, SegNet, UNet, MultiLayer Perceptron (MLP), Grey Wolf Optimization (GWO)
There have been over 8.2 million fatalities due by breast cancer, making it the most frequent cancer in women. According to a recent survey by the International Agency for Cancer Research, 25% of all cancers are breast cancers [1]. Over the next two decades, the breast cancer death toll might reach 22 million. This cancer type is believed to have caused 19.6 million women to experience disability adjusted life years, and the mortality to incidence ratio (MIR) is approximately 0.30. According to the World Health Organisation, 626,700 people die each year from breast cancer, making it the most often diagnosed disease in the world [2]. Cancer of the breast is a diverse illness because it may appear in many different ways. Almost twenty distinct subtypes of breast cancer have been recognised by medical professionals thus far, including lobular carcinoma, ductal carcinoma, Paget's disease, inflammatory breast cancer, metastatic breast cancer, breast phyllodes, and many more [3].
While lobular and ductal carcinomas are the commonly found types, others are rare. Breast cancer can also be present in the form of tumors (big or small), masses of cells, patches, micro calcifications, distortions, etc. [4]. Therefore, using appropriate mechanisms for identification is advised. There are various stages of cancer such as stage 0, stage 1, stage 2, stage 3, and stage 4. Stage 0 is considered to be a benign tumor which is just multiplication of the epithelial cells and acquires very minimal attention [5]. Depending upon the size, location and spread of tumor, they are categorized accordingly.
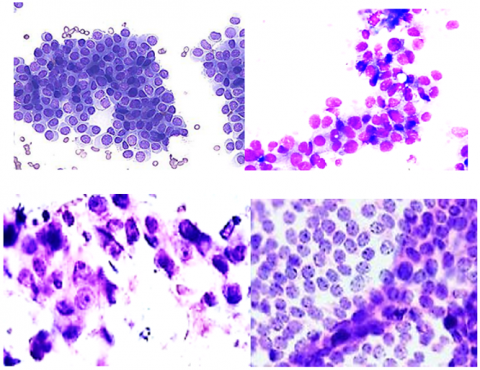
Mammograms, CT scans, histopathology, MRIs, manual breast, ultrasounds and many methods exist for the detection of breast cancer [6]. Among these, histopathology images obtained using the fine needle aspiration method are considered to be the golden standard as it is simple, effective, accurate, and non-invasive in nature. It is to be noted that automation of histopathology images is becoming the trend nowadays for aiding scientists better in computer aided diagnosis of many diseases. It is considered to be the most in-depth form of image when compared to all other imaging modalities of the breast [7]. Hence identifying the stage and type of cancer using histopathology images of the breast is considered to be very effective when compared to ultrasound or MRI images of the breast as it contains the complete cytological properties of the breast [8]. Different stages of breast cancer are shown in Figure 1.
The American Institute for Cancer Research has also reported that an average of 2 million cases is being recorded freshly every year [9]. This exponential rise in cases every year has created a huge demand for oncologists and radiologists who are well experienced in successful treatment and recovery.
Figure 1. Different phases of breast cancer
Unfortunately, there are not many experts in this field and hence designing an automated system for identifying and classifying the correct stage of breast cancer has become essential. This is because the subsequent treatment after diagnosis depends on the stage of breast cancer in which the person currently is. Earlier stages might be cured using chemotherapy, radiation, and hormonal therapy, whereas later stages require surgical intervention and targeted therapies [10].
There has to be an improvement in the development of reliable categorization methods to help with the early detection and treatment of breast cancer since it is still the leading cause of death of women globally. Classification systems that use a variety of ML and DL methods have become increasingly common within the last decade. Using databases of histological images, these algorithms have been able to differentiate between benign and malignant tumors, and in certain instances, to pinpoint particular stages of cancer. Systems using Support Vector Machines (SVMs), Convolutional Neural Networks (CNNs), and ensemble methods are notable examples of these approaches. All three of these technologies have the potential to improve diagnostic accuracy.
However, despite these advancements, existing classification systems still face significant challenges. These include limitations in handling highly imbalanced datasets, variability in image quality and resolution, and the generalizability of the models across different populations and imaging technologies. Further, there has been an increasing need for a system that not only classifies tumors into benign or malignant categories but also accurately identifies specific cancer stages. Such detailed classification is important for determining appropriate treatment plans and improving patient outcomes.
Our proposed system seeks to address these limitations by introducing a robust breast cancer classification framework that utilizes a hybrid approach combining MLP with GWO. This novel integration aims to enhance classification performance by optimizing the feature selection and learning process, thereby providing a more accurate and reliable system for identifying breast cancer stages from histopathological images.
1.1 Problem statement
The disease of breast cancer has been posing a great threat to mankind in the past and is continuing to frighten us with its exponential rate of increase and reduced survival rates. Not only early diagnosis is the need of the hour, but also identification of the exact stage of this disease becomes very essential as it can save the life of the patient. Therefore, classification of the different stages of breast cancer gains utmost importance. This paper aims to identify breast cancer and its respective stages in order to suggest appropriate treatment by the oncologist.
The contribution of the paper is as follows:
(1) To perform a literature evaluation and background investigation on health concerns and breast cancer classification.
(2) Using a MLP, a new optimized hybrid learning method is introduced to identify the different stages of breast cancer. For improved classification performance, the results are further refined using the nature inspired algorithm such as GWO algorithm.
(3) The multi class classification performance of the proposed method is validated through the experimental research utilizing the Breast Cancer Wisconsin Diagnostic Dataset.
In 2021, Heenaye-Mamode Khan et al. [11] discussed many deep learning methodologies for diagnosing breast cancer with histopathology images. The BACH database was pursued to carry out this comparison process and methods like ResNet, dual PathNet, NasNet, SENet, hybrid models of Inception, and ResnetV2 were used. Preprocessing techniques such as resizing, balancing the classes, contrast enhancing the images and normalization were carried out for classification and it has been concluded that SENet has achieved the highest accuracy amongst others.
In 2020, Roslidar et al. [12] explained the use of ensemble methods encompassing various classifiers for detection of breast cancer, especially the invasive ductal carcinoma. Histopathology data for breast cancer was obtained from Kaggle website and row wise and column wise empirical wavelet transforms were performed in order to divide the data set. MLP classifier was used for differentiating invasive ductal carcinoma and noninvasive differential images.
In 2021, Łukasiewicz et al. [13] studied the various risk factors, treatments, markers, and epidemiological factors involved in breast cancer. Various benign diseases of the breast and density of the breast tissues and the effectiveness of different treatment modes have been discussed in detail for the benefit of the reader. It also sheds light on the modifiable factors that account for the formation and development of breast cancer and how we can possibly avoid such factors in our lives. In 2022, Beňačka et al. [14] explained the process of classifying breast cancer by employing MLP based neural network combined with multistage weight adjustment. The Wisconsin dataset was used for executing the proposed system. Preprocessing mechanisms like normalization and preparation of slides are done after which backpropagation training algorithm was used as part of a hybrid classification model based on stack generalization. Three classifiers namely resilient backpropagation, Levenberg Marquardt and gradient descent classifier were used which achieved an accuracy of 98.74%.
In 2021, Rezaeipanah et al. [15] proposed a novel model for diagnosing breast cancer using a convolutional squared deviation neural network classifier. Homomorphic AHE, Canny Edge detector, Global Pixel Intensity-based thresholding processes were used as part of preprocessing and the centroid based region growing method was used as segmentation algorithm. The proposed classifier is further optimized using chaotic function based Black Widow optimization and it has been experimentally proven that the proposed hybrid model works more efficiently than existing techniques such as K-means, SVM, ANFIS, and CNN.
In 2021, Das et al. [16] presented a fully automated system for detecting and classifying breast cancers by utilizing deep learning classifiers. The INBreast data set was used which contained 410 mammographic breast images. They were resized to 512*512 pixels and region growing methods were used for segmentation and classification was done using LeNet, AlexNet, VGG16, ResNet 50, Xception, etc.
In 2020, Ed-daoudy and Maalmi [17] explained the process of GWO algorithm for detecting breast cancer. Various features relating to cell nuclei of the breast were used as features and achieved a maximum accuracy of 97% without the application of GWO. The results produced by the support vector machine classifier alone was estimated to be 77.1% which means that the GWO algorithm has increased the classification accuracy up to 20%.
In 2019, Khan et al. [18] described the process of semantic segmentation of mammogram images using UNet model with an aim to classify breast cancer. Data preprocessing techniques such as resizing, grayscale conversion, background removal, and categorical encoding were performed and UNet model was used for semantic segmentation of the acquired mammogram images. Tumors were classified as normal and benign, and this method achieved a dice coefficient of 99% and a weighted F1 score of 99%.
In 2022, Rajakumariand and Kalaivani [19] explain various methods and techniques available for segmenting images for detecting breast cancer and its possible future directions. This paper projects the fact that segmentation forms the most important step for identification and treatment of cancers, because it is this process that will help oncologists to arrive at a conclusion. The authors have explained the previous methods of segmentation available and have also discussed traditional techniques that were used for manual segmentation in earlier days. MIAS database has been used for comparing the performance of the various segmentation methods and has been concluded that UNet architecture of CNN is the most frequently used segmentation algorithm because of its fastness and efficient output.
In 2022, Dafni Rose et al. [20] provided insight on the use of IOT devices in breast cancer illness prediction. In order to put the suggested model into action, the 569-record Wisconsin breast cancer dataset with 32 data attributes was utilized. Weka was used for preprocessing, and principal component analysis was used for feature selection. The MLP was used for classification, and it was compared to other classifiers that are already available, including logistic regression and random forest. Accuracy, recall, F-measure, and precision were all 98% for the suggested classifier.
In 2020, Zahoor et al. [21] describe the process of classifying breast cancer using association rules and SVM. The standard Wisconsin breast cancer data from California was employed for the execution of the proposed system. The proposed association rules reduce the attributes from a number of 8 to 4 after which Apriori algorithm and candidate generation algorithm are used. SVM was further employed, mean and standard deviation values were calculated for all the attributes that were selected. This system achieved an accuracy of 98% when the system made use of eight attributes whereas the accuracy reduced to 96.14% when the associated attributes were reduced to a number of four.
There are various limitations that have been observed in the above study. Many existing papers have tried to classify breast tumor into benign and malignant only. They have not classified them into various stages. The process of data augmentation is not performed which leads to the problem of over fitting as the input datasets are small. The problem of the imbalanced class is not effectively addressed in these cases. Also, they have implemented the classification process using traditional techniques. Accuracy and other values of performance metrics achieved by these works are also not sufficient. Optimization algorithms have not been included in most of the studies which becomes a major drawback. All of these limitations are overcome in the proposed system with sufficient solutions for each of the problems.
3.1 Materials
3.1.1 Dataset
The breast cancer diagnostic data set is a publicly available resource that many researchers have utilized for this exact reason; the suggested system draws its input from this set, which is a hybrid of histopathology images of breast tissue and characteristics of the nucleus and cells visible in the image. The 569 patients included in this dataset have many characteristics recorded, including but not limited to: patient ID, breast cancer status, average radius, area, smoothness, compactness, concavity, symmetry, and fractal dimensions. A large portion of these metrics pertain to the imaged cell nucleus. In all, there are 357 noncancerous instances and 212 cancerous ones in the dataset.
3.1.2 Data preprocessing
Our preprocessing pipeline involves two key steps: AHE and Wiener filtering. These techniques were chosen to address specific challenges associated with histopathological images, such as varying contrast levels and noise. The histopathology images are subjected to noise removal and contrast enhancement using Wiener filter and Adaptive Histogram Localization (AHL). This step is very important as there is a wide possibility for the presence of artifacts because of the laboratory processes that are involved in staining and obtaining pathological images [22]. Before arriving at the final histopathology images of the breast, various processes are carried out which may induce several noises and unwanted features that have to be removed to achieve better classification accuracy. Data cleaning techniques such as redundancy removal and missing data filling are carried out on the acquired health database which are simple processes. Missing data is filled using an average of the same feature values. Figure 2 shows the lineup of three data preprocessing techniques of the proposed model.
Figure 2. Proposed data preprocessing mechanisms
Wiener filter. This is done by the Wiener filter which is a linear stationary filter that jointly performs noise removal and deblurring of the input image [23]. This noise reduction technique is applied to mitigate the impact of artifacts and noise inherent in image acquisition and processing. By modeling the noise and applying a filter in the frequency domain, Wiener filtering helps in preserving important details while reducing noise, thereby enhancing the quality of input images for classification. Any additional noise that has been included in the image in the process of staining or counter staining will effectively be removed by this filter and it is also capable of deblurring the image and bringing it back to the original form for better visual clarity. It is basically a statistical filter that is able to arrive at an estimate of the underlying image and minimizes the mean squared error between the original image and the preprocessed one. Since it is based on a mathematical process, it is always proven to produce the intended results. It has been widely used for filtering, smoothing and blur inversion of medical images. It can also decrease the variance of noise by computing the power spectrum and comparing it with a standardized image format. It is a stochastic filter that computes the discrete Fourier transform. The below Eq.(1) shows the formula of Wiener filter.
W(m,n)=F∗(m,n)Ps(m,n)|F(m,n)|2Ps(m,n)+Pn(m,n) (1)
where, W(m, n): Wiener filter; F(m, n): Fourier transform; Ps(m,n): Image power spectrum; Pn(m,n): Noise power spectrum.
AHE. Any medical image will be low in contrast because they are not designed for the purpose of image processing in general. Hence if in case they are intended to be used for image processing and analysis, they have to be contrast enhanced in order to gain a good insight into the image. This process of contrast enhancement of the histopathology images will pave way for better structural identification and thereby help in further processing [24].
There are many types of contrast enhancement algorithms, however out of which the proposed system has picked to use AHE whose main goal is to stretch the contrast in a uniform manner across the entire image. AHE is employed to improve the contrast of the images. Unlike standard histogram equalization, AHE adapts to local changes in contrast, which is crucial for highlighting the small differences in tissue structures within histopathological images. This step ensures that features relevant to breast cancer stages are more pronounced, facilitating more accurate feature extraction by subsequent models. It is different from normal histogram equalization in a way that it produces many histograms for each subsection of the image rather than computing a single histogram for the entire image and enhancing the contrast based on that single histogram. It divides the input image into the needed size for each of which histogram will be calculated individually and contrast will be determined for each part of the image and compared with the neighboring blocks [25].
The part of the image which contains excessive contrast or illumination will be gradually descended to its neighbors in order to produce uniformity in contrast. In this process, the edges of different objects present in the image are automatically enhanced thus enabling easier segmentation and object detection. The histograms calculated are ranked among each other based on the contrast level and pixels are reassigned with the new contrast or illumination value based on this algorithm. Mathematically the histogram calculation process of AHE is given in Eqs. (2) and (3).
a(n)=∑xx−1i=0∑yy−1j=0g(n,i,j) for n=0,1,…, N−1 (2)
b(n,i,j)={1 if I(i,j)=n0 otherwise (3)
where, n is the gray level, N is the number of histogram bins, a(n) is the nth bin histogram. xx and yy indicate the image block dimensions, i,j indicate the pixel coordinates, b(n,i,j) is the function that calculates the pixel value coordinates.
3.2 Methodology
3.2.1 Image segmentation
Segmentation is defined as the task of extracting objects present in the image and separating their overlapping regions for better understanding. As medical images contain several layers of cells, blood vessels, different organs of anatomy together in a single image, segmentation becomes a very crucial process in classifying and predicting diseases. The proposed system uses SegNet algorithm for segmenting the histopathology images. SegNet was chosen for its efficiency in segmenting medical images, particularly due to its encoder-decoder architecture which is adept at handling the fine-grained segmentation required for histopathological images. The encoder maps input images into a lower-dimensional space, capturing essential features, while the decoder reconstructs the segmentation maps from this feature space. This process is vital for isolating regions of interest (ROIs) such as tumor sites from the surrounding tissue, enabling precise feature extraction. SegNet was designed specifically for fragmenting medical images [26]. It consists of a segmentation architecture that is capable of pixel wise segmentation of the image based on a semantic process because of which it has been able to achieve phenomenal results as far as segmentation is concerned. It resembles architecture with the VGG16 model, and it’s equipped with the encoder decoder structure which is responsible for segmenting the image using operations like convolution, max pooling, batch normalization. Element wise activations are also performed on the segmented output so that the output image is not affected by any operations related to translation activities.
The encoder consists of operations like convolution and max pooling whereas decoder is responsible for operations like upsampling, reverse convolutions and SoftMax classification. The decoder samples the map generated by the encoder which has a classification layer attached to the end called SoftMax. It has less computational cost because of its smaller number of parameters. It is also considered to be time and memory efficient during the entire process of segmentation. It uses less memory when compared to all other deep learning models. There are various attractive advantages in SegNet algorithm such as fast computation, low memory requirements, better depth, easy activation, smooth segmentation etc. Pixel wise labeling and feature map activation is achieved through the Eqs. (4) and (5).
sk=exp(ak)∑iexp(ai) (4)
rms=√1n∑f2i (5)
where, k is the number of classes, i is the image pixel, n is the number of elements, fi is the value of feature map at pixel I, rms is the root mean square of the feature map. Figure 3 below shows the architecture of SegNet.
Utilizing a VGG16-based encoder with batch normalization, our SegNet implementation was trained with a learning rate of 0.001 and a batch size of 32. The Adam optimizer and cross-entropy loss function were selected for their efficacy in segmentation tasks.
Figure 3. SegNet based breast cancer segmentation
3.2.2 Feature extraction process
The process of feature extraction is done by UNet model of CNN which was intended to perform feature extraction on medical images especially for diagnosis purpose. UNet stands out for its ability to extract detailed features from medical images, thanks to its symmetric architecture and the use of skip connections that preserve spatial information lost during downsampling. This is crucial for maintaining the integrity of features indicative of cancer stages. It outperforms all its predecessors in handling biomedical images. It contains a simple encoder decoder structure combined with each other to identify what features are present and where they are present within the image locality. It is very fast in its computation. It is a fully connected network which contains many skip connections for transfer of information between the encoder and decoder structures [27]. The many layers of convolution present in the contracting and expanding path give it the appearance of U-shape because of which it has been named so and these layers are helpful in extracting the hidden features present in the image. The contracting part, otherwise called as the encoder is responsible for down sampling the input image and the decoder or the expanding network upsamples the feature map produced by the final layer of this architecture which is nothing but the bottleneck layer.
Skip connections which are present between the layers of convolution can aggregate the information contained by each layer and pass it to the next layer of repeated convolution. Convolution layers are also anchored with ReLu and Max pooling layers. The aim of the encoder is to suppress the spatial information present and enhance the feature information present in the image, whereas decoding network performs the reverse of this operation and produces a final feature map. There are four blocks of encoder which is of the size 3*3 and four decoder blocks which perform transpose convolutions of the size 2*2, and one bottleneck layer is present which make up a total of nine layers in the architecture of UNet. It has reduced computational costs because of the reduction of spatial information by the encoder and hence produces excellent results. The energy function of the feature channels of UNet is given by the Eqs. (6) and (7).
E=∑Ni=1w(f)log(ml(f)(f)) (6)
ml=exp(cl(y))/∑Ll′=1exp(cl(f)′) (7)
where, E stands for the energy function, f represents the features, w denotes the weight, ml shows the SoftMax function, l is the channel and cl stands for channel activation.
Figure 4 below depicts the architecture of UNet.
Figure 4. Architecture of UNet
The UNet model had four levels, two convolutional layers, max pooling, and rectified linear unit (ReLU) activation. Following SegNet's lead, we utilized the Adam optimizer with a learning rate of 0.001 to train the model to differentiate between pixels in malignant and non-cancerous zones. Reducing the loss of binary cross-entropy was our major aim.
SegNet and UNet were selected over other segmentation and feature extraction models due to their proven effectiveness in medical image analysis, particularly for tasks requiring precise delineation and feature preservation in histopathological images. Their architectures are particularly suited to the complexities of breast cancer tissue images, where accurate segmentation and feature extraction are critical for subsequent classification stages.
3.2.3 Classification
Using the features extracted by UNet model, the proposed system has chosen MLP classifier for further classification of breast cancer stages. MLP is yet another artificial neural network model that is feed forward in nature which has the ability to classify nonlinear data as well. It is fully connected and uses nonlinear activation functions and backpropagation techniques for its computation [28]. For solving simple linear problems, single layer perceptron is used which has been extended to this format of MLP for solving complex multidimensional problems. It is considered to be the most powerful classification tool as far as artificial neural network is concerned as it is entirely backed by data and this is a black box classification algorithm.
A perceptron is nothing but the constituting neurons of each layer. The input layer is responsible for getting the input from the previous computational models and handing it over to the hidden layers which form the heart and core of the perceptron architecture. All the computations take place in the hidden layers and output layers [29]. Each of these layers consists of multiple neurons that are fully connected with each other both in terms of forward and backward connections. Each neuron contains a weight, bias and the threshold term associated with them as shown in Eqs. (8), (9) and (10).
oy=A.b2+w2.hy (8)
hy=B.b1+w1.x (9)
A=f(m(x))=1, if m(x)>θ and 0 otherwise (10)
where, A, B: activation functions; w1,w2: weights of the perceptron; b1,b2: bias values; Θ: threshold value.
Figure 5. Multi-layer perceptron
The weight and bias are randomly initialized before training the model and input data is propagated from layer to layer. The error function calculates the error in the model which is back propagated, and the model is updated. Once the training is over the model is validated using the testing dataset [30]. Figure 5 below illustrates the MLP model-based classification.
3.2.4 Optimization
Optimization algorithms are used in order to obtain best results possible. There are very many advantages of using optimization algorithms in classification systems. The foremost advantage is the improvement in accuracy of classification of models that employ an optimization algorithm in combination with a classification process when compared to that of models that do not make use of optimization. It has been proven that usage of optimization algorithms yields better results and are highly efficient. They possess good problem-solving capacity which when utilized in the process of classification will standardize the overall method, mitigate the risk of misclassification if any and thereby elevate the performance of the underlying model.
The result produced by the MLP classifier is optimized in this section using the GWO algorithm. It is a very unique algorithm that is based on population and the characteristics of grey wolves. The reasons behind choosing GWO algorithm over other existing optimization techniques are that it has reduced number of parameters and it can be easily combined with classifiers. It is a multiple solution based optimization technique that provides better solutions than single solution optimizers. Also, it has been found to be very much compatible with the MLP classifier. It does not easily get stuck in local optima which is a drawback with many other optimizers. It is best suited to maximize our objective of classifying the various stages of breast cancer using histopathology images. Grey wolves are hunters basically and therefore sit on top of the food chain ruling all the rest of the species below them. They are carnivores and hence hunt others for their survival. There are four various of grey wolves such as alpha grey wolves, beta grey wolves, delta grey wolves and omega grey wolves. There is a definite hierarchy amongst these subtypes of grey wolves where alpha grey wolves are the masters. Beta grey wolves obey the orders of the alpha wolves and are responsible for maintaining discipline within the crowd. Delta grey wolves are superior to omega grey wolves but inferior to alpha and beta wolves. It is believed that the delta grey wolves do not possess any capability for leadership.
Omega grey wolves are the least ones in the hierarchy which are considered as helper wolves and are not equipped with any powers and eat the least and the remaining left by the other three types of wolves. Beta wolves will become the successive alpha grey wolves in future. Grey wolves are very popular for their hunting mechanisms, and they usually live in herds of 11 to 15 on average so that it is easier for them to attack the prey.
There are three sub steps in optimization algorithm as it is mimicked by the actual hunting mechanism of grey wolves namely finding a prey, approaching them and attacking them [31]. The actual problem of GWO algorithm begins with random solutions and finally ends with the top three best solutions which are possible for the given problem. It is also meta heuristic in nature and very flexible and is not based upon any mathematical derivations. Hence it is very simple and easy to use. The process of searching and finding a prey is called the exploration phase and attacking the prey is called the exploitation phase. The mathematical modeling of GWO algorithm is given below in the following Eqs. (11) to (14).
M=|C.P(t)−W(t)| (11)
W(t+1)=P(t)−A.M (12)
A=2l.x1−l (13)
C=2.x2 (14)
where, A and C are coefficient vectors, M is the distance between prey and grey wolf, P(t) is the position of the prey, W(t) is the position of grey wolf, t is the maximum number of iterations, l is the linear vector and x1 and x2 are the random numbers generated by the optimization algorithm. GWO algorithm is given below:
|
Algorithm 1: GWO Algorithm |
|
Input: Grey Wolf Population, prey, coefficient vectors A and C |
|
Output: Three top best solution Sα,Sβ,Sγ |
|
do while |
|
Initialize grey wolf populations in all 4 categories |
|
Initialize vales of A,C,x1,x2 |
|
calculate individual fitness of each member |
|
If t<tmax, then |
|
For each agent wolf |
|
update position |
|
End For |
|
Update values of A, C and l |
|
Recalculate Fitness and Update them |
|
Increment positions by one step |
|
Update solution vector |
|
Sα= first best solution |
|
Sβ= second best solution |
|
Sβ= third best solution |
|
t++ |
|
end while |
|
return final Sα,Sβ,Sγ |
|
Stop |
A and C are used in finding the optimal solution. If the value of A is less than 1, finalize the prey and approach it for attack further. In case if the value of A is greater than 1, let the prey go off and search for a better one. This is a random value that has been induced into the optimization process so that the algorithm does not get stuck in any local optima.
The proposed system aims to classify breast cancer and its related stages using histopathology images obtained from fine needle aspiration of the breast tissue. Breast cancer Wisconsin diagnostic data set from Kaggle’s website contained electronic health records of 569 patients who are both malignant and benign and includes different features and parameters that are obtained from the histopathology images. Histopathological images are obtained from publicly available sources. Using these images and the features extracted, the proposed system classifies stages of tumor into stage 0, stage 1, stage 2, stage 3 and stage 4 depending upon the severity of the disease.
Next, the images are processed with preprocessing using a Wiener filter and contrast enhancement using an AHE. To achieve better results, the electronic health records undergo data cleaning procedures such as redundancy removal, filling missing data, outlier rejection, etc. Following this, the images are segmented using the SegNet algorithm and features are extracted using the UNet algorithm. MLP is then used to classify breast cancer into different stages. The classifier's output is further optimized using the GWO algorithm. Figure 6 shows the workflow of the proposed model.
The origin of the proposed method depends on the integration of MLP with GWO. This combination is not extensively explored in the context of breast cancer classification from histopathological images. This hybrid model utilizes the strengths of both techniques to address some of the key challenges in breast cancer classification, including feature selection, model generalization, and optimization of classification accuracy.
MLP: Because it can learn complicated nonlinear correlations between inputs and outputs, MLP is recognized for its performance in pattern recognition and classification applications. Its layered structure and backpropagation learning algorithm enable the extraction and processing of complex features from high-dimensional data, making it highly suitable for the classification of breast cancer stages from histopathological images. However, MLP's performance heavily relies on the initial selection of features and the optimization of its weights and hyperparameters.
Figure 6. Workflow of proposed system
GWO: To address these challenges, we incorporate GWO into our model. The social structure and hunting methods of grey wolves served as an inspiration for GWO, which is known for its adaptability, efficiency, and ease of use in exploring and exploiting the search area. Our goal in using GWO is to dramatically improve the classification accuracy of the model by optimizing the feature selection process and modifying the hyperparameters of MLP. For better MLP performance in breast cancer classification, this algorithm is an excellent alternative because it can achieve global optimization while avoiding local optima.
The proposed model is unique in following aspects:
· Integration of MLP and GWO presents a novel method to breast cancer classification, where GWO not only optimizes MLP’s parameters but also facilitates a more effective feature selection process, improving the ability of method to classifies the stages of cancer in accurate manner.
· By optimizing the selection of features from histopathological images, our model focuses on the most informative attributes, reducing computational complexity and improving classification performance.
5.1 Experimetnal analysis
The proposed system was experimented using the Breast Cancer Wisconsin Diagnostic dataset from Kaggle’s website enclosing electronic health records of 569 patients, out of which 357 were benign and 212 were malignant cases. Health records contain information about patient ID, state of breast cancer and various factors concerned with the structure of the cell nuclei. In combination with this dataset, 400 histopathology images of breast tissue acquired using FNA technique obtained from open access sources were also utilized for executing the proposed system. Figure 7 shows the sample histopathology images of breast cancer that are raw without being subjected to any processing and it contains four sub images pertaining to stage 1, stage 2, stage 3 and stage 4.
Different images in various stages of cancer are shown in Figure 1. The composition is listed in Table 1. 70 stage 0 images, 90 stage 1 images, 80 stage 2, 3 and 4 images each were used making a total of 400 histopathology images of the breast.
Figure 7. Sample histopathology images of breast tissue
Table 2 below displays the sample electronic health records. This figure presents a screenshot of the EHR data that was acquired from the Breast Cancer Wisconsin Diagnostic dataset from Kaggle’s website. It lists the details of patient id 1 to 25 regarding various parameters like patient ID, diagnosis state of breast cancer, mean radius, texture, perimeter, area, smoothness, compactness, concavity, symmetry, and fractal dimensions.
The preprocessed images using Wiener filter and AHE algorithm is illustrated in Figure 8. These histopathology images are the corresponding preprocessed ones of Figure7 images. Each of the individual four images were filtered using Wiener filter and contrast enhanced using AHE.
Figure 9 demonstrates the images segmented using SegNet algorithm. These segmented histopathology images are the result of the application of SegNet segmentation algorithm when applied to the preprocessed images shown in Figure 9.
Table 1. Histopathology images of breast
|
S. No. |
Stages |
No. of Images |
|
1. |
Stage 0 |
70 |
|
2. |
Stage 1 |
90 |
|
3 |
Stage 2 |
80 |
|
4. |
Stage 3 |
80 |
|
5. |
Stage 4 |
80 |
|
Total |
400 |
|
Table 2. Sample EHR data of Wiscons in dataset
|
id |
diagnosis |
radius_mean |
texture_mean |
perimeter_mean |
|
842302 |
M |
17.99 |
10.38 |
122.8 |
|
842517 |
M |
20.57 |
17.77 |
132.9 |
|
84300903 |
M |
19.69 |
21.25 |
130 |
|
84348301 |
M |
11.42 |
20.38 |
77.58 |
|
84358402 |
M |
20.29 |
14.34 |
135.1 |
|
843786 |
M |
12.45 |
15.7 |
82.57 |
|
844359 |
M |
18.25 |
19.98 |
119.6 |
|
84458202 |
M |
13.71 |
20.83 |
90.2 |
|
844981 |
M |
13 |
21.82 |
87.5 |
|
84501001 |
M |
12.46 |
24.04 |
83.97 |
Figure 8. Preprocessed breast histopathology images
Figure 9. Segmented breast histopathology images
5.2 Performance metrics
As demonstrated in Eqs. (15) to (20), the proposed model's classification performance is evaluated using metrics such as recall, accuracy, precision, F1 score, Matthews's correlation coefficient (MCC), and Area Under the Curve (AUC).
Accuracy = True Positive+True Negative True Positive+False Positive+True Negative+False Negative (15)
Precision = True Positive True Positive + False Positive (16)
Recall = True Positive True Positive + False Negative (17)
F1 score =2∗ sensitivity ∗ specificity sensitivity+specificity (18)
MCC=(TP∗TN−FP∗FN)√(TP+FP)(TP+FN)(TN+FP)(TN+FN) (19)
AUC=∫1a=0TP(FP−1(a)).da (20)
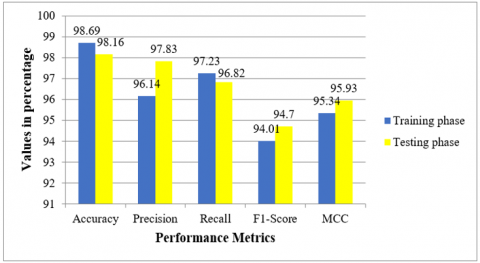
Table 3 displays the values of the proposed model with respect to the above discussed performance measures in training and testing phases.
Figure 10 shows the graphical representation of the MLP classifier performance. It pictorially depicts the accuracy, precision recall, F1-Score and MCC values achieved by the proposed system during training and testing phases. The accuracy phase is 98.16value in training phase is 98.69 and testing phase is 98.16. Similarly values of precision and recall during training and testing are 96.14, 97.83, 97.23 and 96.82 respectively. The F1-Score is 94.01 during training the classifier and 95.93 while testing it. MCC score is around 95.34 and 95.93 during training and testing the classifier.
Table 3. Performance of proposed method in term of classification
|
S.No. |
Metrics |
Training Phase |
Testing Phase |
|
1 |
Accuracy |
98.69 |
98.16 |
|
2 |
Precision |
96.14 |
97.83 |
|
3 |
Recall |
97.23 |
96.82 |
|
4 |
F1-Score |
94.01 |
94.70 |
|
6 |
MCC |
95.34 |
95.93 |
|
6 |
AUC |
0.980 |
0.991 |
Figure 10. Classification performance of the proposed MLP classifier
5.3 Results analyzing
5.3.1 Confusion matrix
It is a mathematical representation of the proposed system's both correct and incorrect classifications. Table 4 contains the confusion matrix of breast cancer stages classification. During stage 0, 68 images were identified correctly and during stage 1 and 2, 88 and 77 images were classified accurately. Similarly, 80 stage 3 images and 78 stage 4 images were correctly identified and classified by the suggested method.
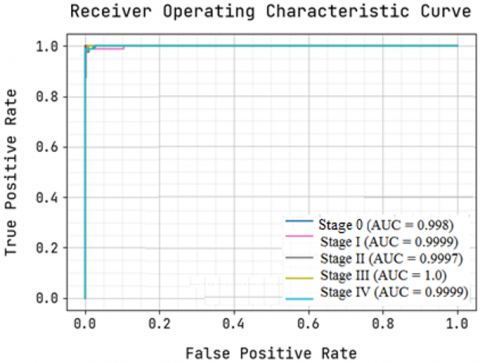
Figure 11. Analysis of ROC curve
Receiver Operating Characteristic (ROC) curve provides a deep insight into the stage wise classification performance of breast cancer achieved by the proposed system. Figure 11 depicts the ROC curve of breast cancer classification. The AUC values are higher than 0.99 for all the stages which means that the proposed MLP based classifier and its accompanying optimization algorithm have accomplished good results.
Table 4. Confusion matrix of the proposed system
|
Stage 0 |
Stage 1 |
Stage 2 |
Stage 3 |
Stage 4 |
|
|
Stage 0 |
68 |
2 |
0 |
0 |
0 |
|
Stage 1 |
1 |
88 |
1 |
0 |
0 |
|
Stage 2 |
1 |
1 |
77 |
1 |
0 |
|
Stage 3 |
0 |
0 |
0 |
80 |
0 |
|
Stage 4 |
0 |
0 |
0 |
2 |
78 |
5.4 Performance comparison
A number of popular algorithms were methodically applied to guarantee an exhaustive and balanced comparison. These models include Adaptive Neuro Fuzzy Inference System (ANFIS), Support Vector Machine (SVM), Logistic Regression (LR), LeNet, and Long Short-Term Memory (LSTM). We followed best practices for model configuration, training, and validation for each of these models and used standard libraries.
For SVM and LR, we employed the Scikit-learn library in Python, using radial basis function (RBF) kernels for SVM and the liblinear solver for LR. Both models were fine-tuned with a grid search strategy to identify the optimal hyperparameters.
For LeNet, LSTM, and ANFIS, we implemented them using the TensorFlow and Keras libraries. LeNet was configured with its classic architecture for image classification tasks. LSTM was set up with 100 units in the hidden layer to capture temporal dependencies in the data effectively. For ANFIS, we used the Fuzzy logic toolbox in MATLAB, given its suitability for handling uncertainties in image classification.
All models were evaluated using the Breast Cancer Wisconsin Diagnostic Dataset, ensuring uniformity in the dataset employed across comparisons. This dataset was chosen for its relevance and widespread use in breast cancer classification research, facilitating a valid comparison with previous studies.
To guarantee fair comparison conditions, we partitioned the dataset into training (70%), validation (15%), and testing (15%) sets, maintaining the same distribution for all models. Data preprocessing steps, including normalization and augmentation, were uniformly applied to create a consistent input format across models. Each model was trained and evaluated on the same hardware configuration to avoid discrepancies in performance due to computational differences.
The selection of comparative models was based on their prominence and historical significance in breast cancer classification research. This selection aims to include a broad spectrum of techniques, from traditional machine learning models like SVM and LR to more recent deep learning approaches like LeNet and LSTM, as well as hybrid models like ANFIS. This variety ensures a comprehensive comparison across different methodologies, highlighting the advantages and limitations of each in the context of breast cancer classification.
Current systems such as Support Vector Machine (SVM), Logistic Regression (LR), LeNet, Long Short-Term Memory (LSTM), and Adaptive Neuro Fuzzy Inference System (ANFIS) are compared to the suggested model's classification performance. When it comes to breast cancer classification, Table 5 demonstrates how different models fared. This table clearly shows that the suggested method is effective and outperforms SVM, LR, LeNet, LSTM, and ANFIS in breast cancer classification, with improvements of 11.6%, 8.2%, 7.1%, 4.5%, and 3%, respectively. The inclusion of state-of-the-art procedures and techniques in the construction of the proposed system has resulted in this significant gain in classification accuracy. In addition, unlike other current methods, the suggested system performs multi-class classification, which is necessary for breast cancer stage classification based on disease severity. Their approach has recently been applied as a model for binary classification.
In Figure 12, we can see a visual representation of the proposed model and its current classifiers compared. As regarding this point, the best breast cancer classification accuracies achieved by various methods have been as follows: SVM 86.5%, LR 89.9%, LeNet 91%, LSTM 93.46%, ANFIS 95.11%, and the suggested system 98.16%.
Table 5. Performance comparison with existing methods
|
S.No. |
Methods |
Accuracy |
|
1 |
SVM |
86.50 |
|
2 |
LR |
89.9 |
|
3 |
LeNet |
91.0 |
|
4 |
LSTM |
93.46 |
|
5 |
ANFIS |
95.11 |
|
6 |
Proposed system |
98.16 |
Figure 12. Comparative analysis of algorithms
The proposed hybrid model, integrating MLP with GWO, achieved a classification accuracy of 98.16%, precision of 97.83%, and recall of 96.82% (Table 2). These results represent a significant improvement over existing models, such as SVM, LR, LeNet, LSTM, and ANFIS, which we attribute to the novel combination of MLP for deep learning-based feature extraction and GWO for optimization. The GWO algorithm, in particular, played a crucial role in refining the feature selection process and optimizing the MLP parameters, thereby enhancing the model's ability to distinguish between different stages of breast cancer accurately.
When compared to recent studies, our model demonstrates superior performance, particularly in terms of accuracy and precision. For example, existing deep learning approaches have reported accuracies ranging from 86% to 95% in similar tasks. Our model's success can be attributed to its optimized feature selection and the effective combination of deep learning with evolutionary optimization, highlighting the potential of hybrid models in medical image analysis.
The capability to correctly categories breast cancer stages from histological images is a key strength of our proposed approach, as it is used to determine optimal treatment options. The model becomes more flexible and applicable to different datasets and imaging scenarios when GWO is used for optimization, which improves its generalizability. Nevertheless, we are aware of a few constraints. The input image quality has a significant impact on the model's performance, and addressing extremely unbalanced datasets may require additional refining. In the future, researchers may look into testing the model on increasingly larger and varied datasets and incorporating more preprocessing methods.
Deep learning models are the driving agents behind medical imaging nowadays and are proven to be effective in diagnosing several diseases. When combining the power of technology with medicinal practices, there is a possibility for huge paradigm shifts from traditional methods to more efficient and robust diagnostic systems that are automated in nature. They improve the survival rates of various diseases and hence transform the field of medicine and take it to the next level. The proposed system is one such model which aims to automatically classify the different stages of breast cancer with the help of histopathological images depending upon which the oncologist will suggest a preventive or curative treatment to the patient. The proposed system uses up to date machine learning techniques such as UNet, SegNet, MLP and GWO algorithm for achieving the intended purpose and produces phenomenal results with accuracy of 98.16%, precision value of 97.83%, recall score of 96.82% and F1-score of 94.70%. It is also proved to be superior in classification of breast cancer when compared to existing classifiers like SVM, LR, LeNet, ANFIS and LSTM.
One of the primary limitations of our study is the reliance on the Breast Cancer Wisconsin Diagnostic Dataset, which, while comprehensive, may not fully represent the diversity of breast cancer cases worldwide. The dataset's demographic and geographic diversity is limited, which could introduce biases and affect the generalizability of our model to populations not represented in the dataset. The complexity of the model and the computational resources required for training and optimization could be limiting factors, especially in low-resource settings.
Future studies should aim to incorporate more diverse datasets, including images from different populations and geographic locations. Exploring strategies to reduce the computational complexity of the proposed model without compromising its performance could make it more accessible for use in low-resource settings. There is a need for extensive clinical validation of the proposed model across multiple healthcare settings.
[1] Panwar, H., Ingle, P., Santosh, T., Singh, V., Bugalia, A., Hussain, N. (2020). FNAC of breast lesions with special reference to IAC standardized reporting and comparative study of cytohistological grading of breast carcinoma. Journal of Cytology, 37(1): 34-39. https://doi.org/10.4103/JOC.JOC_132_18
[2] Silman, H.K., Ali, A.E. (2020). Breast cancer identification is based on artificial intelligent system. Sustainable Engineering and Innovation, 2(2): 110-118. https://doi.org/10.37868/sei.v2i2.108
[3] Yedjou, C.G., Tchounwou, S.S., Aló, R.A., Elhag, R., Mochona, B., Latinwo, L. (2021). Application of machine learning algorithms in breast cancer diagnosis and classification. International Journal of Science Academic Research, 2(1): 3081-3086.
[4] Chaurasia, V., Pal, S. (2020). Applications of machine learning techniques to predict diagnostic breast cancer. SN Computer Science, 1(5): 270. https://doi.org/10.1007/s42979-020-00296-8
[5] Khamparia, A., Bharati, S., Podder, P., Gupta, D., Khanna, A., Phung, T.K., Thanh, D.N. (2021). Diagnosis of breast cancer is based on modern mammography using hybrid transfer learning. Multidimensional Systems and Signal Processing, 32: 747-765.https://doi.org/10.1007/s11045-020-00756-7
[6] Manoharan, J.S. (2020). Performance analysis of clustering-based image segmentation techniques. Journal of Innovative Image Processing, 2(1): 14-24. https://doi.org/10.36548/jiip.2020.1.002
[7] Manoharan, J.S., Parthasaradi, V., Suganya, K. (2021). A spatio-frequency domain anisotropic filtering for contrast enhancement of histopathological images. Annals of the Romanian Society for Cell Biology, 25(5): 4945-4958.
[8] Manoharan, J.S., Braveen, M., Subramanian, G.G. (2021). A hybrid approach to accelerate the classification accuracy of cervical cancer data with class imbalance problems. International Journal of Data Mining and Bioinformatics, 25(3-4): 234-261. https://doi.org/10.1504/IJDMB.2021.122865
[9] Shahidi, F., Daud, S.M., Abas, H., Ahmad, N.A., Maarop, N. (2020). Breast cancer classification using deep learning approaches and histopathology image: A comparison study. IEEE Access, 8: 187531-187552. https://doi.org/10.1109/ACCESS.2020.3029881
[10] Meenalochini, G., Ramkumar, S. (2021). Survey of machine learning algorithms for breast cancer detection using mammogram images. Materials Today: Proceedings, 37: 2738-2743. https://doi.org/10.1016/j.matpr.2020.08.543
[11] Heenaye-Mamode Khan, M., Boodoo-Jahangeer, N., Dullull, W., Nathire, S., Gao, X., Sinha, G.R., Nagwanshi, K.K. (2021). Multi-class classification of breast cancer abnormalities using Deep Convolutional Neural Network (CNN). Plos One, 16(8): e0256500. https://doi.org/10.1371/journal.pone.0256500
[12] Roslidar, R., Rahman, A., Muharar, R., Syahputra, M.R., Arnia, F., Syukri, M., Pradhan, B., Munadi, K. (2020). A review on recent progress in thermal imaging and deep learning approaches for breast cancer detection. IEEE Access, 8: 116176-116194. https://doi.org/10.1109/ACCESS.2020.3004056
[13] Łukasiewicz, S., Czeczelewski, M., Forma, A., Baj, J., Sitarz, R., Stanisławek, A. (2021). Breast cancer—epidemiology, risk factors, classification, prognostic markers, and current treatment strategies—an updated review. Cancers, 13(17): 4287. https://doi.org/10.3390/cancers13174287
[14] Beňačka, R., Szabóová, D., Guľašová, Z., Hertelyová, Z., Radoňák, J. (2022). Classic and new markers in diagnostics and classification of breast cancer. Cancers, 14(21): 5444. https://doi.org/10.3390/cancers14215444
[15] Rezaeipanah, A., Syah, R., Wulandari, S., Arbansyah, A. (2021). Design of ensemble classifier model based on MLP neural network for breast cancer diagnosis. Inteligencia Artificial, 24(67): 147-156. https://doi.org/10.4114/intartif.vol24iss67pp147-156
[16] Das, A., Mohanty, M.N., Mallick, P.K., Tiwari, P., Muhammad, K., Zhu, H. (2021). Breast cancer detection using an ensemble deep learning method. Biomedical Signal Processing and Control, 70: 103009. https://doi.org/10.1016/j.bspc.2021.103009
[17] Ed-daoudy, A., Maalmi, K. (2020). Breast cancer classification with reduced feature set using association rules and support vector machine. Network Modeling Analysis in Health Informatics and Bioinformatics, 9: 1-10. https://doi.org/10.1007/s13721-020-00237-8
[18] Khan, S., Islam, N., Jan, Z., Din, I.U., Rodrigues, J.J.C. (2019). A novel deep learning-based framework for the detection and classification of breast cancer using transfer learning. Pattern Recognition Letters, 25: 1-6. https://doi.org/10.1016/j.patrec.2019.03.022
[19] Rajakumari, R., Kalaivani, L. (2022). Breast cancer detection and classification using deep CNN techniques. Intelligent Automation & Soft Computing, 32(2): 1089-1107.
[20] Dafni Rose, J., VijayaKumar, K., Singh, L., Sharma, S.K. (2022). Computer-aided diagnosis for breast cancer detection and classification using optimal region growing segmentation with MobileNet model. Concurrent Engineering, 30(2): 181-189. https://doi.org/10.1177/1063293X221080518
[21] Zahoor, S., Lali, I.U., Khan, M.A., Javed, K., Mehmood, W. (2020). Breast cancer detection and classification using traditional computer vision techniques: A comprehensive review. Current Medical Imaging, 16(10): 1187-1200. https://doi.org/10.2174/1573405616666200406110547
[22] Singh, P., Mukundan, R., De Ryke, R. (2020). Feature enhancement in medical ultrasound videos using contrast-limited adaptive histogram equalization. Journal of Digital Imaging, 33: 273-285. https://doi.org/10.1007/s10278-019-00211-5
[23] Behar, N., Shrivastava, M. (2022). A novel model for breast cancer detection and classification. Engineering, Technology & Applied Science Research, 12(6): 9496-9502. https://doi.org/10.48084/etasr.5115
[24] Sikder, J., Das, U.K., Chakma, R.J. (2021). Supervised learning-based cancer detection. International Journal of Advanced Computer Science and Applications, 12(5): 863-869.
[25] Ghrabat, M.J., Hussien, Z.A., Khalefa, M.S., Abduljabba, Z.A., Nyangaresi, V.O., Al Sibahee, M.A., Abood, E.W. (2022). Fully automated model on breast cancer classification using deep learning classifiers. Indonesian Journal of Electrical Engineering and Computer Science, 28(1): 183-191.
[26] Michael, E., Ma, H., Li, H., Kulwa, F., Li, J. (2021). Breast cancer segmentation methods: Current status and future potentials. BioMed Research International, 2021: 1-29. https://doi.org/10.1155/2021/9962109
[27] Soulami, K.B., Kaabouch, N., Saidi, M.N., Tamtaoui, A. (2021). Breast cancer: One-stage automated detection, segmentation, and classification of digital mammograms using UNet model based-semantic segmentation. Biomedical Signal Processing and Control, 66: 102481. https://doi.org/10.1016/j.bspc.2021.102481
[28] Reenadevi, R., Sathiyabhama, B., Sankar, S., Pandey, D. (2021). Breast cancer detection in digital mammography using a novel hybrid approach of Salp Swarm and Cuckoo Search algorithm with deep belief network classifier. The Imaging Science Journal, 69(5-8): 364-378. https://doi.org/10.1080/13682199.2022.2161149
[29] Rajendran, R., Balasubramaniam, S., Ravi, V., Sennan, S. (2022). Hybrid optimization algorithm-based feature selection for mammogram images and detecting the breast mass using multilayer perceptron classifier. Computational Intelligence, 38(4): 1559-1593. https://doi.org/10.1111/coin.12522
[30] Selvaraj, V., Alagarsamy, M., Thangaraju, D., Mani, D.P. (2023). Classification of COVID-19 patient based on multilayer perceptron neural networks optimized with garrarufa fish optimization using CT scan images. International Journal of Pattern Recognition and Artificial Intelligence, 37(6): 2357003. https://doi.org/10.1142/S0218001423570033
[31] Sathiyabhama, B., Kumar, S.U., Jayanthi, J., Sathiya, T., Ilavarasi, A.K., Yuvarajan, V., Gopikrishna, K. (2021). A novel feature selection framework based on grey wolf optimizer for mammogram image analysis. Neural Computing and Applications, 33(21): 14583-14602. https://doi.org/10.1007/s00521-021-06099-z