Jingfan Tang*![]() | Jipeng Lu
| Jipeng Lu![]() | Xuefeng Zhang
| Xuefeng Zhang![]() | Fang Zhao
| Fang Zhao![]()
© 2024 The authors. This article is published by IIETA and is licensed under the CC BY 4.0 license (http://creativecommons.org/licenses/by/4.0/).
OPEN ACCESS
Human pose estimation is an important and widely studied task in computer vision. One of the difficulties in human pose estimation is that the model is vulnerable to complex backgrounds when making predictions. In this paper, we propose a deep high-resolution network based on segmentation guided. A conceptually simple but computationally efficient segmentation guided module is used to generate segmentation maps. The obtained segmentation map will be used as a spatial attention map in the feature extraction stage. Since the skeletal point region is used as the foreground in the segmentation map, the model pays more attention to the key point region to effectively reduce the influence of complex background on the prediction results. The segmentation guided module provides a spatial attention map with a priori knowledge, unlike the traditional spatial attention mechanism. To verify the effectiveness of our method, we conducted a series of comparison experiments on the MPII human pose dataset and the COCO2017 keypoint detection dataset. The highest boosting effect of our model compared to HRNet on the COCO2017 dataset is up to 3%. The experimental results show that this segmentation guidance mechanism is effective in improving accuracy.
human pose estimation, segmentation guided attention, spatial attention maps, deep learning, accuracy improvement
Human pose estimation is one of the most important tasks with many applications in computer vision, such as human action recognition [1], human-computer interaction [2], activity analyses and tracking [3]. The task of 2D human pose estimation is to detect keypoints of the human body (e.g. head, shoulder, knee, ankle, etc.) in a given RGB image. Although with the development of Convolutional Neural Networks, human body pose estimation has made significant progress, human body pose estimation is still a challenging task due to object occlusion, illumination changes, and severe deformation.
Currently, deep learning-based methods for human pose estimation have achieved state-of-the-art performance. Most models have networks that repeatedly downsample the feature maps from high resolution to low resolution and then upsample the high resolution from the low resolution and fuse the features of different resolutions in the process. When downsampling high-resolution feature maps to low-resolution feature maps, information is easily lost. HRNet [4], recently proposed by Sun et al., can learn features at different scales while maintaining high-resolution features. The model contains four parallel branches with different resolution feature maps, and the high-resolution branch runs through the whole model. The network structure can be divided into five stages. The network structure can be divided into five stages, the first stage is formed by a high-resolution sub-network, and the subsequent stages connect high-to-low resolution sub-networks in a parallel manner. Each sub-network is responsible for the extraction of feature maps of different resolutions. At the end of each stage, the feature maps of different resolutions are fused and then used as the input for the next stage. The feature maps of different resolutions are fused and used as input for the next stage at the end of each stage. Due to its excellent performance, it is recognized as one of the baseline models for pose estimation tasks.
Most of the existing models for human pose estimation only use point annotations to generate heatmaps to supervise the model output [4, 5], where the model training is completely dependent on the heatmap. Each pixel will contribute equally to the network loss, resulting in the background region's loss dominating the model loss, making the model optimization difficult. The model does not fully exploit the supervisory role of point annotations. In the field of crowd counting, Shi et al. [6] pioneered the use of segmentation maps to provide spatial supervision. Specifically, a branch containing an auxiliary loss is added to generate segmentation maps. Inspired by this, we used HRNet as the backbone of the model for feature extraction and then added segmentation guided modules to the high-resolution branches at each stage. Specifically, the segmentation map generated by the segmentation guided module is multiplied with the feature map to increase the weight of the key point region in the loss function. Finally, a dynamic weighted averaging algorithm is used to dynamically co-operate the segmentation loss with the pose estimation loss as a percentage of the final loss according to the convergence rate of the task. In the standard attention mechanism, the weighting map is obtained by training on a specific task. It is implicit learning [7]. In contrast, the segmentation map provides spatial supervision containing a priori knowledge. More importantly, the segmentation map is universal and simple to generate so that the key point annotation of any human pose estimation dataset can be used to generate the corresponding segmentation map to extend the dataset.
In this paper, to reduce the influence of background region features on the prediction results, we propose a Segmentation Guided Module (SGM) to make the model focus on key point region features. Finally, the final model is obtained by multi-task training using dynamic weighting [8].
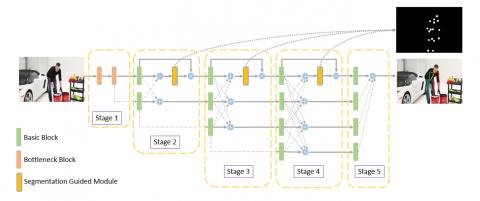
The network structure is described in Figure 1 to illustrate the design of our segmentation guidance mechanism. To verify the effectiveness of our proposed method, experiments are conducted on two significant mainstream human pose estimation datasets, MPII [9] and COCO2017 [10]. The experimental results show that the segmentation guidance mechanism can effectively improve the accuracy of human pose estimation. Meanwhile, comparative experiments on different design proposals of guidance mechanisms proved the proposed scheme was the most reasonable scheme with the best results.
Figure 1. Architecture of the segmentation guided human pose estimation network using HRNet
2.1 Human pose estimation
Before the advent of neural networks, most human pose estimation algorithms used tree models [11] and graphical models [12] to solve human keypoint detection problems, such as mixed body parts or graphical structures. These methods usually extract features for individual parts and consider pair-wise relationships to optimize the relationship between skeletal points to obtain more efficient and accurate inferences. The positions of these parts can be obtained using DPM.
Convolutional neural networks have excelled in various complex computer vision tasks, including detection, recognition, and semantic segmentation. Since the work of DeepPose by Toshev and Szegedy [13], the research on human pose estimation started to shift from classical methods to deep networks because of its better performance. Currently, there are two mainstream approaches: regression-based and detection-based methods. The regression-based approach regresses key point locations by learning a mapping from images to keypoint coordinates through an end-to-end framework. The detection-based approach estimates the keypoint heatmaps [14] and then selects the location with the highest heat values as the keypoints.
The classical model Hourglass is a multi-stage structure. Hourglass consists of a stack of Hourglass modules. The hourglass module is a symmetric structure that captures and integrates information at all scales of an image by repeating the bottom-up and top-down processes. Specifically, the bottom-up process uses convolution and pooling operations to generate high-resolution feature representations and low-resolution feature representations. Feature representations of different resolutions are processed using separate sub-networks. The top-down process uses the nearest-neighbor interpolation upsampling method to recover high-resolution feature representations from low-resolution feature representations. Finally, the different resolution feature information is fused using pixel point summation. Key point heatmaps are estimated for each Hourglass module. During training, the cascade of Hourglass structures and the role of intermediate supervised layers allow the prediction results to be continuously corrected and utilized.
CPN [15], the champion model of COCO 2017 Keypoint Benchmark, utilizes two sub-networks: GlobalNet and RefineNet for human pose estimation.GlobalNet outputs the precise pixel locations of easily recognized human body key points (e.g., head, eyes, etc.).RefineNet uses the pyramid structure to fuse features at different resolutions so that some obscured and hard-to-locate keypoints can be better localized based on the fused contextual information.
HRNet is a mainstream and effective baseline model. While previous models need to obtain information at different scales through bottom-up and top-down processes, HRNet maintains a high-resolution representation by connecting multi-resolution subnets in parallel. It minimizes the loss of information.
In conclusion, deep learning-based human pose estimation networks have improved significantly in accuracy and efficiency compared to traditional methods. The current research on human pose estimation has also entirely shifted from traditional methods to deep learning.
2.2 Attention mechanism
Attention mechanisms are widely used in a wide variety of computer vision tasks, among which soft attention mechanisms are the most prevalent. In the soft attention mechanism, spatial attention is formed by focusing on different image regions, and channel attention is formed by focusing on different features channels. Due to its microscopic nature, the gradients computed by the neural network can be propagated forward in the soft attention module, and the weight parameters of the soft attention module can be continuously updated by backward feedback. Therefore, the soft attention mechanism can be added directly to the end-to-end deep neural network. A common way to use the soft attention mechanism in a network is to add a network branch with one or more convolutional layers. Each branch generates an attention map of an image region and overlays it with information from different steps to make the final decision. The essence of the spatial attention mechanism is to pay different levels of attention to different locations on the feature map, selectively focusing on the important parts of the image and ignoring other irrelevant background information, thus contributing to the generation of the feature map.
The representative Spatial Transformer Networks (STN) [16] algorithm uses a spatial transformer module first to identify the regions of the image information that need to be focused on and then enhances the importance of this region and weakens the importance of other areas to make the extraction of features more focused on the essential areas. The STN algorithm focuses on the relationship between different channels of the feature map, using squeeze and excitation operations to obtain a 1 × 1 × C attention map with each value characterizing the importance of its corresponding channel. Then a scale operation is performed on the attention map and the original feature map to enhance the features of important channels and suppress the features that are not useful for the current task. BAM [17] and CBAM [18] combine spatial and channel information to generate the final attention weights, which are then pointwise multiplied with the feature map to adjust the features adaptively.
Spatial attention mechanisms have been broadly studied in human pose estimation. For example, Chu et al. used a stacked hourglass network to generate attention maps of different resolutions, with low-resolution attention maps focusing on the whole human body and high-resolution attention maps focusing on specific parts of the body. Finally, the model fuses each body part's attentional maps of different resolutions to generate the corresponding local attentional maps. To improve the final results, Huo et al. use HRNet as the skeleton network and add spatial attentional mechanisms and channel attentional mechanisms to the network. The above models' attention maps are implicitly obtained by accompanying the key point heat map regression task. However, the attention graph based on segmentation guidance can be derived from the existing segmentation graph without learning the attention graph from scratch. More specifically, we construct a segmentation map as an additional but free, supervised signal for accurate pose estimation of the human body.
In this study, Human pose estimation is formulated as a heatmap regression problem. Our goal is to learn a convolutional neural network model, denoted as $\mathcal{F}$. The model takes image I as input and learns to regress a heatmap $\widehat{H}_i$ for each key point by the following method:
$\widehat{H}_i=\mathcal{F}(I ; \Theta)$ (1)
$\Theta$ denotes the parameters to be learned in the neural network model.
Our model uses HRNet as the backbone network, a high-resolution network with excellent performance.HRNet consists of five stages. Each stage consists of branches that extract features at different resolutions, scales the extracted feature map size by upsampling or downsampling, and then fuses the extracted feature maps from different branches with each other. Each branch of each stage receives the fused information from the previous stages. This network design ensures that effective high-resolution features are obtained when fusing low-resolution features, and eventually, a more accurate heat map of key points is obtained.
We add a segmentation guided module to the network as an attention layer to reduce the weight of features in the background region in the loss function, allowing the model to concentrate on skeletal point region features and thus improve the accuracy of skeletal point heat map estimation. In contrast to the traditional way of training the attention layer, we use an almost free ground truth segmentation map as an additional guide to training the attention layer.
We use dynamic weighted averaging in the pose estimation network training to balance the share of heat map loss and segmentation map loss in the final loss. The heat map loss and segmentation map loss for each iteration are recorded and compared with the previous losses to obtain the training speed for the pose estimation and attention generation tasks. The share of each task in the final loss is adjusted based on the training speed so that the two tasks learn at similar speeds.
3.1 Point annotations
Point annotations are used in our approach in two ways: heat maps and segmentation maps. The heat map makes it possible to solve the human pose recognition problem without directly regressing the coordinates of key points. The segmentation maps generated by point annotation can be used to provide spatial focus; intuitively, regions within a specific range of point annotations are of high interest. We use a method similar to heat map generation to generate segmentation maps from point annotations. The binarized segmentation value at position p in the image I is represented as follows:
$S(p)=\left\{\begin{array}{c}1, \text { if } \exists_{p \in \rho}\left(\|p-P\|^2 \leq r\right) \\ 0, \text { otherwise }\end{array}\right.$ (2)
where, $p$ is a two-dimensional position vector $(x, y)$ and is the set of all key points of the human body, P is a two-dimensional position vector of a human skeleton point, and $\|\cdot\|$ is the Euclidean norm. $r$ is the radius of the high response region.
In our approach, the true value $H_i(p)$ of the heat map for the ith keypoint is generated by a Gaussian template with $\sigma=2$ and without normalization.
$H_i(p)=\left\{\begin{array}{cc}e^{-\frac{\left(x-x_i\right)^2+\left(y-y_i\right)^2}{2 \sigma^2}}, & \text { if }\left(\left\|x-x_i\right\| \leq l \text { and }\left\|y-y_i\right\| \leq l\right) \\ 0, & \text { otherwise }\end{array}\right.$ (3)
$(x_i,y_i )$ denotes the two-dimensional position coordinates of the ith skeletal point in the picture, and l denotes the side length of a high response square region. A Gaussian kernel is used to generate the heat map true value within a square area centered at p. For places outside the square region, the heat map truth value is 0.
3.2 Segmentation guided module
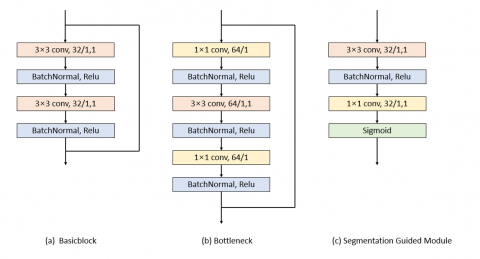
The Segmentation Guided Module (SGM) is shown in Figure 2, consisting of a 3 × 3 convolutional layer, a 1 × 1 convolutional layer, and a sigmoid activation function. A spatial attention map is generated under the supervision of the segmentation map. The weight of each region in an image is different, and the model should focus on the areas that are significant to the task. Locating the critical areas in an image through the spatial attention mechanism can effectively alleviate the problem of complex background interference and thus improve the final results of the model.
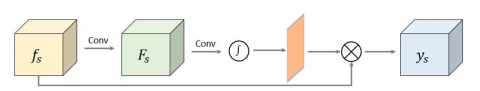
The mechanism of the segmentation bootstrap module is shown in Figure 3. x denotes the output convolutional features of the high-resolution branch of the s-stage. We use a convolutional layer with a convolutional kernel size of 3 × 3 containing the parameter x to map x into a feature map y that is more suitable for predicting the segmentation map, followed by a convolutional layer with a convolutional kernel size of 1 × 1 to reduce the number of channels in the feature map to 1. Finally, a sigmoid function is used to generate a prediction segmentation map s. Each value in this segmentation map represents the probability that this location is in the key point region, which will is used for the pose estimation branch. The feature map y at the output of the high-resolution branch of stage s is calculated as follows:
$y_s=f_s \odot V_s$ (4)
Figure 2. Structure of the main modules in the network
Figure 3. Split boot mechanism
3.3 Network configuration
Our study utilizes the state-of-the-art human pose estimation model HRNet to build the network instead of designing a new network from scratch. The entire network consists of five stages, the input image is 256 × 192, and the corresponding heat map output size is 64 × 48. In the first stage, the feature map size is scaled to 64 × 48 using two convolutional layers with a convolutional kernel size of 3 × 3 and a stride size of 2. Then, a series of feature extraction operations are performed to finally output a feature map with a channel number of 256 and a size of 64 × 48. Next, a convolutional layer with a kernel size of 3×3, the stride of 1×1, and padding of 1 reduce the number of channels of the feature map to 32, which is used as the input of the high-resolution branch in the second stage. At the same time, a convolutional layer reduces the feature map to 64 in parallel, with the size reduced to half of the original size, which is used as the input of the low-resolution branch in the second stage.
In the second stage, we add a segmentation guide module to estimate the attention maps. The segmentation bootstrap module takes the feature maps generated from the high-resolution branches in the previous stage as input and outputs attention maps with the same spatial resolution. This is achieved by a convolutional layer (convolutional kernel size of 3 × 3, stride of 1 × 1, and padding of 1), a convolutional layer with a convolutional kernel size of 1 × 1 compressing the feature map channels, and a sigmoid activation function. Subsequently, the attention maps generated by the segmentation bootstrap module are dotted with the feature maps of the second stage high-resolution branches. Finally, the high-resolution feature maps are downsampled by a convolutional layer with the stride of 2 × 2 and then fused with the feature maps of the low-resolution branch. The low-resolution feature map is upsampled using bilinear interpolation and fused with the feature map of the high-resolution branch. After the fusion of the different resolution features, we use the fused feature maps as the input for the next stage.
A new low-resolution branch is added in stages 3 and 4, so that in stage 4, the network outputs four features of different resolutions. Similar to stage 2, a segmentation guided module is used in stages 3 and 4 to generate spatial attention and perform the fusion of features coming from each resolution.
A final segmentation guides the output of the high-resolution branch after fusion in stage 4. Then the resulting feature map is fed to a convolutional layer with a convolutional kernel size of 1 × 1 to obtain a skeletal point heat map with the number of channels as the number of key points.
3.4 Loss function with dynamic weight averaging
We use the mean squared error to calculate the pixel-level difference between the predicted heat map and the true value of the heat map and write the calculation as $\mathscr{L}^{k e y}$.
The key point heat map loss calculation is shown below:
$\mathscr{L}^{k e y}(\Theta)=\sum_{p=1}^P \sum_{n m}\left\|y_p(m, n)-\widehat{y_p}(m, n)\right\|_2^2$ (5)
where, $p$ represents the pth skeletal point, $(m, n)$ denotes the two-dimensional spatial coordinates, and $y_p(m, n)$ denotes the predicted heatmap value at position $(m, n)$, and $\widehat{y_p}(m, n)$ denotes the value of the true value of the heat map at position $(m, n)$.
For the losses between the predicted partitioned graph and the true-value partitioned graphs the losses are determined by Binary Cross Entropy Loss to calculate, denoted as $\mathscr{L}^{seg}$. The formula is shown below:
$\begin{gathered}\mathscr{L}^{s e g}= -\frac{1}{N} \sum_{s=1}^N\left\|M_s \odot \log (\widehat{M})+\left(1-M_s\right) \odot \log (1-\widehat{M})\right\|_1\end{gathered}$ (6)
N is the number of stages the model contains, and in our network N is 4. Ms denotes the predicted partition map for the sth stage, and $\widehat{M}$ is the Segmentation map truth value. ||•||1 denotes the 1-parametric number, which is the sum of the absolute values of the matrix elements. ⊙ denotes the corresponding elements of the matrix multiplied by each other.
These two loss functions constitute the final loss function of the model ℒ(Θ), and the model optimizes both loss functions simultaneously for multitask learning.
$\mathscr{L}(\Theta)=w_s(t) \lambda \mathscr{L}^{\operatorname{Seg}}(\Theta)+w_k(t) \mathscr{P}^{k e y}(\Theta)$ (7)
Here is a hyperparameter that adjusts the magnitude of the loss of the segmentation task so that the loss of the segmentation task and the pose recognition task are of the same magnitude, set to 0.002 in our experiments. Meanwhile, to balance the learning speed of the two tasks, we use a multi-task learning optimization method with dynamic weighted averaging. During training, the weight parameters for the loss of the segmentation task are dynamically calculated $w_s(t)$ and the weight parameter for the loss of the pose recognition task $w_k(t)$, specifically, the faster the loss decreases for the task, the smaller the weights become; conversely the weights become larger. The t in the expression denotes the tth backpropagation. The weight parameter is calculated as follows:
$w_s(t)=\frac{N * \exp \left(r_s(t-1)\right)}{\sum_n^{\sum\left(r_n(t-1)\right)} \exp }$ (8)
$w_k(t)=\frac{N * \exp \left(r_k(t-1)\right)}{\sum_n^{\sum\left(r_n(t-1)\right)} \exp }$ (9)
$N$ is the number of tasks, which in our experiments is 2. $r_n(t-1)$ is the loss function change factor for task n at step $t-1$, which is calculated as follows:
$r_n(t-1)=\frac{L_n(t-1)}{L_n(t-2)}$ (10)
where, $L_n(t-1)$ denotes the loss of task n at step $t-1$, and $L_n(t-2)$ denotes the loss of task n at step $t-2$.
We evaluated the performance of SG-HRNet on the MPII human pose dataset [9] and the COCO keypoint detection dataset [10] and compared it with the current state-of-the-art methods. At the same time, we also compare the impact of segmentation graph truth values of different radii and different segmentation guidance modules on the performance. Finally, we performed a series of ablation experiments to select the optimal radius for generating the segmentation graph truth values. The datasets and evaluation metrics used in the experiments, the experimental results, and the network training details are as follows.
4.1 Datasets
The MPII human pose dataset is a popular benchmark dataset collected and provided by the Max Planck Institute for Informatics. The dataset contains annotations of body joints of more than 40 K people with 25 K images. The test set includes 12 K human instances annotations, and the rest of the annotations are used to build the training set. All the images in the dataset are extracted from YouTube videos and contain their respective life scenes. Sixteen human body key points are annotated in MPII with their 2D coordinates in the original image, while a "visible" attribute indicates whether the key points are occluded or beyond the image boundary. For invisible key points, the "visible" attribute has a value of 0.
The COCO keypoint detection dataset is a very challenging dataset with more than 250,000 human instances labeled, with 17 keypoints per human instance. The dataset contains more than 200,000 images and is divided into three parts: training set, validation set and test set. The COCO train2017 dataset contains 57K images with a total of 150K individual annotations. The val2017 and test-dev2017 sets contain 5000 images and 20K images respectively.
4.2 Evaluation metrics
In our experiments, different metrics are used on the MPII and COCO datasets to evaluate the model's performance. PCK (Percentage of Correct Keypoints) is used on the MPII dataset.PCK indicates the percentage of key points where the normalized distance between the predicted key points and their corresponding ground truths is less than a set threshold. In our experiments following the previous work, the head length is used as the normalized reference, i.e., PCKh. Using the average accuracy (AP) metric on the COCO dataset, the calculation of AP will involve the calculation of the OKS metric. OKS (object keypoint similarity) is a commonly used evaluation metric for human bone keypoint detection algorithms today and indicates the similarity between the true value and the predicted keypoint. The OKS metric is computed as a scalar, and then the AP is computed by specifying a threshold T. The calculation of each metric is as follows:
$\operatorname{PCK}_i^k=\frac{\sum_p \delta\left(\frac{d_{p i}}{d_p^{d e f}} \leq T_k\right)}{\sum_p 1}$ (11)
Eq. (11) is the formula for calculating the PCK of the ith key point at the kth threshold. k represents the kth threshold; $i$ indicates the ith key point; $p$ indicates the pth human instance; $d_{p i}$ indicates the distance of the ith key point of the p-th human instance from the true value; $d_p^{\text {def }}$ indicates the normalized scale factor, and the head size of the human instance is used as the scale factor in MPII. $T_k$ indicates the threshold. The PCK metric of the algorithm under the $T_k$ threshold is calculated as follows.
$P C K_{\text {mean }}^k=\frac{\sum_i P C K_i^k}{\sum_i 1}$ (12)
The PCKh@0.5 indicator is used in the experiment.
$O K S=\frac{\sum_i^{\sum\left\{-d_i^2 / 2 S^2 \sigma_i^2\right\}\left(v_i>0\right)} \exp }{\sum_i \delta\left(v_i>0\right)}$ (13)
Eq. (13) is the formula for OKS , and $d_i$ is the Euclidean distance between the predicted critical point and the corresponding true value, the $v_i$ denotes the visibility of the true value, $S$ is the human instance scale factor whose value is the square root of the area of the human detection frame, and $\sigma_i$ denotes the ith critical point normalization constant whose value is obtained by counting the standard deviation of the presence of the artificially labeled and true values in the sample set.
$A P=\frac{\sum_p \delta\left(o k s_p>T\right)}{\sum_p 1}$ (14)
p denotes the human instance number and T is a custom threshold. Evaluation metrics used in the experiments, AP50 (T is taken as 0.5), AP (T takes the average value obtained from 0.5, 0.55, ..., 0.90, 0.95), APL denotes the large subject, the APM for medium subjects, and AR.
4.3 Network training
SG-HRNet was implemented using PyTorch and experimented on a server platform configured with NVIDIA GeForce2080ti GPU, 32-core Xeon(R) Silver 4110 CPU. The "Adam" optimizer was used during training, and the initial learning rate was set to 1e-3, decreasing to 1e-4 at the 170th epoch, 1e-5 at the 200th epoch, and ending the training at the 210th epoch. In the experiments, the human instances in the images are cropped down to a 4:3 aspect ratio, and the image patches are scaled to a fixed size: 256 × 192. We use the technique of mini-batch, where 32 image patches are randomly selected per iteration, and image enhancement is performed for input to the network. The specific image enhancement methods include random rotation with a rotation range of (−45°, 45°), random scaling in (0.65, 1.35), and horizontal flipping. In the testing phase, similar to reference [19], the human instances in the images are first detected using a pedestrian detector, and then the key points of these human instances are predicted. The heat map is obtained by averaging the original image's heat map and the flipped image's heat map. By convention, the position is obtained for each key point by shifting the highest response position of this key point towards the 2nd highest response position by an offset of one quarter.
4.4 Result
Our model is compared with the HRNet family of models as well as the state-of-the-art model on the MPII validation set, and the results are shown in Table 1, with the best results for key points highlighted in bold. It can be seen from the experimental results that our approach is the best performer among the HRNet family of models. The overall result of the model on the MPII test set is 90.6%, which is a 0.3% improvement relative to HRNet and still 0.1% higher than the latest model in the HRNet family, PRAB. This result suggests that our segmentation-guided attention-based mechanism is not only effective but also superior to the traditional attention mechanism via steganography learning, which is further supported by the experimental results on the COCO val2017 dataset in Table 2. Meanwhile, the values of the Params column and the GFLOPs column are equal to those of the corresponding columns of HRNet, indicating that the cost of our enhancement effect is almost free.
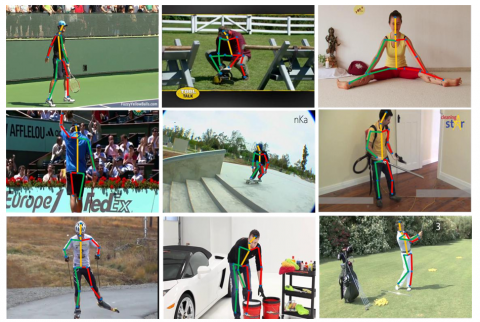
Figure 4 shows the visualization results of the bit-pose estimation for some images of the MPII dataset, where the joints of human instances with complex background regions and human instances with uncommon poses are still correctly estimated. These results also confirm the good robustness of the proposed method.
Table 1. Comparisons of PCKh@0.5 scores on the MPII validation set
| Method | Params | GFLOPs | Head | Sho | Elb | Wri | Hip | Kne | Ank | Mean |
| HRNet-W32 [4] | 28.5M | 7.1 | 97.1 | 95.9 | 90.3 | 86.4 | 89.1 | 87.1 | 83.3 | 90.3 |
| Hourglass [20] | 25.1M | 19.1 | 96.5 | 96 | 90.3 | 85.4 | 88.8 | 85 | 81.9 | 89.2 |
| PRM [21] | 28.1M | 21.3 | 96.8 | 96 | 90.4 | 86 | 89.5 | 85.2 | 82.3 | 89.6 |
| DLCM [22] | 15.5M | 15.6 | 95.6 | 95.9 | 90.7 | 86.5 | 89.9 | 86.6 | 82.5 | 89.8 |
| Simple Baseline [23] | 68.6M | 20.9 | 97 | 95.9 | 90.3 | 85 | 89.2 | 85.3 | 81.3 | 89.6 |
| PRAB [24] | 28.9M | 9.5 | 97.1 | 96.2 | 90.7 | 86.4 | 89.8 | 86.9 | 83.3 | 90.5 |
| Our | 28.5M | 7.1 | 97.3 | 96.2 | 90.9 | 86.4 | 89.9 | 86.8 | 83.4 | 90.6 |
Table 2. Results on the COCO val2017 dataset
| Method | Back Bone | Pretrain | Input Size | Paramss | GFLOPS | AP | AP50 | AP75 | APM | APL | AR |
| Hourglass[20] | 8-stages Hourglass | N | 256 ×192 | 25.1 | 14.3 | 66.9 | - | - | - | - | - |
| CPN [15] | ResNet-50 | Y | 256 × 192 | 27 | 6.2 | 68.6 | - | - | - | - | - |
| CPN+OHKM [15] | ResNet-50 | Y | 256 × 192 | 27 | 6.2 | 69.4 | - | - | - | - | - |
| Simple Baseline [23] | ResNet-50 | Y | 256 × 192 | 34 | 8.9 | 70.4 | 88.6 | 78.3 | 67.1 | 77.2 | 76.3 |
| Simple Baseline [23] | ResNet-101 | Y | 256 × 192 | 53 | 12.4 | 71.4 | 86.3 | 79.3 | 68.1 | 78.1 | 77.1 |
| Simple Baseline [23] | ResNet-152 | Y | 256 × 192 | 68.6 | 15.7 | 72 | 89.3 | 79.8 | 68.7 | 78.9 | 77.8 |
| Simple Baseline [23] | ResNet-152 | Y | 384 × 288 | 68.6 | 35.6 | 74.3 | 89.6 | 81.1 | 70.5 | 79.7 | 79.7 |
| HRNet-W32 [4] | HRNet-W32 | Y | 256 × 192 | 28.5 | 7.1 | 74.4 | 90.5 | 81.9 | 70.8 | 81 | 79.8 |
| HRNet-W32 [4] | HRNet-W32 | N | 256 × 192 | 28.5 | 7.1 | 72 | 89.3 | 79.8 | 68.7 | 78.9 | 77.8 |
| PRAB [24] | HRNet-W32 | Y | 256 × 256 | 28.9 | 9.5 | 74.6 | 90.7 | 82.1 | 71.1 | 81.3 | 80 |
| Empose [25] | HRNet-W32 | Y | 256 × 192 | 30.3 | 7.63 | 75 | 90.3 | 82.3 | 71.7 | 81.5 | 80.2 |
| Our | HRNet-W32 | Y | 256 × 192 | 28.5 | 7.1 | 76.3 | 93.5 | 83.6 | 73.6 | 80.9 | 79.5 |
Figure 4. Visualization results of human pose estimation for some human instances of the MPII dataset
Table 3. Results for different radii on the MPII validation set and the value is PCKh@0.5 scores
| Radius | Head | Sho | Elb | Wri | Hip | Kne | Ank | Mean |
| r=3 | 97.2 | 96.1 | 90.9 | 86.1 | 89.2 | 86.5 | 83.3 | 90.4 |
| r=5 | 97.3 | 96.2 | 90.9 | 86.4 | 89.8 | 86.8 | 83.4 | 90.6 |
| r=9 | 97.2 | 95.9 | 90.9 | 86 | 89.1 | 86.5 | 82.7 | 90.3 |
The results of comparing our model with the HRNet family of models on the COCO val2017 dataset are shown in Table 2. The improvement of our model is more pronounced on the COCO val2017 dataset compared to the results on the MPII validation set. The performance of our model on the MPCO val2017 dataset is more significant than that on the MPII validation set. APL and AR, our model, is far superior to HRNet-W32 and PRAB for all other metrics. AP50 and APM both metrics are almost 3% higher than HRNet, while the AP and AP75 two metrics are still almost 2% higher than HRNet. These metrics are sufficient to show the effectiveness of segmentation guidance. Also, compared to the PRAB model using the traditional attention mechanism, the metrics are improved by about 2%-3%, indicating that the segmentation-guided attention mechanism is more suitable for the human pose estimation task.
We have done ablation comparison experiments for different values of radius r for making segmentation map truth values. The experimental results in Table 3 show that the best results are obtained when r is set to 5.
This paper uses segmentation mapping maps to form spatial attention with prior knowledge to guide the learning of human pose estimation models and propose a segmentation guidance network with HRNet as the backbone. With this spatial attention with a priori knowledge, the model will focus more on the key point regions in the picture without being disturbed by the complex background regions when making predictions. At the same time, spatial attention is formed faster and focuses on areas more accurately under the supervision of segmentation mapping maps. The experimental results on MPII and COCO datasets show that the guided mechanism by segmentation mapping maps can lead to better performance of SG-HRNet. And, the cost required for this effect is almost free. In the future, we plan to introduce the guided mechanism of segmentation mapping map in more human pose estimation models to improve the model effectiveness.
This work is supported by Zhejiang Provincial Technical Plan Project (Grant No.: 2020C03105), in part by the Fundamental Public Welfare Research Program of Zhejiang Province (Grant No.: LGF22F020036 and LGG21F020006), and Ningbo “Innovation Yongjiang 2035” Key R&D Programme (Grant No.: 2024Z202).
[1] Kumar, R., Kumar, S. (2024). A survey on intelligent human action recognition techniques. Multimedia Tools and Applications, 83(17): 52653-52709. http://doi.org/10.1007/s11042-023-17529-6
[2] Pascual-Hernández, D., de Frutos, N.O., Mora-Jiménez, I., Canas-Plaza, J.M. (2022). Efficient 3D human pose estimation from RGBD sensors. Displays, 74: 102225. http://doi.org/10.1016/j.displa.2022.102225
[3] Kshirsagar, A.P., Azath, H. (2023). YOLOv3-based human detection and heuristically modified-LSTM for abnormal human activities detection in ATM machine. Journal of Visual Communication and Image Representation, 95: 103901. http://doi.org/10.1016/j.jvcir.2023.103901
[4] Sun, K., Xiao, B., Liu, D., Wang, J. (2019). Deep high-resolution representation learning for human pose estimation. In 2019 IEEE/CVF Conference on Computer Vision and Pattern Recognition (CVPR), Long Beach, CA, USA, pp. 5686-5696. http://doi.org/10.1109/CVPR.2019.00584
[5] Needham, L., Evans, M., Cosker, D.P., Wade, L., McGuigan, P.M., Bilzon, J.L., Colyer, S.L. (2021). The accuracy of several pose estimation methods for 3D joint centre localisation. Scientific Reports, 11(1): 20673. http://doi.org/10.1038/s41598-021-00212-x
[6] Shi, Z., Mettes, P., Snoek, C.G. (2019). Counting with focus for free. In 2019 IEEE/CVF International Conference on Computer Vision (ICCV), Seoul, Korea (South), pp. 4199-4208. http://doi.org/10.1109/ICCV.2019.00430
[7] Chu, X., Yang, W., Ouyang, W., Ma, C., Yuille A.L., Wang X.G. (2017). Multi-context attention for human pose estimation. In 2017 IEEE Conference on Computer Vision and Pattern Recognition (CVPR), Honolulu, HI, USA, pp. 5669-5678. https://doi.org/10.1109/CVPR.2017.601
[8] Liu, S., Johns, E., Davison, A.J. (2019). End-to-end multi-task learning with attention. In IEEE Conference on Computer Vision and Pattern Recognition, (CVPR 2019), Long Beach, CA, USA, pp. 1871-1880. https://doi.org/10.1109/CVPR.2019.00197
[9] Munea, T.L., Yang, C., Huang, C., Elhassan, M.A., Zhen, Q. (2022). SimpleCut: A simple and strong 2D model for multi-person pose estimation. Computer Vision and Image Understanding, 222: 103509. http://doi.org/10.1016/j.cviu.2022.103509
[10] Dang, Y., Yin, J., Zhang, S. (2022). Relation-based associative joint location for human pose estimation in videos. IEEE Transactions on Image Processing, 31: 3973-3986. http://doi.org/10.1109/TIP.2022.3177959
[11] Madadi, M., Escalera, S., Baró, X., Gonzàlez, J. (2022). End-to-end global to local convolutional neural network learning for hand pose recovery in depth data. IET Computer Vision, 16(1): 50-66. http://doi.org/10.1049/cvi2.12064
[12] Salman, S.A., Zakir, A., Takahashi, H. (2023). SDFPoseGraphNet: Spatial deep feature pose graph network for 2d hand pose estimation. Sensors, 23(22): 9088. http://doi.org/10.3390/s23229088
[13] Toshev, A., Szegedy, C. (2014). Deeppose: Human pose estimation via deep neural networks. In Proceedings of the IEEE Conference on Computer Vision and Pattern Recognition, (CVPR 2014), Columbus, OH, USA, pp. 1653-1660. http://doi.org/10.1109/CVPR.2014.214
[14] Chen, Y., Shen, C., Wei, X.S., Liu, L., Yang, J. (2017). Adversarial posenet: A structure-aware convolutional network for human pose estimation. in Proceedings of the IEEE International Conference on Computer Vision, (ICCV 2017), Venice, Italy, pp. 1212-1221. https://doi.org/10.1109/ICCV.2017.137
[15] Chen, Y., Wang, Z., Peng, Y., Zhang, Z., Yu, G., Sun, J. (2018). Cascaded pyramid network for multi-person pose estimation. In 2018 IEEE/CVF Conference on Computer Vision and Pattern Recognition, Salt Lake City, UT, USA, pp. 7103-7112. https://doi.org/10.1109/CVPR.2018.00742
[16] Chen, L., Zhang, H., Xiao, J., Nie, L., Shao, J., Liu, W., Chua, T.S. (2017). SCA-CNN: Spatial and channel-wise attention in convolutional networks for image captioning. In 2017 IEEE Conference on Computer Vision and Pattern Recognition (CVPR), Honolulu, HI, USA, pp. 6298-6306. https://doi.org/10.1109/CVPR.2017.667
[17] Girdhar, R., Ramanan, D. (2017). Attentional pooling for action recognition. In NIPS'17: Proceedings of the 31st International Conference on Neural Information Processing Systems, Long Beach California USA, pp. 33-44.
[18] Li, Z., Gavrilyuk, K., Gavves, E., Jain, M., Snoek, C.G. (2018). Videolstm convolves, attends and flows for action recognition. Computer Vision and Image Understanding, 166: 41-50. https://doi.org/10.1016/j.cviu.2017.10.011
[19] Papandreou, G., Zhu, T., Kanazawa, N., Toshev, A., Tompson, J., Bregler, C., Murphy, K. (2017). Towards accurate multi-person pose estimation in the wild. In 2017 IEEE Conference on Computer Vision and Pattern Recognition (CVPR), Honolulu, HI, USA, pp. 3711-3719. https://doi.org/10.1109/CVPR.2017.395
[20] Newell, A., Yang, K., Deng, J. (2016). Stacked hourglass networks for human pose estimation. In Computer Vision – ECCV 2016: 14th European Conference, Amsterdam, The Netherlands, pp. 483-499. https://doi.org/10.1007/978-3-319-46484-8_29
[21] Yang, W., Li, S., Ouyang, W., Li, H., Wang, X. (2017). Learning feature pyramids for human pose estimation. In 2017 IEEE International Conference on Computer Vision (ICCV), Venice, Italy, pp. 1290-1299. http://doi.org/10.1109/ICCV.2017.144
[22] Tang, W., Yu, P., Wu, Y. (2018). Deeply learned compositional models for human pose estimation. In Computer Vision – ECCV 2018: 15th European Conference, Munich, Germany, pp. 197-214. http://doi.org/10.1007/978-3-030-01219-9_12
[23] Xiao, B., Wu, H., Wei, Y. (2018). Simple baselines for human pose estimation and tracking. In Computer Vision – ECCV 2018: 15th European Conference, Munich, Germany, pp. 466-481. http://doi.org/10.1007/978-3-030-01231-1_29
[24] Huo, Z., Jin, H., Qiao, Y., Luo, F. (2020). Deep high-resolution network with double attention residual blocks for human pose estimation. IEEE Access, 8: 224947-224957. https://doi.org/10.1109/ACCESS.2020.3044885
[25] Zhao, L., Xu, J., Gong, C., Yang, J., Zuo, W., Gao, X. (2020). Learning to acquire the quality of human pose estimation. IEEE Transactions on Circuits and Systems for Video Technology, 31(4): 1555-1568. http://doi.org/10.1109/TCSVT.2020.3005522