Ashwini S. Shinde*![]() | Vaishali V. Patil
| Vaishali V. Patil![]()
© 2024 The authors. This article is published by IIETA and is licensed under the CC BY 4.0 license (http://creativecommons.org/licenses/by/4.0/).
OPEN ACCESS
Robust and interpretable speech emotion recognition (SER) is pivotal to handle real time noisy conditions as well as to adapt the language and speaking style variations. In this work, the proposed feature vector is validated using the German database EMoDB for speaker dependent (SD) and speaker independent (SI) approaches. Data augmentation techniques of time shifting, pitch shifting and adding Gaussian noise are employed along with data balancing. The baseline feature set includes spectral features of mel-frequency cepstral coefficients (MFCC) and log Mel spectrogram-based features along with time domain features of zero crossing rate and root mean square energy. Proposed reduced feature set is fusion of baseline features with discrete wavelet transform (DWT) based statistical features selected through ANOVA and reduced chroma features obtained using principal component analysis (PCA). Proposed reduced feature vector is validated by support vector machine (SVM), multilayer perceptron (MLP), and Gradient Boosting (XGBoost) classification with holdout and stratified k-fold (k=5, K=10) cross-validation. In speaker-dependent approach, with 10-fold cross-validation accuracy is improved from 73.07%, 74.94%, 71.02% to 93.18%, 94.07%, 87.15% for SVM, MLP and XGBoost classifier respectively. The contribution of discriminative features of proposed reduced feature set in emotion prediction is explained with the Shapley Additive Explanations module.
explainable speech based emotion recognition, data augmentation, mel-frequency cepstral coefficients, discrete wavelet transform, spectral features, SHAP, speaker dependent, speaker independent
Speech is the most natural and convenient medium to express. This is the main reason why now a day’s speech assistants such as Alexa, Siri, OkGoogle have emerged to interact with machine. To make interaction, more natural exhaustive research is carried in the domain of emotion detection based on speech. SER is very challenging task as design or selection of each and every stage of its workflow right from identification of emotion discriminant features to selection of appropriate classifier is crucial [1]. SER has applications in digital assistants [2], psychological consultation, assistant for suggesting music therapy [3], health care, online learning [4], for prioritizing service based on customer reviews etc. Using machine learning approaches such as supervised [5, 6] unsupervised [7] or deep leaning based SER models [8] are built and validated by researchers. Design of SER model should be robust in terms of noisy natural environment, speaker gender, speaking rate [9]. For any artificial intelligence model, also there is need to interpret the detected emotion state based on input features. In recent study, with technological advancements in speech based emotion recognition research gap identified is as below:
Authors [10, 11] introduced Local Interpretable Model-agnostic Explanations (LIME) and Shapley Additive Explanations (SHAP). The objective of LIME and SHAP is to explain model predictions faithfully with respect to local algorithm. In proposed work, machine learning based new robust and explainable SER model using data perturbations and various cross validation methods is introduced to address the research gap. Major contributions of the proposed work are:
Proposed work is explained with introduction in first section. Related work with literature study is discussed in second section. Third section elaborates database, methodology of each stage in detail. Experimentation with results details is well explained in section four. Inferences derived are discussed in section five. Finally, conclusion with findings and future scope are put forth.
One of the challenging tasks in the design stages of SER is identifying emotion-discriminant features through feature engineering [9, 12] as emotions vary according to age, gender and cultural background. One of the most dominant acoustic features for the detection of speech-based emotion is Mel Frequency Cepstral Coefficients (MFCC). Modifications in traditional MFCC feature extraction, the use of coefficient derived from magnitude spectrum without commonly used discrete cosine transform have been suggested by Ancilin et al. [13]. Many researchers [5, 14-16], used MFCCs derived from sub-bands decomposed using multi-resolution based wavelet transform to capture emotion-specific acoustics features in both time and frequency domain. Deb et al. [5] extracted acoustic features from sinusoidal peak identified by threshold based on the median pitch frequency of sub-band signals derived from the three-level decomposition of the preprocessed input speech signal with pre-emphasis constant $\alpha=0.94$. These features have shown average performance improvement as compared with commonly used feature combinations. Palo and Mohanty [14] used 16 MFCC, 16 linear predictions cepstral coefficient (LPCC) features along with wavelet features derived from three-level decomposition with mother wavelet dB4 as baseline and feature selection with vector quantization method for emotion recognition. Shinde and Patil [15] presented improvement in the misclassification of happy and angry emotions with the feature fusion of spectral and selected emotion discriminative discrete wavelet transform (dB4) features. Kuchibhotla et al. [6] used Sequential Forward Floating Search-based feature fusion with 24 filter bank-based MFCC and LPCC features using Linear discriminant analysis (LDA) and SVM classifier. Nagarajan et al. [17] proposed gamma tone frequency cepstral coefficients (GFCC), human factor cepstral coefficients (HFCC) and 29 filter bank-based MFCC features in combination for emotion detection. Very few researchers explored speaker-dependent and speaker-independent approaches to design machine learning based robust SER systems. The limitation observed is majority of experiments focused only on improving gender-wise average emotion recognition rate. For SER applications such as supportive diagnosis tool for psychologists or therapist, there is lack of an explanation of predictions made by a black-box machine learning model.
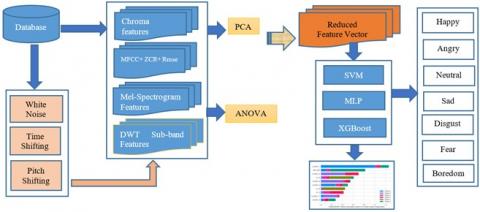
Details of the database used, feature extraction, feature selection methods and classifiers employed are explained in detail in this section. Figure 1 depicts the block diagram of the proposed methodology.
3.1 Database used
The proposed work uses the popular open-source German language speech emotion dataset EMoDB [18]. It is a gender-balanced dataset with audio recordings of 5 male and 5 female speakers. Details of the database are listed in Table 1. Emotion-wise distribution of EMoDB utterances in percentage is represented with Figure 2. It is clear from Figure 2, EMoDB is a highly imbalanced dataset with seven emotion classes: angry, boredom, happy, neutral, sad, disgust, and fear. Different sentences are uttered by professional speakers in soundproof environments. Each emotion class has a different number of sentences by each of the speakers.
Table 1. Database details
|
Name of Database |
EMoDB [18] |
|
Language |
German |
|
# of speakers |
10 |
|
# of utterances |
535 |
|
#of Emotion classes |
7 |
|
Emotion Classes |
Angry, Happy, Sad, Neutral, Disgust, Fear, Boredom |
Figure 1. Proposed methodology
Figure 2. Emotion-wise utterances in EMoDB (%)
3.2 Preprocessing
In speech signal processing, pre-processing stages comprise of trimming, normalization, pre-emphasis followed by framing windowing [12].
Pre-Emphasis: Generally, the amplitude of high-frequency signal is affected in recording of database. With the help of first order high pass filter $H(n)$, this effect is eliminated by boosting signal to noise ratio of input sample $S(n)$ as shown in Eq. (1) with $\alpha=0.97$.
$H[n]=S[n]-\alpha * S[n-1]$ (1)
Raw input Speech $S(n)$ is non stationary signal. This is converted into stationary input by dividing into frames of 25ms with 10ms overlap. These frames are subjected to windowing using hamming window function as represented in Eq. (2) to save information at the corner of frames.
$v[n]=0.54-0.46 * \cos \left(\frac{2 \pi n}{N}\right)$ where $0 \leq n \leq N$ (2)
Trimming: All raw input speech files are sampled at the rate of 44.1Khz. To focus only on information content, leading as well as trailing silence in speech recording is removed in trimming.
Normalization: All audio files are normalized with respect to max. amplitude of input speech signal.
3.3 Data augmentation and balancing
Availability of big SER data set is one of the major bottlenecks for SER researchers. In real time applications of SER especially in the domain of healthcare, mental disorders, [4] physiological therapy limited and unbalanced dataset is a common concern. Because of the limited data, overfitting is a common issue, where training accuracy is high while testing accuracy is low. In proposed work as observed from Figure 2, EMoDB is highly unbalanced and limited SER dataset. Hence, data augmentation is necessary. To design robust SER model, there is strong need to handle real time signal conditions such as noise, deviation in pitch etc. This necessity is utilized in audio data augmentation to generate audio signal, while preserving original signal emotional characteristics. This results in Increase of database size to develop generalized machine learning model [3, 12, 19]. In proposed work, three audio data augmentation methods are employed.
$S x(f)=\frac{N 0}{2}$ for all $f$ (3)
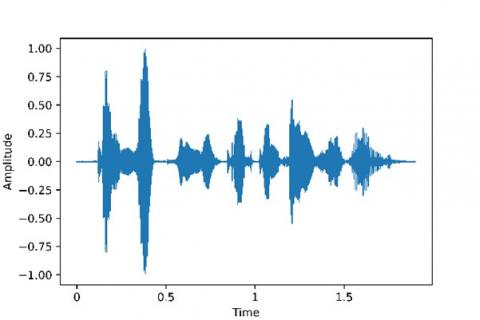
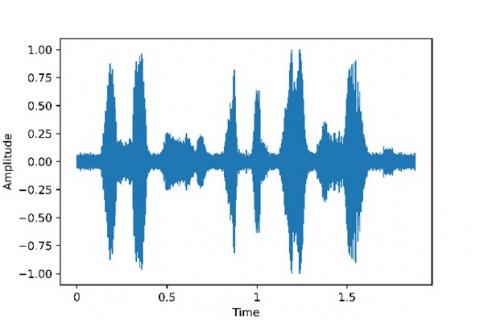
(a) Original audio (Angry)
(b) Sample audio with added Gaussian noise
(c) Sample audio with pitch shifting
Figure 3. Original and augmented audio signals
Shinde et al. [3] employed these three audio augmentation methods along with additional pitch change method in SER. This results into generalized SER model for suggestion of music therapy. Basic EMoDB has 535 audio utterances, and data augmentation results in augmented database size of 2140 audio utterances. Praseetha et al. [19] used data augmentation methods in time domain by stretching of audio signal duration and resampling of input signal. Along with data augmentation, all emotion class wise audio utterance percentages are made same with oversampling the lower distribution classes. Liu et al. [20] used variations of data balancing technique to nullify the effect of biasing by major class. In proposed work, Synthetic Minority Oversampling Technique (SMOTE) is used for increasing the data from minority classes. In proposed work, we used data augmentation and SMOTE as data balancing method for German language database EMoDB. After converting into a balanced dataset, the extraction of the most discriminant features is essential.
3.4 Feature extraction
The proposed work creates a baseline feature vector by employing feature fusion. Each sub-set of baseline feature vector $f$ has spectral features, time-domain features, and energy-based features, as shown in Eq. (4).
$f=f\{m, d m, d 2 m, f d w t, f c h r o, f L m e l S, z c r, r m s e\}$ (4)
3.4.1 Spectral features
After pre-processing, a baseline fusion feature vector of size 201 is formed. It consists of a fusion of time domain and frequency domain features. Frequency domain features are the mean of frame-level spectral features such as Mel Frequency Cepstral Coefficients (MFCCs), delta MFCCs, double delta MFCCs, Chroma features, and Mel-spectrogram coefficients. Time domain features include the mean of zero crossing rate and root mean square energy. All features are extracted using the Librosa library [21].
$f m e l=\frac{c \log \left(1+\frac{f}{c}\right)}{\log (2)}$ (5)
where, fmel is the logarithmic representation of frequency f.
$f a=$ Statistical Features of $\{c A 4, c D 4, c D 3, c D 2, c D 1\}$ (6)
It provides both time and frequency domain localization of signal. In proposed work, Db4 Wavelet Transform is used. discrete wavelet transform perform signal analysis with multi sub band resolution. It is represented by Eq. (7).
$T m, n=\int_{-\infty}^{\infty} x(t) \psi m, n(t) d t$ (7)
where, ψ(t) is mother Wavelet (Db4).
With pywavelet [22], 4- level multi resolution sub-band decomposition [15], four statistical descripters Mean ($\mu$), Minimum (minv), Maximum (maxv), and Standard Deviation (SD) wavelet features are extracted of five sub-bands as represented in Eq. (6). Total 5 subbands of 4 statistical features i.e. 20 discrete wavelet coefficients are extracted per utterance.
3.4.2 Time domain feature-zero crossing rate (ZCR)
Zero crossing rate is mainly used to distinguish the signal and silence portion of input speech. ZCR_mean is extracted from the audio recordings of the EMoDB dataset. Figure 4 shows variation in ZCR_mean for all seven emotion classes of EMoDB.
Figure 4. Emotion wise ZCR_mean variation
3.4.3 Energy based feature-root mean square energy
Utterance-wise root mean square energy (RMSE) of input speech $x(n)$ is extracted using Eq. (8).
rmse $x(n)=\sqrt{\frac{1}{N}}\left|x(n)^2\right|$ (8)
For every emotion, there is considerable variation in RMSE.
3.5 Feature selection
To overcome the curse of dimensionality, a reduced feature set is obtained by employing unsupervised principle component analysis (PCA) [3], Various filter-based methods, Analysis of Variance (ANOVA) [15, 23] wrapper method and vector quantization (VQ) [14] are employed by researchers for dimensionality reduction. Bandela and Kumar [7] have introduced feature selection based on adaptive structure learning and unsupervised Ordinal Locality This feature subset reduced training time along with better emotion recognition accuracy in noisy environments. Sheikhan et al. [23] have used ANOVA F1-score-based feature selection to identify distinct features. Sheikhan et al. [23] identified F-score to obtain the emotion discriminating features for different combinations of classes. In the proposed work, two-dimensionality reduction approaches, ANOVA and PCA, separate the most precise and emotion-specific features
Analysis of Variance (ANOVA): The feature selection approach aims to obtain a subset of relevant and reduced features from a bigger feature space to make subsequent analysis efficient. In the proposed work, we used filter-based ANOVA feature selection method for Level 4- decomposed statistical features of DWT Statistical features like Mean, Minimum (minv), Maximum (maxv), SD for each sub-band coefficient of the Four Level DWT, namely cA4, cD4, cD3, cD2, cD1 i.e. in total 20 features for the audio was extracted as described in section 3.4. Figure 5 depicts the box plot of sub-band features cA4_sd and cD4_sd for all emotion classes. ANOVA statistical test is used to select the most significant of these statistical features for all the coefficients. F-ratio and p-value suggestively identify the discriminating features based on F-ratio ranking; only six features having the top six values are selected in proposed work, as depicted in Table 2.
Figure 5. Box plot of cA4_sd and cD4_sd features
Table 2. Discriminative sub band features based on ANOVA
|
Rank Based on F-Ratio |
1 |
2 |
3 |
4 |
5 |
6 |
|
$f a$ |
cA4-sd |
cA4-minv |
cD4-sd |
cD4-maxv |
cD4-minv |
cA4-maxv |
Principle Component Analysis (PCA): PCA is an unsupervised learning-based dimensionality reduction algorithm. It represents the principle components Based on eigenvalue and eigenvector [3]. Direction of maximum variance is indicated with selected principal components. Univariate and multivariate analysis is performed in explorative data analysis of extracted statistical 12 mean_chroma features. Multivariate analysis of pitch class based 12 Chroma _mean features shows a high correlation amongst all seven emotion classes. Therefore, PCA is applied to the chroma feature set. By applying PCA on 12 mean_chroma features, it is observed that only three principle components are sufficient to represent 90% of the variance. Finally, only three PCA components are selected to represent the mean_chroma feature vector. After employing feature selection algorithms, reduced feature vector $f(r)$ represented by Eq. (9) size is reduced 178.
$f(r)=f\{m, d-m, d 2-m, f a, f P C A, f$ LmelS, zcr, rmse $\}$ (9)
In the next step classifiers are trained with, reduced feature vector $f(r)$ Most of the researchers used various machine learning classifiers such as SVM [24], K-Nearest Neighbors (KNN) [16], decision tree etc.
SVM is majorly used by researchers [5, 13, 14, 24-26] since various kernel such as radial basis function, linear, sigmoid, polynomial contribute in separating data into high dimensional space for classification. Multi-layer Perceptron (MLP) is a basic neural network suitable for SER supervised classification task [27, 28]. The number of hidden layers in between input and output layer decides depth of MLP. Authors [25, 29] used bagging and boosting ensemble learning approach for stable and improved SER performance. Extreme Gradient Boosting (XGBoost) is popular due to its parallel structure, efficiency, inbuilt capabilities of regularization to avoid overfitting and handling missing values [29, 30]. XGBoost aggerates individual models iteratively into ensemble by reducing root mean square error at each step. This results in efficiency in speed and performance. Therefore, in proposed work three different classifiers SVM, MLP and XGBoost classifiers are used for testing the performance of proposed reduced feature vector of SER. All these classifiers can also be used in limited resources unlike deep learning classifiers. To ensure robustness of proposed SER model and performance validation both SD and SI classification experiments are carried out [7]. To ensure performance accuracy, reliability exhaustive experimentation of SD experiments with holdout Cross Validation (CV) method and stratified k-fold cross validation with k=5 and k=10 are explored. In machine learning based SER, SI approach is less explored. In our work, for SI experiments leave-one-speaker-out (LOSO) and leave-two-speakers-out (LTSO) approaches are explored. Details of experiment with basic dataset and augmented dataset along with SMOTE for data balancing are explained in detail in further subsections.
4.1 SD experiments
In these experiments, distribution of 80:20 for training and validation data is employed. After dimensionality reduction, reduced feature vector is subjected to standard scalar and balancing with SMOTE and further fed to classifier for training. This is done for basic dataset and augmented dataset, to analyze effect of data augmentation. Performance measures of accuracy, precision, recall and F1-score majorly used in multiclass classification i.e. speech based emotion recognition are used [1].
4.1.1 SD Experiment + SMOTE + Holdout cross validation with basic EMoDB dataset
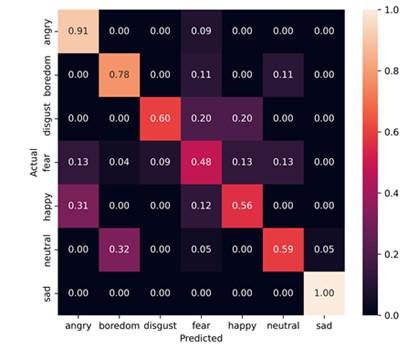
For basic EMoDB database, emotion classes of 7, average performance accuracy with SVM classifier is 62.62%, 65.42% and 69.16% for baseline (F), Baseline+ANOVA selected DWT (f+fa) and proposed reduced feature vector f(r) respectively. In SVM the hyper parameters ‘C’ of RBF kernel is set to 10. Figure 6 represents confusion matrix for MLP classifier with proposed reduced feature vector with SMOTE. From Figure 6, it is evident that angry and sad emotion classes have better recall for MLP classifier. As observed in Table 3, average accuracy is improved for reduced feature vector experiments as compared to baseline and baseline with ANOVA selected wavelet features. Without data augmentation, average performance accuracy of 69.16%, 68.22% and 63.55% are obtained for SVM, MLP and XGBoost classifiers respectively.
Figure 6. Confusion matrix of MLP classifier with 80:20 holdout CV for basic EMoDB
4.1.2 SD Experiment + SMOTE +Holdout cross validation with Augmented EMoDB dataset
After employing three different data augmentation methods of GN, PS and TS [3, 19] database size increased by four times. Proposed Feature vector expressed with Eq. (4) is extracted and after feature selection, reduced feature vector $f(r)$ is used for training and validation. With data augmentation methods, significant improvement in average performance accuracy is achieved listed in Table 3.
From Table 3, it is observed that the average recognition accuracy obtained from SVM classifier with radial basis function (RBF) kernel and hyperparameter C=10 is improved significantly in case of classification using augmented dataset as compared to that using basic dataset. From Figure 6 and Figure 7, it is observed that results of MLP classifier are better for all emotion classes. With the use of augmented EMoDB dataset and SMOTE for data balancing, ensemble Gradient Boosting i.e. XGBoost classifier has also shown significant improvement from 62.62% to 86.68% in overall performance accuracy. From Figure 7, it is clear that for augmented EMoDB database, angry emotion class has highest detection accuracy in the range of 99% for MLP classifier.
Table 3. Average accuracy (%) for SD experiments with 80:20 holdout
|
SD Experiment |
Feature Vector (FV) |
FV Size |
SVM(RBF) (%) |
MLP |
XGBoost |
|
Basic Dataset + SMOTE |
$f$ |
201 |
62.62 |
66.35 |
60.75 |
|
$f+f a$ |
207 |
65.42 |
68.14 |
62.23 |
|
|
$f(r)$ |
178 |
69.16 |
68.22 |
63.55 |
|
|
Augmented Dataset + SMOTE |
$f$ |
201 |
90.88 |
94.16 |
84.81 |
|
$f+f a$ |
207 |
91.12 |
94.15 |
83.88 |
|
|
$f(r)$ |
178 |
93.69 |
94.63 |
86.68 |
f Baseline, $f+f a$: Baseline+ANOVA selected DWT
$f(r)$: Proposed Reduced Feature Vector
Figure 7. Confusion matrix of MLP classifier with 80:20 holdout CV for Augmented EMoDB
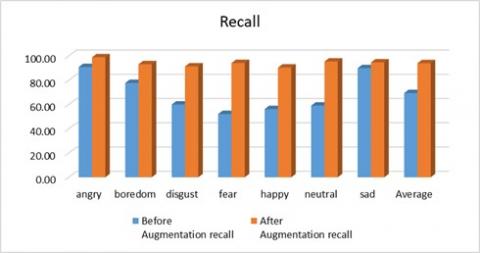
Figures 8 (a) and (b) depicts effect of data augmentation on the performance measures average accuracy, precision and recall in case of speaker dependent experiment for MLP classifier with basic and augmented EMoDB for holdout cross validation.
4.1.3 SD Experiments with k-fold cross validation with basic and augmented EMoDB
To overcome overfitting and demonstrate robustness of model performance validation is carried out on augmented audio data with stratified 5-fold and 10-fold cross validation. Mean and standard deviation scores for stratified 5-fold and 10-fold are listed in Table 4.
Table 4. Performance of k-fold cross validation for SD experiments with proposed reduced feature set $f(r)$
|
SD Experiment |
Classifier |
Mean Accuracy (%) |
Standard Deviation |
Mean Accuracy (%) |
Standard Deviation |
|
|
Fold |
K=5 |
K=10 |
||
|
Basic Dataset + SMOTE |
SVM(RBF) |
71.96 |
0.06 |
73.07 |
0.04 |
|
MLP |
71.40 |
0.04 |
74.94 |
0.05 |
|
|
XGBoost |
68.60 |
0.05 |
71.02 |
0.04 |
|
|
Augmented Dataset + SMOTE |
SVM(RBF) |
92.57 |
0.01 |
93.18 |
0.02 |
|
MLP |
93.41 |
0.01 |
94.07 |
0.02 |
|
|
XGBoost |
86.51 |
0.01 |
87.15 |
0.02 |
|
(a) Precision
(b) Recall
Figure 8. Effect of data augmentation on performance measures
4.2 SI experiments
SI approach is essential for robust SER system. In proposed work, to assure robustness, two approaches of cross validation are employed.
4.2.1 LOSO approach
In this approach, out of 10 speakers of EMoDB, each time only one speaker forms the test set and rest 9 speakers form the corresponding training set. This is repeated 10 times and average accuracy is obtained for these 10 fold for basic and augmented EmoDB dataset. Figure 9 shows comparison of fold-wise accuracy for each speaker in augmented EMoDB with SVM (RBF), MLP and XGBoost Classifier. It is observed that, for augmented dataset average accuracy of Speaker 3,8,9,10,12,13,14,15 has accuracy equal to or above 60% whereas speaker 11 and 16 has less accuracy. Speaker 16 has lowest avg. performance accuracy as compared to rest all speakers.
Figure 9. Fold-wise average performance accuracy (%) for LOSO experiment (augmented EMoDB)
4.2.2 LTSO approach
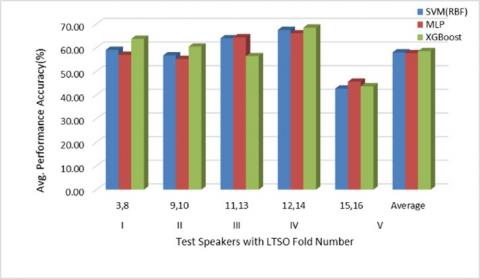
Another approach used for speaker independent experiment is leave two speaker out (LTSO). In proposed work, in every fold two speaker’s combination of one male and one female such as (3,8), (9,10), (11,13), (12,14) and (15,16) are assigned as test set whereas remaining all 8 speakers except speakers in test set are assigned in training set. Such 5-folds of LTSO approach are evaluated on basic and augmented dataset. Figure 10 shows fold wise average performance accuracy of LTSO. It is observed that, with fold IV (12,14) test speakers highest average accuracy of 68.27%, 67.50%, 68.50% is obtained with SVM (RBF), MLP and XGBoost classifiers respectively.
Figure 10. Speaker-wise average performance accuracy (%) for LTSO experiment (augmented EMoDB)
Table 5 represents summary of both Leave One Speaker Out (LOSO) and Leave Two Speaker Out (LTSO) methods adopted for speaker independent experiments for EMoDB dataset.
Table 5. SI experiments summary with proposed reduced feature set $f(r)$
|
Classifier |
Basic EMoDB |
Augmented EMoDB |
||
|
LOSO |
LTSO |
LOSO |
LTSO |
|
|
10-fold (%) |
5-fold (%) |
10-fold (%) |
5-fold (%) |
|
|
SVM(RBF) |
52.35 |
55.88 |
58.75 |
58.04 |
|
MLP |
55.16 |
55.18 |
58.29 |
57.69 |
|
XGBoost |
55.42 |
56.28 |
60.94 |
58.59 |
4.3 Explainability: With SHAP analysis
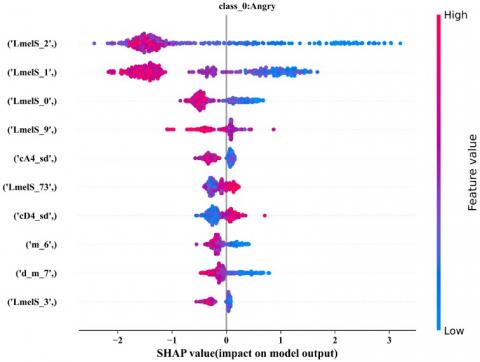
Literatures [11, 31, 32] show SHAP, LIME library are used for interpretation of black box model results. Pham et al. [31] interpreted contribution of sliding window concept based features. Yildirim et al. [32] used SHAP for identification of most contributory features with respect to gender and emotion. In proposed work, trained model of XGBoost classifier is analyzed in detail for explainability. After fitting of model, feature importance is observed for proposed reduced feature set. From experimentation results of XGBoost ensemble learning classifier [29] analysis of all test set, SHAP values are studied. Figure 11 shows the first 10 contributing features in a sorted order from the proposed reduced feature set contributing in final prediction of respective emotion class. It shows the summary of SHAP value plot for XGBoost classifier with average performance accuracy of 86.68% for seven different emotion class. From Figure 11, it is clear that PCA1 component from reduced feature vector is the major contributor for prediction of emotion class 6 i.e. ‘sad’. Also cD4_sd DWT feature is amongst top -5 contributing features in detection of emotion class 0. i.e. 'angry.
Figure 11. SHAP summary plot of test data for XGBoost Classifier with proposed reduced feature vector $f(r)$
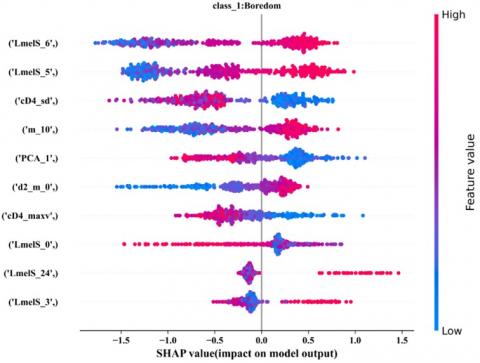
(a) Angry emotion class
(b) Boredom emotion class
Figure 12. SHAP values of respective emotion classes showing first ten most contributory features
For detail insight, Figures 12 (a) and (b) shows SHAP values of emotion class angry and boredom emotion class with first ten most contributory features for prediction of respective emotion class. Order of all features with their contribution in prediction of class 0 i.e. 'angry' is as indicated in Figure 12 (a). where m_i, d_m_i d2_m_i represents value of ith feature of mean out of 13 MFCC, 13 delta-MFCC and 13 double delta MFCC features respectively. LmelS_i represents mean value of ith feature out of 128 log-mel Spectrogram features used in feature vector. PCA1, PCA2 and PCA3 represent the principle components of Chroma features in reduced feature set.
Table 3 shows that for speaker-dependent experiments with holdout cross-validation, significant improvement is observed for reduced feature vector compared with only baseline and feature combination of baseline with ANOVA selected discrete wavelet features for both basic and augmented EMoDB. After augmentation, SVM (RBF) average accuracy performance got improved from 69.16% to 93.69%, for XGBoost classifier accuracy improved from 63.55% to 86.68% and for MLP classifier accuracy improved from 68.22% to 94.63% for proposed reduced feature vector. From Table 4, it is clear that speaker-dependent results of stratified 10-fold are robust as performance of SVM (RBF), XGBoost, and MLP classifier are almost the same for 5-fold and improved as compared with holdout performance. This signifies the robustness of the proposed SER. Comparing Figure 6 and Figure 7, confusion matrix of MLP classifier with basic EMoDB and augmented EMoDB depicts that deviation of each individual emotion class from average performance is improved significantly after augmentation. The effect of data augmentation is well signified by the graphical presentation of performance measures precision and recall with Figures 8 (a) and (b) respectively. For SVM(RBF) classifier, the highest average accuracy of 69.16% obtained with $f(r)$ with basic EMoDB has an average recall (UAR) of 68.11%.
Speaker-independent experimentation results listed in Table 5 show that a maximum average performance accuracy of 60.94% is obtained for LOSO and 58.59% for the LTSO approach, respectively. From Figures 11 and 12, the contribution of each feature from the reduced feature vector for each emotion class in the test dataset is well explained. From Figures 12 (a) and (b) it is evident that the proposed reduced feature set formation is justified by observing the class-wise feature value of the first ten contributing features. As observed in Figure 12 (a) for prediction of angry emotion class, logMelS_1 to 3, cD4_sd, logMelS_9, logMelS_11, 6th and 11th MFCC along with MFCC double derivative 4 i.e. d2_m_4 are majorly contributing features. With the use of SHAP [33], the proposed reduced feature is well explained for distinct emotion classes of German language-based speech emotion classification and prediction of emotion classes with interpretation. The proposed robust and explainable SER system is listed in Table 6, with state-of-the-art work carried out by the researcher on the German language open source database EMoDB. Table 6 depicts performance comparison with state of art for speaker dependent approach. In speaker independent approach, maximum average weighted accuracy of 64.52% with leave-two-speaker-out (LTSO) approach is obtained.
Table 6. State of art comparison of speaker dependent SER experiment on EMoDB
|
Ref. |
Features |
Classifier |
CV |
Avg. Acc. (%) |
|
Kanth and Saraswathi [24] |
Opensmile - 6553 features |
SVM |
10-fold |
77.7 |
|
Kuchibhotla et al. [6] |
MFCC + Derivatives + SFFS |
SVM |
Holdout (70:30) |
88.1 |
|
Palo and Mohanty [14] |
MFCC +wavelet +spectral |
SVM |
Holdout (80:20) |
91.82 |
|
Bhavan et al. [25] |
MFCC |
Ensemble SVM |
Holdout (70:30) |
92.45 |
|
Proposed Work |
Reduced Feature Vector $f(r)$ + Augmentation + SMOTE |
SVM MLP XGBoost |
Stratified 5-fold |
92.57 93.41 86.51 |
|
Proposed Work |
Reduced Feature Vector $f(r)$ + Augmentation + SMOTE |
SVM MLP XGBoost |
Stratified 10-fold |
93.69 94.15 86.68 |
Avg.Acc: Average Accuracy
Proposed work with novel feature fusion improved the SER accuracy using German language database EMoDB. Use of supervised feature selection method ANOVA, for distinct discrete wavelet transform level-4 using dB4 (DWT) based features as well as derived principle components for chroma features reduced feature vector $f(r)$ from 201 to 178.This enhances the performance of SER significantly. Performance of novel reduced feature vector $f(r)$ is validated using exhaustive SD experiments with support vector machine (RBF), MLP and ensemble XGBoost classifier with holdout and k-fold with k=5 and k=10 cross validation experiments.
The proposed novel reduced feature vector $f(r)$ shows significant improvement in the performance on employing data augmentation and SMOTE data balancing technique. In case of speaker dependent experiments using augmented EMoDB, the average performance accuracy improved from 68.22% to 94.63% for MLP classifier while the average accuracy increased from 69.16% to 93.69% and 63.55% to 86.68% with SVM(RBF) and XGBoost classifiers respectively. Robustness of the SER is also demonstrated through the k-fold cross validation experiments with k=5 and K=10 where considerable improvement in average accuracy is observed with augmented EMoDB as compared to that with basic EMoDB dataset. For stratified 10-fold cross validation using augmented EMoDB dataset, average performance accuracy is seen to improve from 73.07% to 93.18% with SVM (RBF) classifier while it is boosted from 74.14% to 94.07% and 71.02% to 87.15% with MLP and XGBoost classifier respectively.
In case of speaker dependent approach, proposed explainable SER performs better as compared to state of art experiments. Proposed work can be used in many applications of human machine interface. For speaker independent experiments maximum performance accuracy of 60.94%, 58.59% of is obtained respectively in case of LOSO and LTSO methods. The current work can be further extended by employing adaptive techniques in feature selection, classification for improving the performance of speaker independent approach.
[1] Swain, M., Routray, A., Kabisatpathy, P. (2018). Databases, features and classifiers for speech emotion recognition: A review. International Journal of Speech Technology, 21: 93-120. https://doi.org/10.1007/s10772-018-9491-z
[2] Chatterjee, R., Mazumdar, S., Sherratt, R.S., Halder, R., Maitra, T., Giri, D. (2021). Real-time speech emotion analysis for smart home assistants. IEEE Transactions on Consumer Electronics, 67(1): 68-76. https://doi.org/10.1109/TCE.2021.3056421
[3] Shinde, A.S., Patil, V.V., Khadse, K.R., Jadhav, N., Joglekar, S., Hatwalne, M. (2022). ML based speech emotion recognition framework for music therapy suggestion system. In 2022 6th International Conference on Computing, Communication, Control and Automation (ICCUBEA), Pune, India, pp. 1-5. https://doi.org/10.1109/ICCUBEA54992.2022.10011091
[4] Bhangale, K.B., Mohanaprasad, K. (2021). A review on speech processing using machine learning paradigm. International Journal of Speech Technology, 24: 367-388. https://doi.org/10.1007/s10772-021-09808-0
[5] Deb, S., Dandapat, S. (2019). Multiscale amplitude feature and significance of enhanced vocal tract information for emotion classification. IEEE Transactions on Cybernetics, 49(3): 802-815. https://doi.org/10.1109/TCYB.2017.2787717
[6] Kuchibhotla, S., Vankayalapati, H.D., Anne, K.R. (2016). An optimal two stage feature selection for speech emotion recognition using acoustic features. International Journal of Speech Technology, 19: 657-667. https://doi.org/10.1007/s10772-016-9358-0
[7] Bandela, D.S.R., Kumar, T.K. (2021). Unsupervised feature selection and NMF de-noising for robust Speech Emotion Recognition. Applied Acoustics, 172: 107645. https://doi.org/10.1016/j.apacoust.2020.107645
[8] Singh, C., Kumar, A., Nagar, A., Tripathi, S., Yenigalla, P. (2019). Emoception: An inception inspired efficient speech emotion recognition network. In 2019 IEEE Automatic Speech Recognition and Understanding Workshop (ASRU), Singapore, pp. 787-791. https://doi.org/10.1109/ASRU46091.2019.9004020
[9] Shinde, A.S, Patil, V.V. (2021). Speech emotion recognition system: A review. In Proceedings of the 4th International Conference on Advances in Science & Technology (ICAST2021). http://doi.org/10.2139/ssrn.3869462
[10] Ribeiro, M.T., Singh, S., Guestrin, C. (2016). “Why should i trust you?”: Explaining the predictions of any classifier. In Proceedings of the 22nd ACM SIGKDD International Conference on Knowledge Discovery and Data Mining, San Francisco, California, USA, pp. 1135-1144. https://doi.org/10.1145/2939672.2939778
[11] Lundberg, S.M., Lee, S.I. (2017). A unified approach to interpreting model predictions. In Proceedings of the 31st International Conference on Neural Information Processing Systems, Long Beach, California, USA, pp. 4768-4777. https://doi.org/10.5555/3295222.3295230
[12] Madanian, S., Chen, T., Adeleye, O., Templeton, J.M., Poellabauer, C., Parry, D., Schneider, S.L. (2023). Speech emotion recognition using machine learning — A systematic review. Intelligent Systems with Applications, 20: 200266. https://doi.org/10.1016/j.iswa.2023.200266
[13] Ancilin, J., Milton, A. (2021). Improved speech emotion recognition with Mel frequency magnitude coefficient. Applied Acoustics, 179(3): 108046. https://doi.org/10.1016/j.apacoust.2021.108046
[14] Palo, H.K., Mohanty, M.N. (2018). Wavelet based feature combination for recognition of emotions. Ain Shams Engineering Journal, 9(4): 1799-1806. https://doi.org/10.1016/j.asej.2016.11.001
[15] Shinde, A.S., Patil, V.V. (2023). Performance improvement in speech based emotion recognition with DWT and ANOVA. Communications in Mathematics and Applications, 14(3): 1189-1198. https://doi.org/10.26713/cma.v14i3.2389
[16] Koduru, A., Valiveti, H.B., Budati, A.K. (2020). Feature extraction algorithms to improve the speech emotion recognition rate. International Journal of Speech Technology, 23: 45-55. https://doi.org/10.1007/s10772-020-09672-4
[17] Nagarajan, S., Nettimi, S.S.S., Kumar, L.S., Nath, M.K., Kanhe, A. (2020). Speech emotion recognition using cepstral features extracted with novel triangular filter banks based on bark and ERB frequency scales. Digital Signal Processing, 104(9): 102763. https://doi.org/10.1016/j.dsp.2020.102763
[18] Burkhardt, F., Paeschke, A., Rolfes, M., Sendlmeier, W.F., Weiss, B. (2005). A database of German emotional speech. In INTERSPEECH 2005 - Eurospeech, 9th European Conference on Speech Communication and Technology, Lisbon, Portugal, pp. 1517-1520. https://api.semanticscholar.org/CorpusID:13920681
[19] Praseetha, V.M., Joby, P.P. (2022). Speech emotion recognition using data augmentation. International Journal of Speech Technology, 25: 783-792. https://doi.org/10.1007/s10772-021-09883-3
[20] Liu, Z.T., Wu, B.H., Li, D.Y., Xiao, P., Mao, J.W. (2020). Speech emotion recognition based on selective interpolation synthetic minority over-sampling technique in small sample environment. Sensors, 20(8): 2297. https://doi.org/10.3390/s20082297
[21] McFee, B., Raffel, C., Liang, D., Ellis, D.P.W., McVicar, M., Battenberg, E., Nieto, O. (2015). Librosa: Audio and music signal analysis in Python. SciPy. https://doi.org/10.25080/Majora-7b98e3ed-003
[22] Lee, G.R., Gommers, R., Waselewski, F., Wohlfahrt, K., O’Leary, A. (2019). PyWavelets: A Python package for wavelet analysis. Journal of Open Source Software, 4(36): 1237. https://doi.org/ 10.21105/joss.01237
[23] Sheikhan, M., Bejani, M., Gharavian, D. (2013). Modular neural-SVM scheme for speech emotion recognition using ANOVA feature selection method. Neural Computing and Applications, 23: 215-227. https://doi.org/10.1007/s00521-012-0814-8
[24] Kanth, N.R., Saraswathi, S. (2015). Efficient speech emotion recognition using binary support vector machines & multiclass SVM. In 2015 IEEE International Conference on Computational Intelligence and Computing Research (ICCIC), Madurai, India, pp. 1-6. https://doi.org/10.1109/ICCIC.2015.7435793
[25] Bhavan, A., Chauhan, P., Hitkul, Shah, R.R. (2019). Bagged support vector machines for emotion recognition from speech. Knowledge-Based Systems, 184: 104886. https://doi.org/10.1016/j.knosys.2019.104886
[26] Rumagit, R.Y., Alexander, G., Saputra, I.F. (2021). Model comparison in speech emotion recognition for indonesian language. Procedia Computer Science, 179: 789-797. https://doi.org/10.1016/j.procs.2021.01.098
[27] Alnuaim, A.A., Zakariah, M., Shukla, P.K., Alhadlaq, A., Hatamleh, W.A., Tarazi, H., Sureshbabu, R., Ratna, R. (2022). Human-computer interaction for recognizing speech emotions using multilayer perceptron classifier. Journal of Healthcare Engineering, 2022: 6005446. https://doi.org/10.1155/2022/6005446
[28] Pan, S.T., Wu, H.J. (2023). Performance improvement of speech emotion recognition systems by combining 1D CNN and LSTM with data augmentation. Electronics, 12(11): 2436. https://doi.org/10.3390/electronics12112436
[29] Mohan, M., Dhanalakshmi, P., Kumar, R.S. (2023). Speech emotion classification using ensemble models with MFCC. Procedia Computer Science, 218: 1857-1868. https://doi.org/10.1016/j.procs.2023.01.163
[30] Guo, Y., Xiong, X.J., Liu, Y.C., Xu, L., Li, Q. (2022). A novel speech emotion recognition method based on feature construction and ensemble learning. PloS One, 17(8): e0267132. https://doi.org/10.1371/journal.pone.0267132
[31] Pham, N.T., Nguyen, S.D., Nguyen, V.S.T., Pham, B.N.H., Dang, D.N.M. (2023). Speech emotion recognition using overlapping sliding window and Shapley additive explainable deep neural network. Journal of Information and Telecommunication, 7(3): 317-335. https://doi.org/10.1080/24751839.2023.2187278
[32] Yildirim, H.E., Iren, D. (2023). Informative speech features based on emotion classes and gender in explainable speech emotion recognition. In 2023 11th International Conference on Affective Computing and Intelligent Interaction Workshops and Demos (ACIIW), Cambridge, MA, USA, pp. 1-8. https://doi.org/10.1109/ACIIW59127. 2023.10388158
[33] Loveleen, G., Mohan, B., Shikhar, B.S., Nz, J., Shorfuzzaman, M., Masud, M. (2023). Explanation-driven HCI model to examine the mini-mental state for Alzheimer’s disease. ACM Transactions on Multimedia Computing, Communications, and Applications, 20(2): 1-16. https://doi.org/10.1145/3527174