Shuling Liang![]()
© 2024 The author. This article is published by IIETA and is licensed under the CC BY 4.0 license (http://creativecommons.org/licenses/by/4.0/).
OPEN ACCESS
With the continuous growth of global energy demand and escalating environmental issues, enhancing building energy efficiency has become a critical challenge for many countries. Buildings, as major energy consumers, require precise energy efficiency analysis and diagnosis to achieve energy conservation and emission reduction goals. In recent years, the application of image processing and thermal imaging technologies in building energy efficiency analysis has become increasingly widespread. These technologies provide accurate energy efficiency assessments, aiding in the identification and resolution of energy efficiency issues within buildings. However, existing methods face numerous challenges in handling complex thermal imaging data and segmenting energy efficiency states, often failing to comprehensively reflect the actual energy performance of buildings. This paper proposes a novel approach to building energy efficiency analysis and diagnosis by integrating image processing and thermal imaging technologies. The approach comprises two main components. First, a selection search algorithm tailored for building infrared thermal images is introduced to enhance the precision and efficiency of thermal image processing. Second, a new method for segmenting building energy efficiency states is proposed, utilizing the (SHapley Additive exPlanations) SHAP attribution clustering algorithm to provide a more comprehensive and accurate evaluation of building energy performance. These advancements address the limitations of existing methods and offer new technical means for building energy efficiency analysis. The proposed approach not only improves the precision of energy efficiency assessments but also has significant application value and potential for widespread adoption. This research contributes to the ongoing efforts in energy conservation and provides a robust framework for future studies in building energy efficiency diagnostics.
building energy efficiency, image processing, thermal imaging technology, selection search algorithm, (SHapley Additive exPlanations) SHAP attribution clustering algorithm, energy efficiency state segmentation
With the continuous increase in global energy consumption and the worsening of environmental issues, building energy efficiency has become an important topic of concern for countries around the world. As one of the main sources of energy consumption, the improvement of building energy efficiency can not only significantly reduce energy consumption but also reduce greenhouse gas emissions [1-5]. In recent years, the application of image processing and thermal imaging technologies in building energy efficiency analysis and diagnosis has gradually increased. These advanced technologies can provide more accurate and detailed energy efficiency assessments, helping to promptly identify and solve energy efficiency problems in buildings [6, 7].
Using image processing and thermal imaging technologies for building energy efficiency analysis and diagnosis has important research significance. These technologies can help identify issues such as thermal bridges, insulation defects, and air leaks in buildings, and can also provide specific energy efficiency improvement plans [8-10]. The application of these technical means can not only improve the accuracy and efficiency of energy efficiency analysis but also provide scientific basis for energy-saving renovations, thereby promoting the green development and sustainable development of the construction industry [11, 12].
Although image processing and thermal imaging technologies have been widely used in building energy efficiency analysis, existing methods still have some shortcomings. For example, traditional image processing algorithms may be affected by noise and environmental factors when processing complex thermal imaging data, leading to inaccurate analysis results [13-16]. In addition, existing methods for segmenting energy efficiency states often lack specificity and fail to comprehensively reflect the actual energy efficiency state of buildings [17-22]. Therefore, it is urgent to develop more efficient and accurate analysis methods to enhance the reliability and practicality of building energy efficiency assessments.
The main research content of this paper includes two parts. First, a selection search algorithm for building infrared thermal images is proposed to improve the precision and efficiency of thermal image processing. Second, a method for segmenting building energy efficiency states based on the SHAP attribution clustering algorithm is proposed to provide a more comprehensive and accurate evaluation of building energy efficiency states. These studies can not only compensate for the shortcomings of existing methods but also provide new technical means for building energy efficiency analysis, with important application value and prospects for promotion.
In building energy efficiency analysis and diagnosis, infrared thermal imaging technology can effectively detect issues such as thermal bridges, insulation defects, and air leaks in buildings. However, during the processing of building infrared thermal images, temperature distribution is influenced not only by building materials and structures but also by environmental factors (such as sunlight exposure and wind speed). Therefore, it is crucial to accurately select candidate regions and eliminate background noise. This chapter proposes a selection search algorithm based on the temperature distribution characteristics of building infrared thermal images. The algorithm is designed to identify image region features and proposes a screening strategy for thermal anomaly candidate regions and their corresponding local background regions in single-layer infrared thermal images. The algorithm flow is shown in Figure 1. This method not only identifies stable thermal anomaly regions in temperature change trends captured at different time points but also precisely locates energy efficiency issues in buildings, ultimately achieving automatic identification and localization of thermal anomalies at various building levels.
The selection search algorithm is a heuristic target localization algorithm that combines image segmentation. It segments and merges images through a set of diverse, complementary, and hierarchical grouping strategies, considering the diversity of objects in the image and the hierarchy of the layout. Compared to exhaustive search algorithms, the selection search algorithm significantly reduces the search space. In building energy efficiency analysis and diagnosis, the selection search algorithm also has high feasibility. In building infrared thermal images, temperature distribution reflects the thermal characteristics of structures such as walls and windows and is influenced by external environmental factors. The selection search algorithm can effectively extract key regions with potential thermal anomalies from infrared thermal images.
Figure 1. Selection search algorithm for building infrared thermal images
Specifically, the target regions in building infrared thermal images can be of any size and may not have clear contour edges. Therefore, all possible target scales must be considered in the selection search. Traditional exhaustive algorithms use the sliding window method, which traverses all possible image sizes. Although comprehensive, this method results in massive computations, often generating hundreds of thousands of candidate boxes. In contrast, the selection search algorithm, by implementing a hierarchical approach, limits the number of candidate boxes to tens or thousands, significantly reducing the computational load and accelerating the implementation speed. Additionally, in building infrared thermal images, thermal anomalies can be caused by various factors, such as thermal bridge effects of walls or roofs, missing insulation materials, and air leaks. These anomaly regions' temperature distributions are often affected by surrounding environmental and lighting conditions. Therefore, multiple strategies need to be employed to measure similarity in target localization, rather than relying on a single strategy. The selection search algorithm effectively addresses image variations caused by lighting changes, shadows, etc., by combining multiple features such as color consistency, texture similarity, and region compactness for candidate region segmentation and merging.
To apply the selection search algorithm for energy efficiency analysis and fine localization of key parts in building infrared thermal images (see Figure 2), the following steps can be followed:
(1) First, preprocess a single-frame building infrared thermal image, using image segmentation methods to over-segment the image into v initial regions e1,e2,...,ev. These initial regions form the initial region set E={e1,e2,...,ev}. Simultaneously, initialize an empty similarity set T for subsequent calculations.
(2) Next, calculate the similarity t(eu,ek) between each pair of adjacent regions in the building infrared thermal image. To improve accuracy, the selection search algorithm combines four complementary similarities for region merging:
a) Color similarity: Normalize the temperature values of each initial region eu to form a color histogram Zu={z1u,...,zvu}. By comparing the color histograms of adjacent regions eu and ek in the building infrared thermal image, calculate their color similarity. This method helps distinguish temperature differences on material surfaces. The color similarity between eu and ek can be calculated as follows:
$S C\left(e_u, e_k\right)=\sum_{j=1}^v {MIN}\left(z_u^j, z_k^j\right)$ (1)
Assuming the size of the initial region eu is represented by SI(eu), the expression for the color histogram of the new region euk formed by merging eu and ek is:
$Z_s=\frac{S I\left(e_u\right) \times Z_u+S I\left(e_k\right) \times Z_k}{S I\left(e_u\right)+S I\left(e_k\right)}$ (2)
$S I\left(e_{u k}\right)=S I\left(e_u\right)+S I\left(e_k\right)$ (3)
b) Texture similarity: Use the SIFT feature extraction method to calculate the texture features of each initial region. By comparing the texture features Su={s1u,...,svu} of adjacent regions eu and ek in the building infrared thermal image, calculate their texture similarity. Texture features in building infrared images can reflect the thermal behavior differences of different materials and structures. The texture similarity between eu and ek is:
$S T\left(e_u, e_k\right)=\sum_{j=1}^v {MIN}\left(s_u^j, s_k^j\right)$ (4)
The texture histogram of the new region euk formed by merging eu and ek is:
$S_{u k}=\frac{S I\left(e_u\right) \times S_u+S I\left(e_k\right) \times S_k}{{SI}\left(e_u\right)+S I\left(e_k\right)}$ (5)
c) Size similarity: Compare the sizes of adjacent regions in the building infrared thermal image and calculate their similarity. Size similarity plays an important role in ensuring that the merged results are undistorted and maintaining the structural integrity of thermal anomaly regions. Assuming the size of the entire grayscale image is represented by SI(ul), the calculation formula for size similarity is:
${TSI}\left(e_u, e_k\right)=1-\frac{S I\left(e_u\right)+S I\left(e_k\right)}{S I(u l)}$ (6)
d) Contour similarity: Consider the contour matching situation of regions in the building infrared thermal image and calculate the similarity. Contour similarity helps ensure that the merged regions have more natural boundaries, reflecting the actual structural features of the building. Assuming the bounding box surrounding regions eu and ek is represented by YYuk, the calculation formula is:
${TFI}\left(e_u, e_k\right)=1-\frac{S I\left(Y Y_{u k}\right)-S I\left(e_u\right)-S I\left(e_k\right)}{S I(u l)}$ (7)
(3) By comprehensively considering the above four similarities, calculate the comprehensive similarity of each pair of adjacent regions in the building infrared thermal image. The final similarity calculation formula is:
$\begin{aligned} & t\left(e_u, e_k\right)=x_1 S C\left(e_u, e_k\right)+x_2 {STE}\left(e_u, e_k\right) +x_3 {TSI}\left(e_u, e_k\right)+x_4 {TFI}\left(e_u, e_k\right)\end{aligned}$ (8)
Put all similarity values into the similarity set T, and then find the two adjacent regions eu and ek with the highest similarity. Merge these two regions into a new region and update the region set in the image.
$t\left(e_u, e_k\right)={MAX}(T)$ (9)
(4) Then, update the similarity set. Delete all related similarities of the merged regions and calculate the similarity between the new region and its adjacent regions. Add these new similarities to the similarity set. Repeat the above steps to gradually merge similar regions es.
$e_s=e_u \cup e_k$ (10)
(5) Continue the region merging and similarity updating cycle until the similarity set T is empty, marking the end of the merging process. At this point, the initial regions have been merged into a target region set E that represents key parts of the building infrared thermal image.
Figure 2. Flowchart of key part fine localization algorithm for energy efficiency analysis in building infrared thermal images
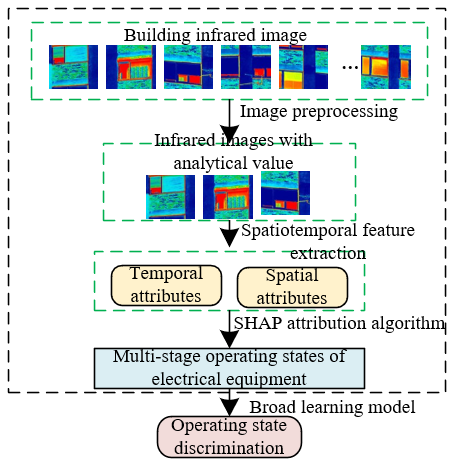
To segment different stages of building energy efficiency states and depict their energy efficiency change mechanisms, a visualization fault detection strategy based on the spatiotemporal characteristics of infrared thermal images and the SHAP attribution clustering algorithm is proposed. First, based on the infrared thermal image screening strategy, images with high foreground ratio values and high information entropy are selected. These images provide rich energy efficiency information and significant foreground regions, facilitating subsequent analysis. Second, for the screened infrared thermal images, their spatial features are extracted based on the Gray-level Co-occurrence Matrix (GLCM). By analyzing the spatial distribution of pixel grayscale values, the thermal patterns and structural features of different regions in infrared images can be revealed. Then, the temporal features of the infrared thermal images are further derived by differentiating the extracted spatial features. Temporal features reflect the energy efficiency changes and thermal behavior patterns of buildings at different stages. Figure 3 shows the flowchart of the energy efficiency state segmentation strategy based on spatiotemporal features. Figure 4 provides a schematic diagram of the spatial relationships between key points in infrared images.
Figure 3. Flowchart of energy efficiency state segmentation strategy based on spatiotemporal features
Figure 4. Schematic diagram of spatial relationships between pixels in infrared images
The change in the energy efficiency state of buildings is a gradual evolution process, meaning that the energy efficiency performance of buildings under actual conditions is multi-staged. Existing building energy efficiency analysis methods usually simplify the energy efficiency state into two stages: efficient and inefficient, which prevents the implementation of optimization measures before the energy efficiency declines. Therefore, to identify the stages of the building energy efficiency state and detail the energy efficiency change mechanisms, the SHAP attribution clustering algorithm is adopted. By visualizing the feature contributions of the spatiotemporal characteristics of thermal imaging data, the energy efficiency state of buildings can be segmented into multiple stages, rather than simply judging them as efficient or inefficient, thereby achieving refined energy efficiency diagnosis and optimization. This method not only helps to detect energy efficiency problems in advance but also provides managers with more detailed energy efficiency management strategies, ultimately improving the overall energy efficiency performance of buildings.
The SHAP attribution clustering algorithm is a post-hoc feature attribution external model interpretability method proposed by Scott M. in 2017. In the application scenario of building energy efficiency analysis and diagnosis, using the SHAP attribution clustering algorithm for building energy efficiency state segmentation is highly feasible. This algorithm can analyze thermal imaging data and other related building energy efficiency data to calculate the contribution of each feature to the overall energy efficiency state of the building, thereby identifying key features. This method not only provides intuitive and interpretable energy efficiency state analysis results but also significantly improves the accuracy and consistency of energy efficiency state segmentation, helping to better understand and optimize building energy efficiency management and improve energy utilization efficiency.
The best explanation of a simple model is the model itself. However, for complex models such as ensemble methods or deep learning, although these models can provide more accurate results, the details of their decision-making process cannot be precisely understood. Therefore, in the application scenario of building energy efficiency analysis and diagnosis, for complex models d that predict building energy efficiency states, a simple model h needs to be defined to explain their prediction results. Let c'∈{0,1}L, assuming the number of simplified input features is represented by L, and θ0∈E. The expression is then given by:
$h\left(c^{\prime}\right)=\theta_0+\sum_{u=1}^L \theta_u c_u^{\prime}$ (11)
The model needs to meet the following three standard properties:
$d(a)=h\left(a^{\prime}\right)=\theta_0+\sum_{u=1}^L \theta_u a_u^{\prime}$ (12)
(2) Missingness: If an input feature is ignored in the complex model d, the attribution value of this feature should also be zero in the simple model h. This ensures that the simple model h focuses only on the features that actually contribute to the prediction of the building energy efficiency state, thereby avoiding the interference of irrelevant variables.
$a^{\prime}=0 \rightarrow \theta_u=0$ (13)
(3) Consistency: For any two prediction models d and d', if the contribution of a feature in d is always greater than or equal to the contribution of the corresponding feature in d', then the simple model h should maintain this relationship in the interpretation of these two models. This ensures that the simple model h remains consistent when interpreting different complex models, faithfully reflecting the true decision logic of the complex prediction model d for building energy efficiency states.
For any models d and d′, if:
$d_a^{\prime}\left(z^{\prime}\right)-d_a^{\prime}\left(c^{\prime} \backslash u\right) \geq d_a\left(c^{\prime}\right)-d_a\left(c^{\prime} \backslash u\right)$ (14)
Then for any input c'∈{0,1}L, it satisfies:
$\theta_u\left(d^{\prime}, a\right) \geq \theta_u(d, a)$ (15)
The above standard properties ensure that the decision features of the interpretive model h can accurately describe the true decision behavior of the complex prediction model d. Based on the properties of accuracy, missingness, and consistency, the local accuracy formula has a unique solution, which also ensures the uniqueness and reliability of the simple model h in specific scenarios. Let |c'| represent the number of non-zero entries in c'. The Shapley value in game theory is denoted by θu. Based on the above standard properties, equation 12 has a unique solution, which is:
$\begin{aligned} & \theta_u(d, a) =\sum_{c^{\prime} \subseteq a^{\prime}} \frac{\left|c^{\prime}\right|!\left(L-\left|c^{\prime}\right|-1\right)!}{L!}\left[d_a\left(c^{\prime}\right)-d_a\left(c^{\prime} \backslash u\right)\right]\end{aligned}$ (16)
By processing thermal imaging data and other related energy efficiency data and using the SHAP method to calculate the contribution of each feature to the prediction results of building energy efficiency states, these contribution data can be horizontally stacked and sorted, thereby regrouping the building samples. Samples within each group have similarity in the contribution of the same features to the prediction results of energy efficiency states. This grouping method helps visualize and analyze the classification of building energy efficiency characteristics. Figure 5 shows the output result d(a) of the algorithm interpretation function d.
Figure 5. Output result d(a) of the algorithm interpretation function d
The building energy efficiency states studied in this paper are analyzed through thermal imaging technology, with thermal image data being divided into labeled data of efficient and inefficient categories. By extracting spatiotemporal features from the building thermal imaging using the Gray-level Co-occurrence Matrix, the transformation of image data into a building energy efficiency feature dataset F of V×(L+1) can be achieved. Assuming the number of collected infrared thermal images is represented by V and the number of spatiotemporal features is represented by L, the expression is:
$F={{\left[ \underbrace{\begin{matrix} {{t}_{11}} & \cdots & {{t}_{1o}} \\ \vdots & \ddots & \vdots \\ {{t}_{V1}} & \cdots & {{t}_{Vo}} \\\end{matrix}}_{Spatial\text{ }features}\underbrace{\begin{matrix} {{s}_{11}} & \cdots & {{s}_{1w}} \\ \vdots & \ddots & \vdots \\ {{s}_{V1}} & \cdots & {{s}_{Vw}} \\\end{matrix}}_{Temporal\text{ }features}\underbrace{\begin{matrix} {{m}_{1}} \\ \vdots \\ {{m}_{V}} \\\end{matrix}}_{Initial\text{ }label\text{ }attributes} \right]}_{V\times \left( L+1 \right)}}$ (17)
And o, w, t, s, V need to satisfy:
$\begin{aligned} & w=o \\ & L=o+w \\ & S_{u, k}=t_{u+1, k}-t_{u, k}\end{aligned}$ (18)
For the building energy efficiency feature data F, the TreeSHAP module integrated into the XGBoost algorithm is used to complete the clustering analysis of energy efficiency states. The dataset F is first divided into a training set and a test set in a 4:1 ratio, represented by F_TR and F_TE, respectively. After the classification of F based on the XGBoost model, the building thermal images will obtain classification labels mu, u $\in$ {1,2,…V). For mu, the contribution θu,k of each building energy efficiency feature to the building energy efficiency state label result can be calculated using the following formula:
$m_u=\sum_{k=1}^L \theta_{u, k}$ (19)
After sorting the feature contributions of each frame of thermal imaging based on similarity and visualizing them horizontally stacked, the multiple energy efficiency state stages of the building can be clearly seen. The energy efficiency state Tu, u $\in$ {1,2,…V) corresponding to each frame of thermal imaging is further generated, updating the thermal imaging dataset F with new label attributes for building energy efficiency states.
$F={{\left[ \overbrace{\underbrace{\begin{matrix} {{t}_{11}} & \cdots & {{t}_{1o}} \\ \vdots & \ddots & \vdots \\ {{t}_{V1}} & \cdots & {{t}_{Vo}} \\\end{matrix}}_{Spatial\text{ }features}\underbrace{\begin{matrix} {{s}_{11}} & \cdots & {{s}_{1w}} \\ \vdots & \ddots & \vdots \\ {{s}_{V1}} & \cdots & {{s}_{Vw}} \\\end{matrix}}_{Temporal\text{ }features}}^{A}\overbrace{\underbrace{\begin{matrix} {{T}_{1}} \\ \vdots \\ {{T}_{V}} \\\end{matrix}}_{Updated\text{ }label\text{ }attributes}}^{B} \right]}_{V\times \left( L+1 \right)}}$ (20)
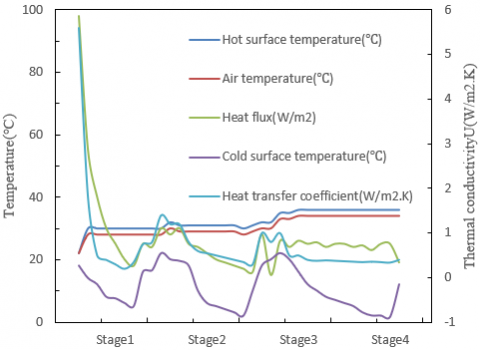
According to the data in Figure 6, the building energy efficiency state experienced four stages of change. In the first stage, the hot surface temperature, air temperature, and cold surface temperature were 22°C, 22°C, and 18°C, respectively, showing a high heat flux (98W/m²) and heat transfer coefficient (5.6W/m²·K), indicating low building energy efficiency. As it enters the second stage, the hot surface temperature and air temperature change slightly, but the cold surface temperature significantly drops to a minimum of 1.5°C, and the heat flux and heat transfer coefficient decrease sharply to 15W/m² and 0.2W/m²·K, respectively, showing a significant improvement in energy efficiency. In the third and fourth stages, although the hot surface temperature and air temperature fluctuate, they tend to stabilize overall. The cold surface temperature and heat transfer coefficient remain at low levels, and the heat flux changes slightly, indicating further optimization of building energy efficiency, stabilizing in the high-efficiency region. Through the analysis of infrared thermal imaging data, it can be clearly seen that building energy efficiency improves continuously as the stages progress. The high heat flux and heat transfer coefficient in the initial stage indicate low energy efficiency, while the subsequent stages show significant temperature and heat flux reduction, especially the significant decrease in cold surface temperature and heat transfer coefficient in the second stage, validating the effectiveness of energy efficiency improvement.
By analyzing the aforementioned building temperature prediction data and combining the proposed selection search algorithm for building infrared thermal images, it is possible to accurately locate areas of thermal anomalies and high heat transfer coefficients on the building surface. This algorithm automatically identifies and focuses on key areas with significant temperature anomaly changes by multidimensional analysis of hot surface temperature, air temperature, cold surface temperature, and heat flux data, thereby improving the accuracy and efficiency of thermal image processing.
Figure 6. Temperature prediction data for buildings based on infrared thermal imaging
Table 1. Average values of building prediction data based on infrared thermal imaging
|
Parameter Value |
Test Point 1 |
Test Point 2 |
Test Point 3 |
Average Value |
|
Heat Transfer Coefficient (W/(m2K)) |
0.421 |
0.36 |
0.38 |
0.387 |
|
Thermal Resistance (m2.K/W) |
2.36 |
2.6 |
2.62 |
2.52 |
According to the data in Table 1, the average heat transfer coefficient of the three test points is 0.387 W/(m²·K), while the average thermal resistance is 2.52 m²·K/W. These data indicate slight differences in heat transfer coefficient and thermal resistance between the test points, but overall they tend to be consistent. Specifically, the heat transfer coefficient of test point 1 is the highest at 0.421 W/(m²·K), while the heat transfer coefficient of test point 2 is the lowest at 0.36 W/(m²·K). Correspondingly, the thermal resistance values of test points 2 and 3 are relatively high, at 2.6 and 2.62 m²·K/W, respectively, while the thermal resistance value of test point 1 is relatively low at 2.36 m²·K/W. These data can be used for preliminary judgment of the thermal performance of different test points and provide a basis for further energy efficiency assessment.
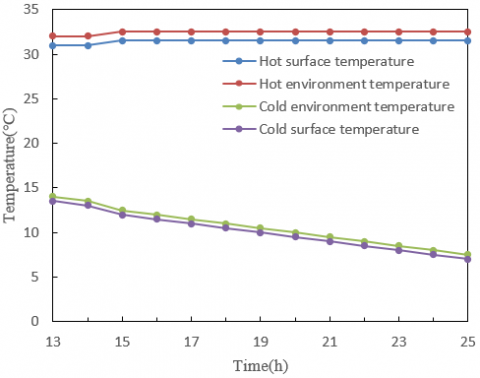
From Figure 7, it can be seen that during the 7:00-9:00 morning period, the hot surface temperature stabilized at 28.5℃, while the hot environment temperature was 29.5℃, showing a small temperature difference. The cold surface temperature and cold environment temperature gradually rose from 7℃ and 7.5℃ to 13℃ and 13.5℃, respectively, showing a stable warming trend. During the 17:00-19:00 evening period, the hot surface temperature was slightly higher than in the morning, maintaining between 31-31.5℃, while the hot environment temperature was 32-32.5℃. The cold surface temperature and cold environment temperature dropped from 13.5℃ and 14℃ to 7℃ and 7.5℃, respectively, showing a significant cooling trend. These data reflect the heat conduction characteristics and environmental temperature change trends of the building at different times, providing detailed temperature prediction information for energy efficiency analysis.
Figure 7. Temperature prediction values for key areas of building energy efficiency analysis
Table 2. Statistical table of building energy efficiency intensity changes over time
|
Time |
Stage 1 |
Stage 2 |
Stage 3 |
Stage 4 |
||||
|
Building Energy Efficiency Intensity |
Increment |
Rate of Change |
Increment |
Rate of Change |
Increment |
Rate of Change |
Increment |
Rate of Change |
|
Ultra-efficient Zone |
-31.68 |
-1.98 |
-31.28 |
-0.97 |
-62.36 |
-1.21 |
-74.26 |
-1.33 |
|
Efficient Zone |
48.52 |
4.68 |
-72.69 |
-2.25 |
-21.65 |
-0.65 |
-32.71 |
-0.59 |
|
Regular Zone |
-82.36 |
-5.07 |
-15.62 |
-0.63 |
-98.67 |
-1.78 |
-74.79 |
-1.24 |
|
Inefficient Zone |
0.74 |
0.05 |
-7.58 |
-0.21 |
-6.89 |
-0.13 |
-5.49 |
-0.44 |
|
Ultra-inefficient Zone |
64.59 |
2.39 |
126.32 |
1.87 |
198.36 |
2.19 |
223.45 |
1.27 |
Based on the obtained temperature data of key areas for building energy efficiency analysis, the heat transfer coefficient and thermal resistance of these areas can be calculated to further determine the intensity of building energy efficiency. Specifically, the heat transfer coefficient can be calculated by measuring the differences between hot surface temperature, hot environment temperature, cold surface temperature, and cold environment temperature, combined with heat flux density; thermal resistance is the reciprocal of the heat transfer coefficient. By comparing and analyzing the heat transfer coefficients and thermal resistance of these key areas at different times, the insulation performance and energy efficiency levels of the building under different conditions can be assessed.
From Table 2, it can be seen that in the initial stage (Stage 1), the building energy efficiency intensity of the ultra-efficient zone and the regular zone significantly decreased, reducing by 31.68 and 82.36, respectively, with rates of change of -1.98 and -5.07, respectively, while the efficient zone and the inefficient zone showed varying degrees of energy efficiency improvement, with increments of 48.52 and 0.74, and rates of change of 4.68 and 0.05, respectively. The energy efficiency intensity of the ultra-inefficient zone also increased, with an increment of 64.59 and a rate of change of 2.39. During the awareness enhancement stage (Stage 2), the energy efficiency intensity of the ultra-efficient zone, regular zone, and inefficient zone continued to decrease, with changes of -31.28, -15.62, and -7.58, and rates of change of -0.97, -0.63, and -0.21, respectively; while the ultra-inefficient zone increased significantly, with an increment of 126.32 and a rate of change of 1.87. In the technology improvement stage (Stage 3), the energy efficiency intensity of the ultra-efficient zone, efficient zone, regular zone, and inefficient zone all decreased, with the ultra-efficient zone decreasing the most significantly, with an increment of -62.36 and a rate of change of -1.21, but the ultra-inefficient zone continued to increase significantly, with an increment of 198.36 and a rate of change of 2.19. In the energy efficiency intensity optimization stage (Stage 4), the energy efficiency intensity of the ultra-efficient zone, efficient zone, regular zone, and inefficient zone continued to decrease, with rates of change of -1.33, -0.59, -1.24, and -0.44, respectively, while the ultra-inefficient zone's energy efficiency intensity significantly increased, with an increment of 223.45 and a rate of change of 1.27. The experimental results show that in each stage, although the energy efficiency intensity of the ultra-efficient zone and regular zone showed significant declines, the efficient zone and inefficient zone showed some improvement in the initial stage, and the ultra-inefficient zone significantly increased in each stage, especially in the technology improvement stage and the energy efficiency intensity optimization stage, with rates of change reaching 2.19 and 1.27, respectively. By analyzing these data, the effectiveness and adaptability of the proposed algorithm in identifying and assessing building energy efficiency are verified, accurately segmenting the stages of energy efficiency state, providing a scientific basis for formulating more precise energy-saving renovation measures, thereby improving the accuracy and efficiency of building energy efficiency analysis.
From Figure 8, it can be observed that the area changes of key regions in building energy efficiency analysis show significant differences over time. In the initial stage (Stage 1), the area of the ultra-efficient zone and the regular zone decreased by 30 and 85, respectively, while the area of the efficient zone and the ultra-inefficient zone increased by 50 and 65, respectively, and the area of the inefficient zone changed little. Entering the awareness enhancement stage (Stage 2), the area of the ultra-efficient zone remained unchanged, the area of the efficient zone and the regular zone decreased by 75 and 15, respectively, the area of the inefficient zone decreased by 5, while the area of the ultra-inefficient zone increased significantly by 125. The technology improvement stage (Stage 3) shows that the area of the ultra-efficient zone and the regular zone continued to decrease significantly, dropping to -70 and -100, respectively, the area of the efficient zone dropped to -25, the area of the inefficient zone decreased by 5, but the area of the ultra-inefficient zone increased significantly to 195. Finally, in the energy efficiency intensity optimization stage (Stage 4), the area of the ultra-efficient zone, efficient zone, regular zone, and inefficient zone decreased to -80, -50, -125, and -15, respectively, while the area of the ultra-inefficient zone continued to increase to 205.
Figure 8. Area changes of key regions in building energy efficiency analysis over time
The experimental results show that the proposed selection search algorithm and the SHAP attribution clustering algorithm perform significantly in processing building infrared thermal images and evaluating building energy efficiency states. Through detailed analysis of the energy efficiency states at each stage, the results show that the area of the ultra-efficient zone and the regular zone gradually decreases at each stage, especially in the technology improvement stage and the energy efficiency intensity optimization stage, with the largest reductions; while the area of the ultra-inefficient zone significantly increases at each stage, especially in the technology improvement stage and the energy efficiency intensity optimization stage, with increases of 195 and 205, respectively. The area changes of the efficient zone and the inefficient zone are relatively volatile, indicating that the effectiveness of energy efficiency improvement measures is not balanced in different stages. These data prove that the proposed method can accurately identify and evaluate the energy efficiency state changes in different areas of the building, with high accuracy and adaptability, providing a scientific basis for optimizing building energy efficiency, effectively improving the accuracy and efficiency of building energy efficiency analysis.
The research content of this paper mainly revolves around two core parts. First, a selection search algorithm for building infrared thermal images is proposed to improve the accuracy and efficiency of thermal image processing. By optimizing the search strategy, the algorithm makes the processing of infrared thermal images faster and more accurate, thus laying the foundation for subsequent building energy efficiency assessment. Second, a method for segmenting building energy efficiency states based on the SHAP attribution clustering algorithm is proposed. This method uses SHAP values to explain the prediction results of machine learning models and then performs detailed stage segmentation of building energy efficiency states. This method not only improves the comprehensiveness and accuracy of energy efficiency state assessment but also effectively identifies and distinguishes the energy efficiency changes at different stages.
Experimental results show that the temperature prediction data and average values based on infrared thermal imaging demonstrate the high accuracy and consistency of the proposed algorithm in temperature prediction. The temperature prediction values of key areas in building energy efficiency analysis and their statistical changes over time further verify the effectiveness and stability of the algorithm. Especially the analysis of the area changes of different key areas in energy efficiency analysis over time shows the trend of the area of the ultra-efficient zone and the regular zone gradually decreasing at each stage, while the area of the ultra-inefficient zone significantly increases. These results prove the efficiency and accuracy of the proposed method in identifying and evaluating the energy efficiency state changes in different areas of the building.
By proposing an innovative selection search algorithm and the SHAP attribution clustering algorithm, this paper significantly improves the accuracy and efficiency of building infrared thermal image processing and provides a comprehensive and accurate method for segmenting building energy efficiency states. These research results not only provide a more scientific basis for building energy efficiency assessment but also help optimize energy efficiency management strategies in practical applications, improving energy utilization efficiency, and having important application value.
However, there are some limitations in this study. For example, the performance of the selection search algorithm and the SHAP attribution clustering algorithm may vary under different types of buildings and environmental conditions, requiring further verification and optimization. In addition, the research in this paper is mainly based on simulated data and experimental environments, and the complexity and diversity in practical applications require more field tests and data support. Future research directions can focus on the following aspects: first, further optimizing the selection search algorithm and the SHAP attribution clustering algorithm to maintain high efficiency and accuracy under different environments and building types; second, expanding the data collection scope, increasing tests and verifications in practical applications to enhance the generalization ability of the algorithm; finally, combining other advanced technologies, such as the Internet of Things and big data analysis, to build a more intelligent and comprehensive building energy efficiency management system, achieving the automation and intelligence of energy efficiency assessment and management.
[1] Yoo, Y.S., Shin, H., Kim, D. W., Park, C.S. (2024). Performance gap analysis for Korean building energy efficiency certification. Energy and Buildings, 314: 114294. https://doi.org/10.1016/j.enbuild.2024.114294
[2] Lachheb, M., Younsi, Z., Youssef, N., Bouadila, S. (2024). Enhancing building energy efficiency and thermal performance with PCM-Integrated brick walls: A comprehensive review. Building and Environment, 111476. https://doi.org/10.1016/j.buildenv.2024.111476
[3] Sun, J., Xu, J., Zhou, S.J., Pang, Y., Zhang, W.Y., Zhou, J., Liu, Y., Guo, H.W., Jiang, F. (2024). Enhancing building energy efficiency: leaf transpiration inspired construction of lignin-based wood plastic composites for building energy conservation. Applied Energy, 367: 123448. https://doi.org/10.1016/j.apenergy.2024.123448
[4] Liao, X., Zhang, Y., Zheng, X., Kang, J., Zhao, H., Wang, N. (2024). Building energy efficiency assessment base on predict-center criterion under diversified conditions. Energy and Buildings, 311: 114118. https://doi.org/10.1016/j.enbuild.2024.114118
[5] Tomrukcu, G., Ashrafian, T. (2024). Climate-resilient building energy efficiency retrofit: Evaluating climate change impacts on residential buildings. Energy and Buildings, 114315. https://doi.org/10.1016/j.enbuild.2024.114315
[6] Świrska-Perkowska, J., Wicher, A., Pochwała, S., Anweiler, S., Böhm, M. (2022). Doweled cross Laminated Timber (DCLT) building air tightness and energy efficiency measurements: Case study in Poland. Energies, 15(23): 9029. https://doi.org/10.3390/en15239029
[7] Wang, Y., Wang, Y., Duan, W., Zheng, Y., Duan, P. (2023). Joint measurement of thermal discomfort by occupant pose, motion and appearance in indoor surveillance videos for building energy saving. Journal of Circuits, Systems and Computers, 33(3): 2450051. https://doi.org/10.1142/S0218126624500518
[8] Kłosowski, G., Hoła, A., Rymarczyk, T., Mazurek, M., Niderla, K., Rzemieniak, M. (2023). Using machine learning in electrical tomography for building energy efficiency through moisture detection. Energies, 16(4): 1818. https://doi.org/10.3390/en16041818
[9] Abdel-Fattah, A., Hamdan, S., Ayadi, O., Al-Khuraissat, M. (2022). Energy efficiency and thermal insulation code violations for residential buildings in Jordan and the role of social advocacy campaigns. Energy for Sustainable Development, 71: 419-432. https://doi.org/10.1016/j.esd.2022.10.013
[10] Yang, S., Wi, S., Lee, J., Lee, H., Kim, S. (2019). Biochar-red clay composites for energy efficiency as eco-friendly building materials: Thermal and mechanical performance. Journal of Hazardous Materials, 373: 844-855. https://doi.org/10.1016/j.jhazmat.2019.03.079
[11] Da Silva, A., Frostevarg, J., Kaplan, A. F. (2023). Melt pool monitoring and process optimisation of directed energy deposition via coaxial thermal imaging. Journal of Manufacturing Processes, 107: 126-133. https://doi.org/10.1016/j.jmapro.2023.10.021
[12] Hou, Z., Lyu, J., Wu, D., Chen, J., Shi, J., Lian, Z. (2024). Occupant-centric cabin thermal sensation assessment system based on low-cost thermal imaging. Building and Environment, 111692. https://doi.org/10.1016/j.buildenv.2024.111692
[13] Ostańska, A. (2018). Thermal imaging for detection of defects in envelopes of buildings in use: Qualitative and quantitative analysis of building energy performance. Periodica Polytechnica Civil Engineering, 62(4): 939-946. https://doi.org/10.3311/PPci.12148
[14] Cheng, J., Liu, Y., Kang, M., Niu, S., Wang, Y., Guan, Y., Zhang, F. (2022). The thermal energy storage capacity and fire risk of phase change material based on the framework of modified melamine sponge. Polymers for Advanced Technologies, 33(10): 3279-3285. https://doi.org/10.1002/pat.5779
[15] Song, W., Liu, R., Li, H. (2023). The modification of building wall temperature measurement based on infrared thermal image of machine vision. In 2023 5th International Conference on Applied Machine Learning (ICAML), Dalian, China, pp. 415-419. https://doi.org/10.1109/ICAML60083.2023.00084
[16] Rathore, P.K.S., Shukla, S.K. (2020). An experimental evaluation of thermal behavior of the building envelope using macroencapsulated PCM for energy savings. Renewable Energy, 149: 1300-1313. https://doi.org/10.1016/j.renene.2019.10.130
[17] Biswanath, M.K., Hoegner, L., Stilla, U. (2023). Thermal mapping from point clouds to 3D building model facades. Remote Sensing, 15(19): 4830. https://doi.org/10.3390/rs15194830
[18] Zhang, D., Zhan, C., Chen, L., Wang, Y., Li, G. (2024). An in-situ detection method for assessing the thermal transmittance of building exterior walls using unmanned aerial vehicle–infrared thermography (UAV-IRT). Journal of Building Engineering, 91: 109724. https://doi.org/10.1016/j.jobe.2024.109724
[19] Yousefi, A., Tang, W., Khavarian, M., Fang, C. (2022). Effects of thermal conductive fillers on energy storage performance of Form-Stable phase change material integrated in Cement-Based composites. Applied Thermal Engineering, 212: 118570. https://doi.org/10.1016/j.applthermaleng.2022.118570
[20] Cai, W., Wen, X., Wang, S., Wang, L. (2019). A real-time detection method of building energy efficiency based on image processing. Journal of Visual Communication and Image Representation, 60: 295-304. https://doi.org/10.1016/j.jvcir.2019.02.032
[21] Gupta, M.K., Rathore, P.K.S., Singh, A.K. (2022). Experimental investigation of clay brick with sensible, latent, and hybrid thermal energy storage in buildings. Materials Today: Proceedings, 69: 112-118. https://doi.org/10.1016/j.matpr.2022.08.193
[22] Kim, D.J., Kim, S.I., Kim, H.S. (2022). Thermal simulation trained deep neural networks for fast and accurate prediction of thermal distribution and heat losses of building structures. Applied Thermal Engineering, 202: 117908. https://doi.org/10.1016/j.applthermaleng.2021.117908