Jinglin Han*![]() | Xichun Feng
| Xichun Feng![]() | Hui Zhao
| Hui Zhao![]() | Zhiyong Chen
| Zhiyong Chen![]() | Ping Hu
| Ping Hu![]()
© 2024 The authors. This article is published by IIETA and is licensed under the CC BY 4.0 license (http://creativecommons.org/licenses/by/4.0/).
OPEN ACCESS
This study introduces an innovative signal processing approach employing a multi-granularity aggregation method grounded in graph representation learning, addressing the need for comprehensive attribute analysis in real-time modeling of digital twin power grids. Traditional algorithms often focus narrowly on isolated node information, inadequately capturing the holistic characteristics of information networks. By integrating signal processing techniques, this method enhances the incorporation of node interdependencies, accounting for both spatial distances and business attributes within the network topology. This technique seamlessly merges topological and business data across various informational layers, enabling multi-granularity clustering and mapping at the unit, system, and complex system levels within digital twin grids. The proposed approach significantly advances the application of signal processing in the dynamic analysis and decision-making processes essential for optimizing digital twin grid operations.
digital twin, signal processing, multi-granularity, graph representation learning
The power network, a fundamental infrastructure of modern society, describes the intricate nodal relationships among various transmission devices, acting as a crucial carrier of multifaceted information [1-3]. This network's operation hinges on precise analysis and decision-making based on data from these interconnected systems [4]. Signal processing plays a pivotal role in this context by enabling the extraction and refinement of information from these complex data streams, thus facilitating a more robust and dynamic understanding of network behaviors and interactions [5].
Digital twins, as a digital representation of physical assets, systems, or processes, have emerged as a groundbreaking technology in the optimization and management of power grids [6, 7]. By creating a dynamic digital counterpart of the physical power grid, digital twins allow for real-time monitoring, simulation, and analysis of grid operations [8]. This capability is crucial for identifying potential issues, optimizing grid performance, and supporting decision-making processes. The integration of digital twins in power grids enhances the ability to predict and mitigate problems before they occur, thereby improving the reliability and efficiency of power distribution.
Signal processing, on the other hand, is essential for handling the vast amounts of data generated by power grids [9]. It involves techniques that process and analyze signals to extract useful information, detect anomalies, and enhance the quality of data. In the context of power grids, signal processing can be used to monitor the condition of grid components, detect faults, and optimize the flow of electricity. The combination of signal processing and digital twins provides a powerful toolset for managing the complexity of modern power grids, enabling more precise and adaptive control mechanisms.
Recently, numerous deep learning techniques have emerged to facilitate clustering based on topology, attributes, behaviors, and other aspects [10-12]. Algorithms like DeepWalk [13], Node2Vec [14], and LINE [15] have established themselves as classical methods in complex network representation learning, effectively addressing the challenge of preserving local topology. Such as SDNE [16] and GCN [17], these studies achieve clustering by mapping individual nodes to different levels of granularity, i.e., by considering the topology of nodes, as in MNRL [18], by considering the topology between nodes and the properties of neighboring nodes. However, the current research only focuses on training out the corresponding models without the corresponding granularity to simulate the twins by computer and feed them to the real world for construction.
With the application of new generation technologies such as industrial Internet of Things and digital twins, it is necessary to achieve interaction between physical space and information space [19-23]. Fuller et al. [24] proposed the innovative concept of digital twin workshops to establish a five-dimensional model of digital twin to realize the interaction and integration of the physical world and the information world to finally realize intelligent manufacturing. Qi et al. [25] integrated digital twin technology with planning and scheduling techniques to create a digital twin-based planning and scheduling system. This system is designed to coordinate and plan workshop production activities, managing and controlling uncertainties from multiple perspectives and in comprehensive ways. Kipf and Welling [26] proposes an ultra-short prediction of PV power based on a digital twin simulation of PV cells and the surrounding environment, comparing the actual power with the predicted power, and then correcting the predicted value to achieve the final prediction result.
This paper proposes a multi-granularity modeling approach for digital twins, focusing on the signal processing techniques that enable the analysis of relationships and interactions within power grids. By leveraging advanced signal processing in graph representation learning, this approach aims to map complex network data into a structured digital twin framework. This enables the dynamic simulation of grid behaviors and interactions at multiple granularities, thereby enhancing the predictability and management of power networks. This methodology underscores the inseparability of physical properties, operational functions, and topological data in creating a responsive and adaptive digital twin system.
The intricate relationships between entities within a grid—encompassing operational functions, topological positions, and physical attributes—are fundamentally interconnected [27-29]. Isolating these elements during analysis could obscure critical information, potentially impacting overall grid performance. For instance, a seemingly sparse grid network, as depicted in Figure 1, might suggest a lack of connections between distantly located devices such as nodes P1 and P7. However, a deeper signal processing-based analysis reveals that all inter-node information must be considered to ascertain connectivity. Even if nodes like P4 and P5 share no direct operational or topological link, their association via attribute L2 suggests latent connections. Thus, the fusion of attributes, operations, and topology is crucial for transmitting refined digital information to the digital twin, which then maps nodes across various levels using enhanced low-dimensional representation vectors derived from signal processing techniques.
Figure 1. Physical grid case
The framework for multi-granularity aggregation in digital twin grids is detailed in Figure 2. This framework integrates physical devices, digital twins, and application services to realize a comprehensive multi-granularity process. This integration facilitates real-time interactions, a closed-loop feedback mechanism, and lifecycle maintenance of network devices. Signal processing is central to this framework, enabling the precise collection and transformation of data across different layers of grid complexity—from individual unit operations to system-wide interactions.
Figure 2. Digital twin-based multi-granularity aggregation grid framework
In the physical layer, sensors play a pivotal role by gathering and processing data related to energy consumption, structural modifications, operational changes, and business dynamics under the governing principles of power distribution. This data is instantaneously relayed to the digital twin layer, ensuring that each piece of information influences the digital counterpart accurately. The digital twin constructs dynamic models that reflect changes across various granular levels—unit, system, and complex system—by leveraging historical data stored in databases. These models, enriched through advanced signal processing algorithms, facilitate detailed granularity mapping and are essential for the subsequent application service layer, which utilizes graph representation learning to further refine and implement these mappings.
Ultimately, the integration of the digital twin framework with real-time data processing and advanced signal processing techniques enables a comprehensive feedback loop to the physical grid. This ensures that the digital twin not only represents but actively enhances the grid's operational efficiency. The digital twin's ability to predict, categorize, and display information across multiple granularities minimizes the need for manual intervention, reduces personnel costs, and decreases operational expenditures, thereby optimizing the overall management and reliability of the distribution network. This chapter demonstrates how signal processing is integral to transforming raw data into actionable insights within the digital twin framework, ensuring that every level of the grid benefits from enhanced predictive and analytical capabilities.
We utilize a detailed multi-granularity network representation learning (MNRL) approach that thoroughly refines the distribution network from its fundamental topology to the execution services, characteristics, and additional information associated with each node. This method not only preserves the original topology of single-device granularity but also integrates a wide range of additional node-specific data. This enrichment significantly enhances the complexity and interconnectedness of the distribution network's relational framework. By doing so, it thoroughly addresses and integrates the attributes, operational functionalities, and topological structures of single-grain devices.
Figure 3. Multi-granularity graph representation learning
The extensive integration and mapping processes facilitated by the MNRL method are illustrated in Figure 3, highlighting how diverse data layers contribute to a comprehensive and nuanced network representation. This approach ensures a deeper understanding and more robust analysis of the network, enhancing both the precision and utility of the digital twin model.
3.1 Formal definition of grid topology
The distribution network is depicted as a complex network system $G~=~\left( V,~E,~A \right),$ where $V$ represents the set of n nodes at single-device granularity, $E$ is the set of edges between these nodes, and A is the set of attributes for each device. Here, A∈RN×M$~$represents the matrix encoding the attributes of all single-device nodes, including services, features, and other information. Each attribute ${{a}_{i}}\in A$ pertains to ${{v}_{i}}$. The element ${{e}_{ij}}=\left( {{v}_{i}},{{v}_{j}} \right)$ indicates the line and network connection between the single device nodes ${{v}_{i}}$ and ${{v}_{j}}$.
In a given complex distribution network $G~=~\left( V,~E,~A \right)$, we map ${{v}_{i}}$ and ${{a}_{i}}$ to a low-dimensional vector ${{y}_{i}}$ by a learning function $f$: $V_{r}^{d}$, where $d$ denotes the dimensionality of the matrix $R$ and $d<<~\left| V \right|$, and the ${{y}_{i}}$ obtained by learning includes not only the distribution network structure map but also other information of the nodes. The low-latitude vectors obtained by network representation learning remain highly consistent with the original network high-dimensional information. For example, ${{v}_{i}}$ and ${{v}_{j}}$are transformed from high-dimensional vectors to low-dimensional ones by the network representation learning function $f$, where ${{v}_{i}}$ and ${{v}_{j}}$are similar.
In a complex distribution network, a single device corresponds to a single node, i.e., a single granularity (essential granularity), and the structure is not subdividable. The physical world can combine unit devices (unit layer) far and near into a system (system layer) by Euclidean distance. Finally, the individual systems are combined into a complex system (complex system layer). Multi-granularity representation learning aggregates the complex distribution network with a complete representation using low-dimensional information by learning different unit devices at the unit-level properties, system-level associations, and the global structure.
3.2 Representation of learning methods
In order to better represent the complex grid system with multiple granularities and to address the inability to analyze individual device node attributes, we use the information collected by single device granularity sensors by integrating the solution components of each layer in order to form the optimal solution for the whole problem [30], so we use a multi-granularity information fusion method, as in Eq. (1): $N\left( {{v}_{i}} \right)$ denotes the grid node ${{v}_{i}}$ adjacent contacts. The ai denotes the vi attributes of the node. $d\left( {{v}_{i}} \right)$ represents the information of the neighboring nodes along with their own attribute information.
$H\left( {{v}_{i}} \right)={{a}_{i}}+\sum\limits_{{{v}_{j}}\in N\left( {{v}_{i}} \right)}^{{}}{\frac{d\left( {{v}_{j}} \right)}{d\left( {{v}_{i}} \right)}}{{a}_{j}}$ (1)
${{x}_{i}}=H\left( {{v}_{i}} \right)$ (2)
To capture the complementary properties of different granularity hierarchies, as well as the effects of noise, we use the model Autoencoder, which is a powerful unsupervised model. In a complex grid structure with multiple granularities, the autoencoder fuses different information from single device granularity to coarse granularity, which includes execution operations, features, and various additional information. Eq. (2) defines that the autoencoder contains three layers: the input layer, the hidden layer, and the output layer, as shown in Figure 4.
The activation function is denoted by $\sigma \left( \cdot \right)$. ${{\omega }_{k}}$ and ${{b}_{k}}$ represent the transform matrixes of the k-th layer, respectively. k denotes the number of layers of the encoder and decoder.
$y_{i}^{1}=\sigma \left( {{\omega }^{\left( 1 \right)}}{{x}_{i}}+{{b}^{\left( 1 \right)}} \right)$ (3)
$y_i^k=\sigma\left(\omega^{(k)} y_i^{k-1}+b^{(k)}\right) \quad k=2, \ldots, K-2$ (4)
${{y}_{u}}={{\omega }^{\left( K-1 \right)}}y_{i}^{k}+{{b}^{\left( K-1 \right)}},{{y}_{\sigma }}={{\omega }^{\left( K-1 \right)}}y_{i}^{k}+{{b}^{\left( K-1 \right)}}$ (5)
$y_{i}^{K}=\sigma \left( {{y}_{u}}+E*{{y}_{\sigma }} \right)$ (6)
The uniform vector representation obtained by model learning, denoted by $y_{1}^{k}$ and obeying the function $E$, $E~\sim~\left( 0,~1 \right)~$is a standard normal distribution. To make the model trained by the multi-granularity learning method fit the type of distribution of the collected data, the following loss function needs to be minimized, with the loss function being:
${{L}_{KL}}=y_{u}^{2}+y_{\sigma }^{2}-\log \left( y_{\sigma }^{2} \right)-1$ (7)
In order to reduce the loss of potential information, our goal is to minimize the automatic decoder loss function by comparing the decoder output ${{X}_{i}}$ with a priori knowledge ${{X}_{i}}$ and calculating the error between the two, as follows:
${{L}_{RE}}=\sum\limits_{i}^{n}{\left\| {{X}_{i}}-{{x}_{i}} \right\|}_{2}^{2}$ (8)
To portray the data from network devices at the same structural tier, we employ the skip-gram model, which is also suggested in research on heterogeneous networks and is suitable for various types of node devices. During our treatment, the node's context regarding the device node performs services, features, and various additional information. In (9), we define the loss function to specify the random wandering $c~\in ~C$, where vi is the node information and yi is the reconfiguration information obtained by vi through representation learning.
${{L}_{HS}}=\arg \max \sum\limits_{i=1}^{n}{\sum\limits_{c\in C}^{{}}{\sum\limits_{j\le \left| B \right|,j\ne 0}^{{}}{\log p\left( {{v}_{i+j}}\left| {{y}_{i}} \right. \right)}}}$ (9)
where, $p({{v}_{i+j}}|{{y}_{i}})~$is described using a Softmax function, and B represents the size of the generation window.
$p\left( {{v}_{i+j}}\left| {{y}_{i}} \right. \right)=\frac{{{e}^{{{v}^{'}}}}_{i+j}^{T}{{y}_{i}}}{\sum\limits_{k=1}^{n}{{{e}^{{{v}^{'}}}}_{k}^{T}{{y}_{i}}}}$ (10)
Multi-granularity network representation learning is fused by multi-granularity information, and the decoder learns single-device granularity information to carry out the transformation of different high level information into uniform low-dimensional information, and then comes to realize the mapping of different granularity, which solves the problem that under multi-granularity, even though there is no close distance in physical space between single-device entities, there is business communication that cannot be fused. The multi-granularity network representation optimizes the objective function, ensuring the validity of the computational outcomes.
Figure 4. Autoencoder
$L=\alpha {{L}_{RE}}+\beta {{L}_{KL}}+\gamma \left( -{{L}_{HS}} \right)$ (11)
The complete objective function is as follows:
$\begin{align} & L=\alpha \left( \sum\limits_{i}^{n}{\left\| {{{\hat{x}}}_{i}}-{{x}_{i}} \right\|}_{2}^{2} \right)+\beta \left( y_{u}^{2}+y_{\sigma }^{2}-\log \left( y_{\sigma }^{2} \right)-1 \right) +\gamma \left( \sum\limits_{i=1}^{n}{\sum\limits_{c\in C}^{{}}{\sum\limits_{j\le \left| B \right|,j\ne 0}^{{}}{\log p\left( {{v}_{i+j}}\left| {{y}_{i}} \right. \right)}}} \right) \end{align}$ (12)
The multi-granularity learning model is a method that can preserve multiple levels of granularity information, including unit-level attributes of device nodes, system-level associations, and global structure. The method can effectively address the complementarity between different granularities as well as the highly nonlinearization, while preserving various information, such as business and attributes of device nodes, and finally forming the objective function $L$. Through the gradient granularity descent method, the iteration of the objective function is performed until the function converges. Taken together, this network expression learning is able to interact in real time, accurately and efficiently utilize the collected information for model training and achieve the goal of mapping at different granularities.
4.1 Introduction of dataset
Table 1. Dataset
|
Dataset |
Equipment |
Business Instructions |
Properties |
|
City1 |
3315 |
4770 |
3904 |
|
City2 |
19817 |
44238 |
5000 |
|
City3 |
2808 |
5258 |
1443 |
In the experiments, the data utilized in this paper are sourced from real-time data on a provincial grid data platform, covering a number of cities. These data include device relationships, various attribute information, and business instruction information for the devices. This data set helps demonstrate a significant inseparability and dependency among device node cluster relationships, individual device relationships, attributes, and businesses, which collectively influence the relationships within a single association of devices. To verify the effectiveness of our proposed multi-granularity modeling approach, we conducted experiments on datasets from different cities, including City1, City2, and City3. We compared our method with four baseline methods: DeepWalk, Node2Vec, LINE, and SDNE.
4.2 Device node classification
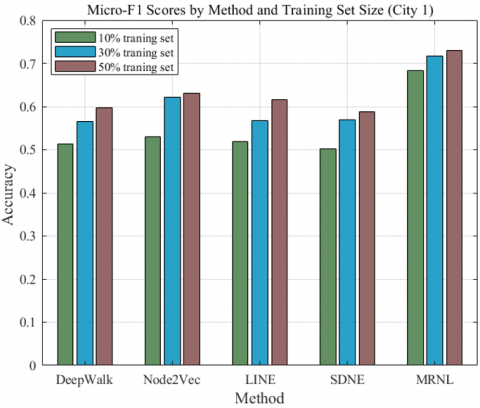
In order to demonstrate the performance of our proposed multi-granularity modeling approach, we implement subgroups of nodes to be modeled and achieve multi-granularity presentation of nodes. Specifically, we combine device nodes according to their connections, business attributes, from single device components into system components, and finally system components into complex systems, where we use SVM as the combined classifier. For the comprehensive evaluation of the model, we randomly sampled the dataset and selected 10%, 30%, and 50% of the single device nodes as the training set, and the remaining dataset as the test set. To verify the correctness of the binning, we used Macro-F1 (Ma-F1) and Micro-F1 (Mi-F1) as validation metrics.
Figure 5. Accuracy of Micro-F1 and Macro-F1 on City 1 data set
In City 1, as shown in Table 2 and Figure 5, the MRNL method demonstrated superior performance across all training set sizes compared to other methods (DeepWalk, Node2Vec, LINE, SDNE). Notably, as the size of the training set increased from 10% to 50%, MRNL showed consistent improvements in both Micro-F1 (Mi-F1) and Macro-F1 (Ma-F1) scores, starting from 0.6830 and 0.6364 at 10% to 0.7302 and 0.6905 at 50%. This trend suggests that MRNL is highly effective in handling varying granularities of data, significantly outperforming the baseline methods, which also showed gradual improvements as the training data increased.
Table 2. Results of subgroups in City 1
|
Method |
10% Training Set |
30% Training Set |
50% Training Set |
|||
|
Mi-F1 |
Ma-F1 |
Mi-F1 |
Ma-F1 |
Mi-F1 |
Ma-F1 |
|
|
DeepWalk |
0.5137 |
0.4712 |
0.5658 |
0.5312 |
0.5965 |
0.5414 |
|
Node2Vec |
0.5305 |
0.4624 |
0.6211 |
0.5745 |
0.6315 |
0.5929 |
|
LINE |
0.5178 |
0.4826 |
0.5678 |
0.5263 |
0.6163 |
0.5732 |
|
SDNE |
0.5013 |
0.4896 |
0.5691 |
0.5286 |
0.5876 |
0.5447 |
|
MRNL |
0.6830 |
0.6364 |
0.7176 |
0.6456 |
0.7302 |
0.6905 |
Table 3. Results of subgroups in City 2
|
Method |
10% Training Set |
30% Training Set |
50% Training Set |
|||
|
Mi-F1 |
Ma-F1 |
Mi-F1 |
Ma-F1 |
Mi-F1 |
Ma-F1 |
|
|
DeepWalk |
0.7523 |
0.7389 |
0.7989 |
0.7888 |
0.8200 |
0.8055 |
|
Node2Vec |
0.7458 |
0.7300 |
0.8145 |
0.8107 |
0.8275 |
0.8100 |
|
LINE |
0.7248 |
0.7044 |
0.8112 |
0.8149 |
0.8455 |
0.8135 |
|
SDNE |
0.7772 |
0.7709 |
0.8035 |
0.7955 |
0.8365 |
0.8255 |
|
MRNL |
0.8012 |
0.7749 |
0.8178 |
0.7999 |
0.8498 |
0.8215 |
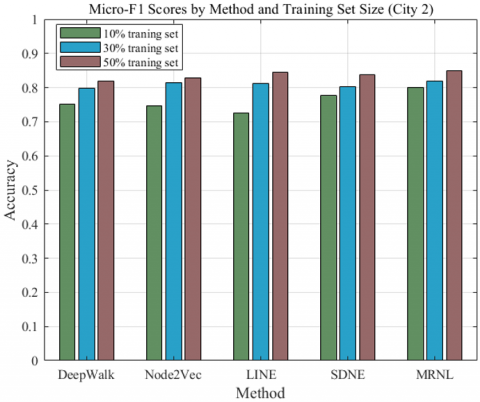
Figure 6. Accuracy of Micro-F1 and Macro-F1 on City 2 data set
In City 2, as shown in Table 3 and Figure 6, similar trends were observed, with MRNL again outperforming other methods. MRNL's performance peaked at a 50% training set size, with Mi-F1 and Ma-F1 scores of 0.8498 and 0.8215, respectively. Other methods, like LINE and Node2Vec, also showed strong improvements with increased training data. For instance, LINE jumped from a Mi-F1 of 0.7248 at 10% to 0.8455 at 50%, demonstrating its effectiveness in more extensive training scenarios.
As shown in Table 4 and Figure 7, City 3 displayed the highest performance metrics across all methods, particularly for MRNL and SDNE. MRNL showcased the highest scores, achieving Mi-F1 and Ma-F1 of 0.8687 and 0.8607, respectively, at a 50% training set. SDNE also displayed a remarkable performance, especially at 50% training, where it reached Mi-F1 and Ma-F1 scores of 0.8645 and 0.8635. This indicates that both MRNL and SDNE are particularly robust in environments with rich and complex data in City 3.
Table 4. Results of subgroups in City 3
|
Method |
10% Training Set |
30% Training Set |
50% Training Set |
|||
|
Mi-F1 |
Ma-F1 |
Mi-F1 |
Ma-F1 |
Mi-F1 |
Ma-F1 |
|
|
DeepWalk |
0.7523 |
0.7389 |
0.7989 |
0.7888 |
0.8200 |
0.8055 |
|
Node2Vec |
0.7458 |
0.7300 |
0.8145 |
0.8107 |
0.8275 |
0.8100 |
|
LINE |
0.7248 |
0.7044 |
0.8112 |
0.8149 |
0.8455 |
0.8135 |
|
SDNE |
0.7772 |
0.7709 |
0.8035 |
0.7955 |
0.8365 |
0.8255 |
|
MRNL |
0.8012 |
0.7749 |
0.8178 |
0.7999 |
0.8498 |
0.8215 |
Figure 7. Accuracy of Micro-F1 and Macro-F1 on City 3 data set
4.3 Grid link forecast
In this section, we use link prediction to represent the ability of the model to reconfigure the grid, with the aim of predicting whether there is an association between two nodes, which is a typical network analysis task. To evaluate our model, we randomly keep 80% of the existing links as positive examples and randomly select the same number of non-existent links. Finally, we use an autoencoder for training. Specifically, we rank the positive and negative examples according to the cosine similarity function. To determine the quality of the ranking, we use accuracy to evaluate the ranked list, with higher values indicating better performance. We validated this on the City 1, City 2, and City 3 datasets, and the results are shown in Figure 8.
Figure 8. Prediction accuracy on City 1, City 2 and City 3 datasets
The experimental results demonstrate the significant potential of the multi-granularity modeling approach in optimizing power grid operations, predictions, and decision-making processes. By leveraging advanced signal processing techniques and graph representation learning, our method effectively integrates and analyzes the attributes and operational data of device nodes across different levels of granularity. This comprehensive integration allows for more accurate and dynamic simulations of grid behaviors and interactions, which are crucial for the real-time management and optimization of power grids.
Firstly, the multi-granularity modeling approach enhances the predictability of grid operations by capturing intricate relationships and dependencies among nodes. This improved accuracy enables more precise forecasting of potential issues and more effective maintenance planning, ensuring the reliability and stability of power grid operations. Secondly, our approach supports more informed decision-making by providing a detailed understanding of the grid's operational status at various granularity levels. By mapping complex network data into a structured digital twin framework, stakeholders can gain insights into both local and system-wide interactions, facilitating better resource allocation and operational adjustments.
Future research can investigate the scalability of our approach in larger and more complex grid systems, integrating additional data sources such as weather conditions and energy market trends to enhance predictive power. Developing real-time processing capabilities and adaptive algorithms will be crucial for dynamic grid management. Enhancing analytical and visualization tools can provide more intuitive insights, and leveraging IoT devices and edge computing can improve data collection and processing efficiency. Lastly, exploring the application of our approach in other domains, such as transportation networks and smart cities, could reveal new opportunities for optimizing complex systems. These future research directions highlight the potential for significant contributions to various real-world applications.
This paper was supported by Science and Technology Project of Hebei Electric Power Company "Research on Key Technologies for Planning of Digital Active Distribution Network in Xiong'an New Area” (Grant No.: SGHEJY00GHJS2000103).
[1] Fang, X., Misra, S., Xue, G., Yang, D. (2011). Smart grid—The new and improved power grid: A survey. IEEE Communications Surveys & Tutorials, 14(4): 944-980. https://doi.org/10.1109/SURV.2011.101911.00087
[2] Vardakas, J.S., Zorba, N., Verikoukis, C.V. (2014). A survey on demand response programs in smart grids: Pricing methods and optimization algorithms. IEEE Communications Surveys & Tutorials, 17(1): 152-178. https://doi.org/10.1109/COMST.2014.2341586
[3] Yu, X., Xue, Y. (2016). Smart grids: A cyber–physical systems perspective. Proceedings of the IEEE, 104(5): 1058-1070. https://doi.org/10.1109/JPROC.2015.2503119
[4] Jiang, H., Zhang, J.J., Gao, W., Wu, Z. (2014). Fault detection, identification, and location in smart grid based on data-driven computational methods. IEEE Transactions on Smart Grid, 5(6): 2947-2956. https://doi.org/10.1109/TSG.2014.2330624
[5] Hasnat, M.A., Rahnamay-Naeini, M. (2022). A graph signal processing framework for detecting and locating cyber and physical stresses in smart grids. IEEE Transactions on Smart Grid, 13(5): 3688-3699. https://doi.org/10.1109/TSG.2022.3177154
[6] Tao, F., Zhang, H., Liu, A., Nee, A.Y. (2018). Digital twin in industry: State-of-the-art. IEEE Transactions on Industrial Informatics, 15(4): 2405-2415. https://doi.org/10.1109/TII.2018.2873186
[7] Feng, X.C., Han, J.L., Liu, Y., Hou, R.S., Li, T.L. (2024). Dual-scale dataset-based intelligent recognition of power equipment for enhanced digital grid planning. Traitement du Signal, 41(2): 919-927. https://doi.org/10.18280/ts.410232
[8] Zhang, Y., Wang, J., Chen, B. (2020). Detecting false data injection attacks in smart grids: A semi-supervised deep learning approach. IEEE Transactions on Smart Grid, 12(1): 623-634. https://doi.org/10.1109/TSG.2020.3010510
[9] Atalay, M., Angin, P. (2020). A digital twins approach to smart grid security testing and standardization. In 2020 IEEE International Workshop on Metrology for Industry 4.0 & IoT, Roma, Italy, pp. 435-440. https://doi.org/10.1109/MetroInd4.0IoT48571.2020.9138264
[10] He, K., Zhang, X., Ren, S., Sun, J. (2016). Deep residual learning for image recognition. In Proceedings of the IEEE Conference on Computer Vision and Pattern Recognition, Las Vegas, NV, USA, pp. 770-778.
[11] Badrinarayanan, V., Kendall, A., Cipolla, R. (2017). Segnet: A deep convolutional encoder-decoder architecture for image segmentation. IEEE Transactions on Pattern Analysis and Machine Intelligence, 39(12): 2481-2495. https://doi.org/10.1109/TPAMI.2016.2644615
[12] Chollet, F. (2017). Xception: Deep learning with depthwise separable convolutions. In Proceedings of the IEEE Conference on Computer Vision and Pattern Recognition, Honolulu, HI, USA, pp. 1251-1258.
[13] Rodriguez, D., Behnke, S. (2021). DeepWalk: Omnidirectional bipedal gait by deep reinforcement learning. In 2021 IEEE International Conference on Robotics and Automation (ICRA), Xi'an, China, pp. 3033-3039. https://doi.org/10.1109/ICRA48506.2021.9561717
[14] Chenoori, R.K., Kavuri, R. (2022). GrFrauder: A novel unsupervised clustering algorithm for identification group spam reviewers. Ingénierie des Systèmes d Information, 27(6): 1019-1027. https://doi.org/10.18280/isi.270619
[15] Tang, J., Qu, M., Wang, M., Zhang, M., Yan, J., Mei, Q. (2015). Line: Large-scale information network embedding. In Proceedings of the 24th International Conference on World Wide Web, Florence, Italy pp. 1067-1077. https://doi.org/10.1145/2736277.2741093
[16] Wang, D., Cui, P., Zhu, W. (2016). Structural deep network embedding. In Proceedings of the 22nd ACM SIGKDD International Conference on Knowledge Discovery and Data Mining, San Francisco, California, USA, pp. 1225-1234. https://doi.org/10.1145/2939672.2939753
[17] Li, G., Muller, M., Thabet, A., Ghanem, B. (2019). Deepgcns: Can gcns go as deep as cnns? In Proceedings of the IEEE/CVF International Conference on Computer Vision, Seoul, Korea, pp. 9267-9276. https://doi.org/10.1109/ICCV.2019.00936
[18] Li, P., Wang, G., Hu, J., Li, Y. (2020). Multi-granularity complex network representation learning. In Rough Sets: International Joint Conference, IJCRS 2020, Havana, Cuba, pp. 236-250. https://doi.org/10.1007/978-3-030-52705-1_18
[19] Tao, F., Zhang, H., Liu, A., Nee, A.Y. (2018). Digital twin in industry: State-of-the-art. IEEE Transactions on Industrial Informatics, 15(4): 2405-2415. https://doi.org/10.1109/TII.2018.2873186
[20] Qi, Q., Tao, F. (2018). Digital twin and big data towards smart manufacturing and industry 4.0: 360 degree comparison. IEEE Access, 6: 3585-3593. https://doi.org/10.1109/ACCESS.2018.2793265
[21] Minerva, R., Lee, G.M., Crespi, N. (2020). Digital twin in the IoT context: A survey on technical features, scenarios, and architectural models. Proceedings of the IEEE, 108(10): 1785-1824. https://doi.org/10.1109/JPROC.2020.2998530
[22] Lu, H.J., Zhang, B., Hou, L.K. (2024). Design and implementation of a digital twin system for monitoring automated container terminal equipment. Mechatronics and Intelligent Transportation Systems, 3(1): 55-72. https://doi.org/10.56578/mits030105
[23] Kan, H.Y., Li, C., Wang, Z.Q. (2024). Enhancing urban traffic management through YOLOv5 and DeepSORT algorithms within digital twin frameworks. Mechatronics and Intelligent Transportation Systems, 3(1): 39-54. https://doi.org/10.56578/mits030104
[24] Fuller, A., Fan, Z., Day, C., Barlow, C. (2020). Digital twin: Enabling technologies, challenges and open research. IEEE Access, 8: 108952-108971. https://doi.org/10.1109/ACCESS.2020.2998358
[25] Qi, Q., Zhao, D., Liao, T.W., Tao, F. (2018). Modeling of cyber-physical systems and digital twin based on edge computing, fog computing and cloud computing towards smart manufacturing. In International Manufacturing Science and Engineering Conference, Texas, USA, p. V001T05A018. https://doi.org/10.1115/MSEC2018-6435
[26] Kipf, T.N., Welling, M. (2016). Semi-supervised classification with graph convolutional networks. arXiv preprint arXiv:1609.02907. https://doi.org/10.48550/arXiv.1609.02907
[27] Song, E.Y., FitzPatrick, G.J., Lee, K.B., Griffor, E. (2021). A methodology for modeling interoperability of smart sensors in smart grids. IEEE Transactions on Smart Grid, 13(1): 555-563. https://doi.org/10.1109/TSG.2021.3124490
[28] Shahid, K., Nainar, K., Olsen, R.L., Iov, F., Lyhne, M., Morgante, G. (2021). On the use of common information model for smart grid applications—A conceptual approach. IEEE Transactions on Smart Grid, 12(6): 5060-5072. https://doi.org/10.1109/TSG.2021.3095896
[29] Saleem, M.U., Usman, M.R., Usman, M.A., Politis, C. (2022). Design, deployment and performance evaluation of an IoT based smart energy management system for demand side management in smart grid. IEEE Access, 10: 15261-15278. https://doi.org/10.1109/ACCESS.2022.3147484
[30] Wang, G., Yang, J., Xu, J. (2017). Granular computing: From granularity optimization to multi-granularity joint problem solving. Granular Computing, 2: 105-120. https://doi.org/10.1007/s41066-016-0032-3