Kalpana Govindarajan*![]() | Deepa Narayanasamy
| Deepa Narayanasamy![]()
© 2024 The authors. This article is published by IIETA and is licensed under the CC BY 4.0 license (http://creativecommons.org/licenses/by/4.0/).
OPEN ACCESS
Breast cancer is one of the most frequently affecting second types of cancer in men and women worldwide. Of the overall types of cancer, 25% of them are breast cancer in women. Erratic development of breast cells results in breast cancer. The growth of cancer increases the metastasizing of the tissues, spreads fast to the other parts of the body, and results in death. The medical industry requires an efficient algorithm to detect and classify the severity level of breast cancers with the metastasis of the affected tissues. Several earlier research works have focused on constructing a computer algorithm to diagnose breast cancer images to detect and classify cancer. The earlier algorithms involved more sub-functions or procedures in completing individual tasks separately, thus increasing the computational and time complexity. This paper introduces a Deep Learning Framework (DLF) to diagnose breast images automatically and speedily with less complexity. The proposed DLF includes a few image processing tasks to improve the quality of the input image and increase classification accuracy. Recently, Convolution Neural Network has been used as an extraordinary class of models for image recognition processes. CNN is one of the deep learning models that can extract the entire set of image features and use them for analysis and classification. Thus, this paper implements a deep CNN for diagnosing and classifying benign and malignant cancers from input datasets with Python coding—the deep form of the CNN obtained by increasing the number of hidden layers and epochs. The experiment proves that CNN is highly reliable compared to the existing algorithm.
breast cancer, mammogram image, feature extraction, benign, malignant, CNN, deep learning algorithm
One of the global challenges is breast cancer, which caused more than 600,000 deaths in 2018 [1]. One of the fatal diseases is breast cancer, which has a high mortality rate globally and is also difficult to control in the present world, especially in developed cities. Early detection of breast cancer by screening the breast mammogram images can decrease the mortality rates from 40% to 20% [2]. Nevertheless, the medical industry and researchers still find false positive and false negative rates with high costs due to non-uniformities in quality assessment. Thus, the industry still needs an efficient computer diagnostic model for breast mammograms to identify the early symptoms of breast cancer and reduce the mortality rate. Some recent researchers [3-12] have shown interest in implementing deep learning algorithms for diagnosing breast mammogram images to address the above-said limitations. The researchers have also found difficulties in training large amounts of data to get generalized trained labeled datasets. This is due to the growing population and the issues in image acquisition and modalities.
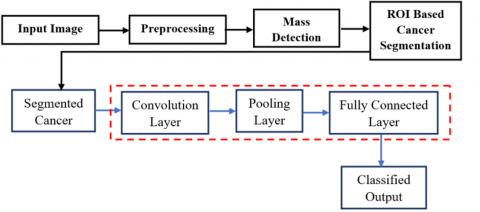
Screening mammograms are complicated due to the inability to observe the size of small images and other abnormal characteristics in microcalcification. It is difficult to differentiate the lesions of the dense breast structure from the typical breast structure. Thus, the most conventional methods, AI [13], and machine learning algorithms are less accurate in classification. Hence, breast cancer diagnostics must develop a computer-aided software module using efficient algorithms like deep learning. Big data and deep learning algorithms are widely used as popular cutting-edge technologies. Healthcare is one such application. A standard breast cancer analysis model used earlier is illustrated in Figure 1.
The earlier conventional models comprise several sub-modules or sub-functions for preprocessing, image enhancement, feature extraction, and classification. For example, for noise removal, denoising methods are used; contrast enhancement or brightness enhancement methods are used for image enhancement, and vice versa. Thus, the computational and time complexity was high in earlier research works. Also, they are suitable for fewer images, not high dimensional or more images. Compared to conventional methods, machine learning and deep learning algorithms can process a large amount of data, i.e., more breast cancer images for classification. Generally, the learning algorithms learn the data deeply and obtain several features from the data for classification. Learning algorithms follow the training and testing process to increase the efficiency of the data classification. The standard procedure of the learning processes is illustrated in Figure 2. The classification accuracy is high since it uses the trained features to compare with the testing data; thus, machine or deep learning models are used in medical image classification tasks.
Figure 1. Breast cancer detection and classification
Figure 2. Deep learning for breast cancer analysis
Big data analytics is used for processing, analyzing, and extracting useful information from many datasets. Deep learning is the advanced version of machine learning which performs closer to human intelligence [14]. Many medical images are processed using deep learning algorithms to detect and classify abnormalities. Deep learning algorithms can implement deep neural networks using high computational power GPUs. It has multiple layers for learning and extracting a wide range of features, which was not done in the earlier works. One popular and proven deep learning algorithm is CNN, which remarkably impacts image processing, segmentation, and recognition [15]. Many deep learning models are being implemented for diagnosing and classifying breast cancer in digital mammography, like CNN, InceptionV3, MobileNet, DenseNet121, InceptionResNetV2, VGG16, VGG19, XceptionNet, DenseNet169, which are used to diagnose in situ and invasive ductal carcinoma, inflammatory and metastatic breast cancers with better accuracy and efficiency. Hence, this paper aims to design a novel architecture of the CNN algorithm for breast cancer classification. The main reason for using the CNN algorithm is that most recent research concluded that it has more extraordinary model classes for image processing and classification problems. CNN can learn from the given data in-depth, extract almost all the features, and practice them to analyze the input image. Other conventional, semi-automatic, and machine-learning algorithms need the help of other algorithms for feature extraction. Thus, this paper contributes the following processes:
This work is unique because it implements a framework involved with image preparation (preprocessing, image enhancement, ROI-based cancer portion segmentation), image learning, feature extraction, and classification. Thus, it reduces time complexity and helps medical practitioners identify the early symptoms of breast cancer to reduce the mortality rate.
This research provides a brief survey regarding various methods, techniques, and algorithms focused on detecting and classifying breasts over mammogram images. The survey helps laymen understand the basic research problem and its statement concerning the issues and challenges in earlier research. It provides a better idea for creating a new CNN design to overcome the problems. Many types of research have been done in the past on breast cancer. Most of them have suggested a deep learning algorithm to be the best method for its detection. The below-mentioned reviews have been taken from various articles on this topic. One of the authors [16] stated that breast cancer is one of the most common cancers. Most women are affected by this type of cancer worldwide. The estimation taken in 2015 showed that globally, around 561,334 deaths occurred due to metastatic breast cancer.
Becker [17] stated the state-of-the-art treatment and methodologies used for breast cancer. It is one of the most common health issues faced by women. The basic guidelines for understanding the current medical sectors, treatment methods, and technologies used for breast cancer are presented in detail. Qiu et al. [18] proposed a deep learning algorithm-based novel short-term risk assessment model for diagnosing breast cancer. For this experiment, 270 cases were taken; 135 were positive, and the remaining were negative. These selected cases were divided into two categories: training and testing sets. For the training set, 200 cases were taken. For the testing set, 70 cases were taken. The experiment used a deep learning-based Computer-Aided Diagnosis (CAD) scheme. The result showed that the new deep learning-based CAD system provided a 69.2% positive value and 74.2% negative value, and the total accuracy value was 71.4%.
Han et al. [19] proposed a deep-learning algorithm for identifying and classifying breast cancer. It achieves an accuracy of 93.2%. The proposed method efficiently diagnosed and detected breast cancer in the healthcare sector. Wei et al. [20] proposed a deep learning-based image classification method for detecting breast cancer. This image classification model achieved an accuracy of 97%. It acts as an efficient tool in healthcare for breast cancer treatment. Khuriwal and Mishra [21] proposed a deep-learning algorithm for breast cancer with the help of the UCI dataset. This method was diagnosed with an accuracy of 99.67%. From 569 rows and 30 features dataset, 11 features were taken for diagnosis. Preprocessing was applied before the model was trained. After the process, the features were obtained. The preprocessing algorithms were Normaliser, Label Encoder, and StandardScaler. These algorithms provided better results with high accuracy.
Cardoso et al. [22] presented a report regarding metastatic breast cancer. The report pointed out some drawbacks in the healthcare sector and patients. The patients do not openly share their issues with the doctors. So, the caregivers do not discuss breast cancer with the patients. The author concluded that the quality of the healthcare sector and the communication between the patients and the caregivers (clinicians, oncologists, healthcare professionals, etc.) has to be improved for better treatment. Toğaçar and Ergen [23] discussed deep learning-based breast cancer detection. The proposed method provided faster and more accurate results than the existing methods. The features were extracted by using the AlexNet method. It achieved an accuracy of 93.4%. Ismail and Sovuthy [24] stated that deep learning is the best method for detecting breast cancer. Classification, image processing, and performance evaluation were the steps involved in the diagnosis method. Then, VGG16 and ResNet50 were used to classify the normal and abnormal tumors. The result showed that VGG16 and ResNet50 had achieved 94% and 91.7% accuracy, respectively. Zhang et al. [25] presented a model representing novel information on breast cancer in patients. Deep learning algorithms learn all input data based on the attributes and hidden information extracted with the help of the BERT and NER models. The result showed that NER achieved 93.35%, and relation extraction achieved 96.73% of the F1 score.
Murtaza et al. [26] proposed deep learning-based medical image modalities for breast cancer classification. Finally, the author reviewed recent state-of-the-art breast cancer detection and classification technologies and various image modalities models. Jiménez-Gaona et al. [27] explained the Deep Learning-based Computer-Aided Detection (DL-CAD) method for breast cancer classification. It reduced manual feature extraction. Saber et al. [28] proposed deep learning for feature extraction from the MIAS dataset. The author used different CNN architectures, such as VGG16, VGG19, Inception-V2-ResNet50, and Inspection-V3-ResNet50. Finally, the performance was evaluated using F-score, precision, accuracy, sensitivity, and ROC value. The experiment results showed that VGG16 is the best model for breast cancer detection. Ghosh et al. [29] explained that deep learning algorithms are promising models for breast cancer detection. Multiple deep-learning algorithms were experimented with and compared. Their outputs showed that the LSTM and GRU methods provided 99% accuracy and proved cancer detection efficiency. Liu et al. [30] proposed a hybrid deep-learning method for predicting breast cancer. The multimodal fusion framework was implemented for detection. The result showed that the new hybrid deep learning model was more efficient and accurate than the existing one. It outperformed the existing model with an overall accuracy of 88.07% and 74.5% for the molecular subtype.
From the above-discussed literature survey, it is identified that the earlier methods have to increase their efficiency regarding the volume of the input dataset, learning rate, depth of learning, and the number of features extracted for classifying cancer. Some research works have used small-sized datasets [31], while some have not focused on segmenting the images [32]. And some of the works have focused on manually extracting breast areas in the mammogram images [33, 34]. Due to these processes, the time and computational complexities have increased.
Some supervised algorithms like the ANNs also automate breast cancer detection. ANN algorithms use ensemble-based methods for automatically detecting breast cancer [35]. Various up-sampling techniques adopted ensemble-based methods to improve the resolution of the images. It was also suggested that ensemble methods used many balanced classes that help improve the quality of the pixels and soften the images. With the development of deep learning algorithms, multiple-level segmentation of breast cancer images was achieved. It involves a capsule-based network that uses deep learning to diagnose breast cancer. It used mammogram images to train the deep learning model. The mammograms were filtered through a median filtering algorithm based on fuzzy methods [36]. It removed the noise and smoothened the images.
The cancer was detected through a back propagation network that classified the mammograms for feature extraction and was validated with Mini-MIAS and DDSM datasets. It provided better segmentation results with an accuracy of 97 to 98%. The ensemble-based methods were adopted in the deep learning algorithms for better segmentation, which were used in the decision support systems in clinics that adopted computer-aided diagnosis methods. They also used Chaotic Krill herd algorithms applied with Kapur's entropy, which provided better segmentation of the mammograms. VGG-16 and VGG19 were compared for feature extraction, and PSO and MLP algorithms were used to classify the images [37]. Ultrasound images were also used in breast cancer detection as they provided a better view of the breast. Several research works involving deep learning algorithms trained them using ultrasound images. The CNN algorithms extracted the features and updated them with multiple iterations. The results obtained from the 2D B-mode ultrasound images provided better accuracy and were suitable for implementation in clinical applications [38]. The features extracted from ultrasound images were also augmented through the CNN algorithms. It also improved the efficiency of CNN in predicting cancer. They also used pre-trained DarkNet-53 models to classify the features efficiently. The augmented classes were used in the output layer for efficient classification [39]. The feature selection was made through the gray wolf and differential evaluation methods. Again, the features selected were fused using probability-based machine learning algorithms that aligned the features serially. However, all these methods lacked accuracy and computational complexities. To solve these issues, this research proposed a deep learning framework that includes image preprocessing, segmentation, learning, feature extraction, and classification. The novelty of this research work is that it provides image preparation before it is fed to the deep learning model. Bakator and Radosav [39] conducted an extensive study on applying deep learning models like the CNN algorithm in medical image processing and the accuracy of the deep learning models in the prediction process. Latha et al. [40] also surveyed the applications of the deep neural network on cancer diagnosis and the capability of these models to build fully automatic applications with better accuracy.
The steps involved in processing the breast images and detection (Figure 3) are as follows: image preprocessing, detection of cancer areas, feature and attribute extraction and selection, data generation for training, and training classifiers. The image preprocessing is carried out to improve the contrast in the images, which helps to identify the cancer areas quickly. It is followed by detecting the cancer-affected regions in the images, which helps reduce the computation process. Then, the necessary features, like the deep, morphological, textural, and density-based features, are extracted. The features extracted are used to train the classifiers. The trained classifiers can detect breast cancer from the images in the test dataset. The paper's novelty is the integration of image preprocessing and optimization models with the deep learning framework and deep learning algorithms to provide a complete prediction process from the raw images to the output predictions without any manual intervention.
Figure 3. The process flow
3.1 Breast image preprocessing
Various preprocessing algorithms help improve the image quality and the prediction process. The adaptive mean filter algorithm is widely used in various breast cancer detection processes as it removes noises in the input image. A fixed frame needs to be considered before preprocessing the images. The aspect ratio of all the images is maintained in that format. For each image, the mean and variance are checked. In addition to that, the spatial correlation of the images is also checked.
If the values point to any noise level in the image, the pixel values containing noise are replaced with a mean value. The contrast of the images is then improved using the contrast-enhancing algorithm. The areas suspected of cancer and the normal tissues surrounding it are differentiated by enhancing the contrast during the contrast enhancement process. Then, the grayscale of the images is widened, which automatically improves the contrast. All these steps are followed for easier detection of breast cancer and to reduce the computational overhead that can slow down the detection process.
3.2 Mass detection
Mass detection detects areas in the images where the cancer cells are densely populated. It helps in reducing computational overhead. The precision in the segmentation of mass regions depends on the quality of the features extracted. Mass detection can be carried out through various algorithms. This research uses the CNN model to learn and extract more features using multiple convolution and pooling layers. The depth of the learning process depends on the number of layers used in the model. During the initial stages, the ROI of the images must be found. Then, the ROI is classified into non-overlapping sub-regions through a sliding window. It is checked whether all the sub-regions are traversed successfully. The in-depth features in the sub-regions are then extracted. The obtained features are clustered, and the area with the dense population of cancer cells is detected.
3.3 ROI extraction
Many gray value (0) areas are found in the mammograms. It does not have any influence on breast CAD. The efficiency of image processing can be improved by extracting the mammary area from the overall mammogram. An adaptive detection algorithm for mass area detection extracts the regions with densely packed cancer cells. In the mammogram, sequential rows are scanned to detect the first and last non-zero pixels. Following that, the columns are also scanned to find the same. The sub-regions are segmented from the mammograms by eliminating zeros in the image. It collects only the non-zero elements from the whole image, and each portion is extracted using ROI operation and considered a sub-region of the input image. The area taken under consideration for detecting the masses is rectangular, and the coordinates of the rectangle are
$\left[x_s, y_s, x_d, y_d\right]$ (1)
The algorithm processes the pixels within this rectangular area, and their length and breadth can be calculated through the following formula:
$W=x_d-x_s$ (2)
and
$H=y_d-y_s$ (3)
The Sliding Window (SW) concept segments the rectangular area into several parts. Let w and h be the length and width of the SW,
where $(\mathbf{W} \geq \mathbf{w}, \mathbf{H} \geq \mathbf{h})$ (4)
First, the rectangular area is chosen within which the cancer tissues are searched. The dimensions of the rectangle are (W×H). The SW segments the rectangular area with the dimensions (w×h). It traverses through the search area within that rectangular boundary. The divided portions can be termed non-overlapping sub-regions. These sub-regions help in extracting the necessary features for breast cancer detection. Each part has 48 × 48 dimensions, with its step size for searching being 48. In the end, there is an N number of non-overlapping regions. These are termed as
$\left(S_1, S_2, \ldots \ldots, S_N\right)$ (5)
These regions are considered to be the small size of (48 × 48) images that are inputted to CNN.
This research proposes a deep Convolution Neural Network model for learning and classifying segmented breast cancer. CNN is used to examine breast cancer images and to classify them based on their features to detect the affected area. It can be automated with less manual work and requires less preprocessing. Backpropagation is used to improve the accuracy of neural networks. The design of the CNN algorithm is similar to the MLP, which consists of input, hidden, and output layers. Each layer has a neuron that connects to the neurons of the succeeding layers. The images to be segmented are passed through several layers. The convolutional layers in the CNN (Figure 4) filter the images. This is done by enhancing the features of the images and increasing the number of parameters in the images. It increases the details in the images, increasing the file size. Then, the enhanced images are sent to the pooling layer. It is used to down-sample the features in the images, where it decreases the number of parameters and the file size. Reducing the file size helps to improve image processing efficiency and speed. Then, the images are subjected to the Max pooling and Average pooling to increase and decrease the images' hyperparameters. The activation function - the Rectified Linear Unit- maintains the non-linearity. The output is divided into classes after passing through the fully connected layers. This type of network is mainly used for image processing for its enhanced signal transition and accurate feature extraction. CNN algorithms are widely used to detect cancer cells as they can extract the exact features that help detect cancer cells. It also helps in the early detection of cancer cells.
From the segmented sub-regions, CNN learns and extracts the features. It consists of 7 layers, in which there are 3 convolutional layers in the initial stage for improving the quality of the images. Then, the size and parameters of the images are reduced through 3 max-pooling layers, which follow the convolutional layer. Finally, a fully connected layer is present, which extracts the necessary features. The sub-regions with dimensions 48 × 48 × 3 are given as an input to the first convolutional layer. The kernel size of the images is 9 × 9 × 3. The outputs obtained are with the size of 40 × 40 × 12.
$\operatorname{Conv}^k(i, j)=\sum_{u, v}^n W^{k, l}(u, v), \operatorname{input}^i(i-u, j-v)+b^{k, l}$
Here the $\boldsymbol{k}^{\boldsymbol{t h}}$ kernel is represented as $\boldsymbol{W}^{\boldsymbol{k}, \boldsymbol{l}}$ and the bias of the $\boldsymbol{k}^{\boldsymbol{t h}}$ layer is shown as the $\boldsymbol{b}^{\boldsymbol{k}, \boldsymbol{l}}$. The activation function used here is tanh which maintains the activation value within the range $[-1,1]$.
$\text { output }^k(\boldsymbol{i}, \boldsymbol{j})=\tanh \left(\operatorname{Conv}^k(\boldsymbol{i}, \boldsymbol{j})\right)$
The outputs from each layer are forwarded to the connected succeeding layers. The size of the output is 2 × 2 × 6. The output can be summed up to 24 neurons present in the fully connected layer. The in-depth features extracted by the CNN algorithm are fed as matrix data X, and the output is obtained as clusters. The training set X helps to form the Laplacian operator L. The output matrix is obtained randomly from the output obtained from the hidden layers. If the number of neurons obtained from the hidden layer is higher than that of the input, output weights are calculated using the following formula.
$\operatorname{Min}_{\beta \in R^n}{ }_{h \times n_o}\|\beta\|^2+\lambda \operatorname{Tr}\left(\beta^T H^T L H \beta\right)$
The weights are represented as $\beta$ present within the hidden and output layers. Or else, $\left(I_0+l H^T L H\right) v=\lambda H^T H v$ to calculate the same weights. The embedding matrix of the weights is calculated through the k-means algorithm that makes $\mathrm{k}$ categories of clusters through $\mathrm{N}$ number of points.
3.4.1 Classification
In the medical industry, breast cancer is classified into benign and malignant according to the pathological behavior of the breast masses detected from mammogram images. The CNN model can deeply extract the segmented masses' features to obtain their behavior. Medical experts provided some information on malignant cancers: irregular shape and the surface is not smooth, burr-like edge, hard nodules, and different density compared to normal. The benign tissues are on the right, opposite to malignant ones with a normal shape and soft surface with the correct density. The types of features are modeled in the following manner,
$F=\left[F_1, F_2, F_3, F_4\right]$
Each F denotes the distinct features of the images, like deep, morphology, texture, and density. CNN has many advantages over any other algorithm, consisting of convolutional and pooling layers that extract the necessary features. It does not need any human participation to extract the image characteristics. The CNN algorithm with 10 layers extracts the features from the images. The input to the algorithm is the segmented images. After passing through several convolutional and max-pooling layers, the images are sent to the final layer, the fully connected layer consisting of 20 neurons. It denotes the deep features as
$F_1=\left[c_1, c_2, \ldots ., c_{20}\right]$
3.4.2 Morphological features
Morphological features are essential for detecting breast cancers. Experienced doctors primarily define it. It is also helpful in defining the difference between benign and malignant tissues. Some of the morphological features like roundness, radius entropy, radius variance, and roughness are considered in this research work. The morphological features are listed as:
$F_2=\left[g_1, g_2, g_3, g_4, g_5\right]$
3.4.3 Texture features
It is an important parameter as it shows the characteristics of benign and malignant tissues, which helps in determining the earlier cancer diagnosis. Haralick introduced a gray-level co-occurrence matrix comprising the required grayscale texture features. It describes the distribution of grayscale in the picture. It works based on the probability of second-order joint conditions. The texture features extracted are the entropy, correlation coefficient, inverse moment, energy, and contrast efficiency. It is expressed as the:
$F_3=\left[t_1, t_2, t_3, t_4, t_5\right]$
3.4.4 Density features
In recent studies, it has been proved that the density features help detect breast cancer earlier. There is a significant loss in the density of the masses when the severity of breast cancer increases [37, 41]. The density features considered in the proposed work are shown as follows:
$$
F_4=\left[d_1, d_2, d_3, d_4, d_5, d_6, d_7\right]
$$
The classification of the features is done using the CNN algorithm proposed here. It provides good generalization and learning speed. It is also insensitive to any manual parameters. It diagnoses breast cancer as benign and malignant. The input data is classified into training and testing datasets. The randomly generated weights during the training are $w_i$, and the bias is $b_i$. These parameters are obtained from the hidden layers. The output matrix $\mathrm{H}$ is calculated by the hidden layer using the $w_i, b_i$ and $\mathrm{F}$ is the fusion feature. Here $\beta$ is the output weight vector obtained from the training. The overall process of the proposed method is given in the form of an algorithm. So, it can be programmed in any computer programming language, and the performance is verified.
Table 1. Types of features
|
Morphological |
Texture |
Density |
Other Types of Features |
|
Radius-entropy Roundness Radius variance Roughness |
Energy Entropy Correlation coefficient Inverse movement |
Histogram skew Histogram variance Histogram peak Histogram mean |
Texture features from GLCM Gray-level histogram analysis Image features from Gray Level Run Lengths Gray-level sharpness measure, Shape, Size, Area, Radius, Perimeter |
Figure 5. Features extracted
Figure 6. Abnormality visualization
Algorithm_DLF (Data, string cancer-class) {
Input: I, N // number (N) of images (I)
Output: OC // Benign or Malignant
for i= 1 to W // Width of the image
for j = 1 to H // Height of the image
Cut and crop all the small-sized image Si = I(xi,yj)// non-zero elements
End j
End i
for i= 1 to m
Si→CNN
Fi→CNN.features(Si)
End i
For i = 1 to N
CNN.layers←Fi
Analyze and compare Fi and label it using cancer-class
End i
test(I)→CNN
f=CNN.test(I)
compare f and Fi.cancer-class
return cancer-class
}
The set of images is preprocessed and fed to CNN. It learns the images, extracts the features, and creates cancer classes, such as benign or malignant. Some features used for classifying breast cancer are given in Table 1. In the convolution layer, the ReLU layer activates the functions of the convolution filter, which can filter out all the features. The filters in the convolution layer are trainable filters used for updating all the hyperparameters at each epoch of the training process. The set of all features extracted and estimated to detect and classify breast cancer is shown in Figure 5. Some of the feature types are given in Table 1.
Figure 6 shows the total number of normal and abnormal images available in dataset-1, which has various information about the breast cancer diagnostic data (Wisconsin). It has 32 columns representing individual features of the data. From the total number of images, 1600 images have mass and are classified as mass images.
This research presents a Deep Learning Framework for automatic breast cancer detection and classification by integrating image processing tasks and a deep learning algorithm. Using breast mammogram images, the proposed DLF is validated. MATLAB and Python programming are used to implement the DLF, and CNN is used to validate them. The CNN model comprises five layers: Convolution, ReLU, max-pooling, fully connected, and dropout layer. The convolution layer is considered the most important since it has trainable filters to update the entire set of parameters in each operation round.
The ReLU layer is preferred because it speeds up the overall convolution process and maximum pooling to train the model. The convolution layer extracts all feature values from the input dataset, where the features' dimensionality is reduced using the pooling layer. All the neurons in the FC layer act like regular NN, where the dropout layer is used to drop the unwanted feature data. The proposed DLF accepts any image size of the input image since it collects only the non-zero elements and creates sub-regions for detecting cancer. The CNN does training on 80% of the dataset and creates labeled data for the testing process. In the experiment, the number of layers used here is not restricted, whereas the result of the CNN is validated for nine layers. The image size in each layer using one CNN model is given in Table 2. The striding operation learns the entire data in the depth of 3 for learning the entire set of features. The striding and padding operation is repeated until getting the final class 2 x 1, such as benign and malignant. The implementation of the CNN architecture used in this research work is given in Table 2. In each consequent layer, the size of the image and kernel decreases, and the number of kernels used in the learning process increases. The striding operation works fast according to the learning rate (0.01%) and dropout rate (0.03%).
Table 2. CNN architecture implementation
|
Model: “Sequential” |
||
|
Layer (Type) |
Output Shape |
Param # |
|
conv2d (Conv2D) |
(None, 50, 50, 32) |
896 |
|
max_pooling2d (MaxPooling2D) |
(None, 25, 25, 32) |
0 |
|
conv2d_1 (Conv2D) |
(None, 25, 25, 64) |
18496 |
|
max_pooling2d_1 (MaxPooling2 |
(None, 12, 12, 64) |
0 |
|
conv2d_2 (Conv2D) |
(None, 12, 12, 128) |
73856 |
|
max_pooling2d_2 (MaxPooling2 |
(None, 5, 5, 128) |
0 |
|
conv2d_3 (Conv2D) |
(None, 5, 5, 128) |
147584 |
|
max_pooling2d_3 (MaxPooling2 |
(None, 2, 2, 128) |
0 |
|
flatten (Flatten) |
(None, 512) |
0 |
Dataset Used
The image processing tasks, such as image preprocessing, are experimented with using MATLAB software (2019), and the results are taken as input to Python code. The code runs on a laptop, intel-core-i7, 7th generation system, 2.9 GHz processes, 1TB HDD, and 16 GB RAM. Two benchmark databases (Table 3) were used to evaluate the proposed DLF. They are in the breast dataset [42] and CBIS-DDSM [43]. The total number of images used in the experiment is more than 10,000. However, less than 10000 images were only considered to reduce the complexity and understand the performance measure calculation.
One of the essential processes carried out in the experiment is image preprocessing. The DLFCNN model initially reads and preprocesses input images, such as denoising and cropping. Figure 7 shows the different steps involved in the preprocessing tasks. Figure 7(a) shows the input image, Figure 7(b) shows the de-noised image using an adaptive mean filter, Figure 7(c) shows the cropped image, which helps to reduce the computational complexity, Figure 7(d) illustrates the output obtained after background subtraction, and Figure 7(e) illustrate the brightness of the image, due to this preprocessing, the output of the classification accuracy can be improved.
Table 3. Dataset used
|
Dataset |
Total Images |
Benign |
Malignant |
|
DMR-IR (Frontal Thermal Images) 640 × 480 size |
1000 |
500 |
500 |
|
CBIS-DDSM (Mammogram) 1024 × 1024 size |
6000 |
1400 |
4600 |
|
Wisconsin |
Cropped |
ROI |
Full mammogram |
Figure 7. Preprocessing
Figure 8. Categories of images in Wisconsin
Figure 9. Categories of images in Wisconsin
The dataset-3 comprises three different categories such as cropped images (Figure 8(a)), RO images (Figure 8(b) and Figure 8(c)), and full mammogram images (Figure 8(d)). The sum of the above categories is shown in Figure 9. Figure 7, Figure 8, and Figure 9 are used for data visualization. The main advantage of the research work and its novelty is that it avoids learning the non-cancer portion of the breast images. More pixels in the images do not have any information, and the pixel values are 0 and need to be eliminated. Two different kinds of breast cancer are recorded from the dataset: benign and malignant. Here only the mass lesions are collected for detection and classification.
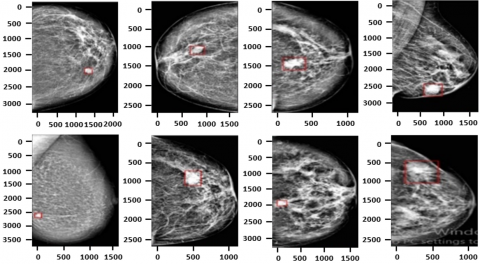
Figure 10. Input images with bounding boxes (in-breast dataset)
An accurate contour is created around the mass part where cancer will be detected. The contours are then converted into bounding boxes and will be annotated in the training process. Some of the input images with bounding boxes are shown in Figure 10. All the images are first cropped based on the non-zero elements in the experiment. It is assumed that the image pixels' mass or tumor occurred locations must have a non-zero value. So, the cancer portion of the input images is cropped and considered input to CNN. It can be obtained by calling the in-built ROI function (OTSU) stored in the software. After ROI creation, image truncation, enhancement, and synthesizing are applied for preprocessing the cropped images $(S i)$. The results obtained after ROI is shown in Figure 11. The image may have black pixels even after cropping. It harms cancer detection. Thus, the normalization process is applied to the image. It normalizes the pixel intensities in the breast region. The normalization process averages the pixel values within a short range. It helps to increase the detection accuracy in breast mammogram images. The output of the normalization process is shown in Figure 12.
The image enhancement process is carried out using the contrast level adaptive histogram equalization method, and the obtained results are given in Figure 13. The enhancement process helps the DLF to differentiate the pixels from normal to abnormal. In addition to this, the images are synthesized. It is a process that generates an artificial image having the desired content. It is an inverse process of classification having visual data related to the label of the data. After successful preprocessing, all the images are cropped and applied with the bounding boxes. The cropped ROI images are given in Figure 14 and fed to the CNN algorithm for feature extraction and classification.
From the dataset, 80% of the images are used in the training process to increase detection and classification accuracy. The Python platform provides several libraries to implement CNN and support its performance. The CNN model is trained with features like density and texture to make the classifier efficient. The classified output is labeled benign or malignant and is used to validate 20% of the images.
Figure 11. ROI output
Figure 12. Normalization results
Figure 13. Results of CLAHE
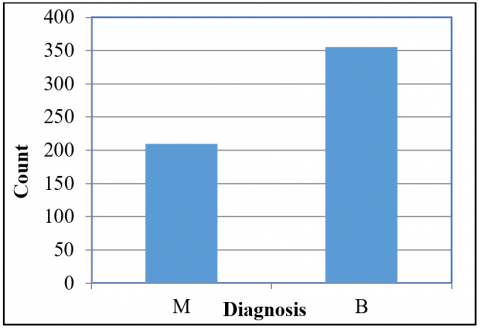
The CNN analyzes the input images and provides the number of benign and malignant as the final result. It follows the same procedure, and the trained labels are used for comparison during classification. The detection efficiency of the proposed DLF is cross-validated by comparing the detection accuracy with the ground-truth images. The experimental result compared with the ground truth is shown in Figure 15. The final classification result is shown in Figures 16 and 17. Figure 16 shows the automatic classification output obtained from the DLFCNN. It shows that the number of benign ones is higher than the malignant ones. Compared to the original dataset, the number of benign and malignant classifieds is highly matched. In the first round, the number of images taken to classify is 660, where 355 are benign and 210 malignant. The number of images changed in each experiment round is repeated to verify the classifier's efficiency.
Figure 14. Detected breast cancer (sub-regions)
Figure 15. Experiment vs. ground truth
Figure 18. B/M based on Texture_Mean
Figure 19. B/M based on Perimeter_ Mean
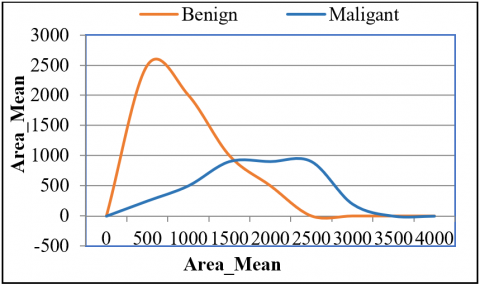
Figure 20. B/M based on Area_ mean
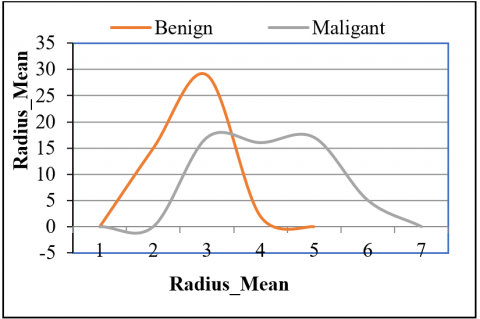
In the second round, the classified output is compared with the feature-based classification. The benign and malignant classes are obtained according to individual feature types (given in Table 1). Four different features are taken for cancer prediction. They are Radius_Mean, Texture-Mean, Perimeter_Mean, and Area_Mean. The classified result according to these features is given in Figure 17, Figure 18, Figure 19, and Figure 20, respectively. From the overall explanation and the experimental results, the proposed DLF outperforms in classification. To evaluate the performance, the proposed DLF is compared with the implementation of the existing U-Net [44]. The performance measures calculated to compare the proposed DLF are sensitivity, specificity, and accuracy. The term accuracy represents the number of instances correctly classified completely using the following formula:
Accuracy $=\frac{T P+T N}{T P+T N+F P+F N}$
Sensitivity $=\frac{T P}{T P+F N}$
Specificity $=\frac{T N}{T N+F P}$
where, TP: is the successfully classified positive classes;
TN: is successfully classified as negative classes;
FP: is wrongly classified as negative as positive;
FN: is wrongly classified as positive as negative.
The above-said parameters are calculated for performance verification and evaluation. Table 4 shows the performance evaluation of the proposed DLF. The proposed DLF is compared with the existing methods, such as CNN [44], ResNet-18 [44], GoogleNet [44], and VGG-16Net [44], SVM [45], LDA [46], and KNN [47] in terms of performance measures. Table 4 shows the performance comparison. The comparison results show that the proposed DLF is highly suitable for detecting and classifying any kind of breast mammogram images of any size. Thus, this method can be used for real-time medical image processing, and the efficiency is verified. Regarding the classification accuracy comparison, the proposed DLFCNN obtained higher accuracy than other learning models, as depicted in Figure 21.
Table 4. Performance comparison
|
Methods |
Sensitivity |
Specificity |
Accuracy |
|
CNN [37] |
99.3 |
100 |
98.67 |
|
ResNet-18 [37] |
93.3 |
88 |
98.7 |
|
GoogleNet [37] |
79.33 |
84 |
74.67 |
|
AlexNet [37] |
50 |
0 |
100 |
|
Proposed DLF |
99.67 |
100 |
99.78 |
Figure 21. Performance comparison
Breast cancer is the most common disease that brings sudden death to humans, especially women. Design and implementation of a deep learning algorithm for detecting and classifying breast cancer on breast mammogram images are effective in various image processing environments. Compared to earlier methods, the demand in the medical industry is an efficient breast cancer detection and classification model. Thus, this work has aimed to provide an automatic tool to detect and classify breast cancer on all kinds of breast images for different image sizes. The proposed DLF includes a few image processing tasks to improve the quality of the input image and increase classification accuracy. Recently, Convolution Neural Network has been used as an extraordinary class of models for image recognition processes. CNN is one of the deep learning models that can extract the entire set of image features and use them for analysis and classification. Thus, this research implemented a deep CNN for diagnosing and classifying benign and malignant cancers from input datasets with Python coding. The deep CNN proves to be highly reliable and more efficient from the experiment than other existing algorithms. The accuracy obtained from the proposed deep CNN is 99.78% higher than other algorithms.
[1] Bray, F., Ferlay, J., Soerjomataram, I., Siegel, R.L., Torre, L.A., Jemal, A. (2018). Global cancer statistics 2018: GLOBOCAN estimates of incidence and mortality worldwide for 36 cancers in 185 countries. CA: A Cancer Journal for Clinicians, 68(6): 394-424. https://doi.org/10.3322/caac.21492
[2] Seely, J.M., Alhassan, T. (2018). Screening for breast cancer in 2018—what should we be doing today? Current Oncology, 25(s1): 115-124. https://doi.org/10.3747/co.25.3770
[3] Rodriguez-Ruiz, A., Lång, K., Gubern-Merida, A., Broeders, M., Gennaro, G., Clauser, P., Helbich, T.H., Chevalier, M., Tan, T., Mertelmeier, T., Wallis, M.G., Andersson, I., Zackrisson, S., Mann, R.M., Sechopoulos, I. (2019). Stand-alone artificial intelligence for breast cancer detection in mammography: Comparison with 101 radiologists. JNCI: Journal of the National Cancer Institute, 111(9): 916-922. https://doi.org/10.1093/jnci/djy222
[4] Rodríguez-Ruiz, A., Krupinski, E., Mordang, J.J., Schilling, K., Heywang-Köbrunner, S.H., Sechopoulos, I., Mann, R.M. (2019). Detection of breast cancer with mammography: Effect of an artificial intelligence support system. Radiology, 290(2): 305-314. https://doi.org/10.1148/radiol.2018181371
[5] Wu, N., Phang, J., Park, J., et al. (2019). Deep neural networks improve radiologists’ performance in breast cancer screening. IEEE Transactions on Medical Imaging, 39(4): 1184-1194. https://doi.org/10.1109/TMI.2019.2945514
[6] Ribli, D., Horváth, A., Unger, Z., Pollner, P., Csabai, I. (2018). Detecting and classifying lesions in mammograms with deep learning. Scientific Reports, 8(1): 4165. https://doi.org/10.1038/s41598-018-22437-z
[7] Kooi, T., Litjens, G., Van Ginneken, B., Gubern-Mérida, A., Sánchez, C.I., Mann, R., den Heeten, A., Karssemeijer, N. (2017). Large-scale deep learning for computer-aided detection of mammographic lesions. Medical Image Analysis, 35: 303-312. https://doi.org/10.1016/j.media.2016.07.007
[8] Geras, K.J., Wolfson, S., Shen, Y., Wu, N., Kim, S., Kim, E., Heacock, L., Parikh, U., Moy, L., Cho, K. (2017). High-resolution breast cancer screening with multi-view deep convolutional neural networks. arXiv preprint arXiv:1703.07047. https://doi.org/10.48550/arXiv.1703.07047
[9] Lotter, W., Sorensen, G., Cox, D. (2017). A multi-scale CNN and curriculum learning strategy for mammogram classification. In Deep Learning in Medical Image Analysis and Multimodal Learning for Clinical Decision Support. DLMIA ML-CDS 2017 2017. Lecture Notes in Computer Science, Springer, Cham. https://doi.org/10.1007/978-3-319-67558-9_20
[10] Schaffter, T., Buist, D.S., Lee, C.I., et al. (2020). Evaluation of combined artificial intelligence and radiologist assessment to interpret screening mammograms. JAMA Network Open, 3(3): e200265-e200265. https://doi.org/10.1001/jamanetworkopen.2020.0265
[11] McKinney, S.M., Sieniek, M., Godbole, V., et al. (2020). International evaluation of an AI system for breast cancer screening. Nature, 577(7788): 89-94. https://doi.org/10.1038/s41586-019-1799-6
[12] Kim, H.E., Kim, H.H., Han, B.K., Kim, K.H., Han, K., Nam, H., Lee, E.H., Kim, E.K. (2020). Changes in cancer detection and false-positive recall in mammography using artificial intelligence: A retrospective, multi-reader study. The Lancet Digital Health, 2(3): e138-e148. https://doi.org/10.1016/S2589-7500(20)30003-0
[13] Conant, E.F., Toledano, A.Y., Periaswamy, S., Fortin, S.V., Go, J., Boatsman, J.E., Hoffmeister, J.W. (2019). Improving accuracy and efficiency with concurrent use of artificial intelligence for digital breast tomosynthesis. Radiology: Artificial Intelligence, 1(4): e180096. https://doi.org/10.1148/ryai.2019180096
[14] Yala, A., Lehman, C., Schuster, T., Portnoi, T., Barzilay, R. (2019). A deep learning mammography-based model for improved breast cancer risk prediction. Radiology, 292(1): 60-66. https://doi.org/10.1148/radiol.2019182716
[15] Yala, A., Schuster, T., Miles, R., Barzilay, R., Lehman, C. (2019). A deep learning model to triage screening mammograms: A simulation study. Radiology, 293(1): 38-46. https://doi.org/10.1148/radiol.2019182908
[16] DeSantis, C.E., Bray, F., Ferlay, J., Lortet-Tieulent, J., Anderson, B.O., Jemal, A. (2015). International variation in female breast cancer incidence and mortality rates international variation in female breast cancer rates. Cancer Epidemiology, Biomarkers & Prevention, 24(10): 1495-1506. https://doi.org/10.1158/1055-9965.EPI-15-053
[17] Becker, S. (2015). A historic and scientific review of breast cancer: The next global healthcare challenge. International Journal of Gynecology & Obstetrics, 131(S1): S36-S39. https://doi.org/10.1016/j.ijgo.2015.03.015
[18] Qiu, Y., Wang, Y., Yan, S., Tan, M., Cheng, S., Liu, H., Zheng, B. (2016). An initial investigation on developing a new method to predict short-term breast cancer risk based on deep learning technology. Medical Imaging 2016: Computer-Aided Diagnosis, 9785: 517-522. https://doi.org/10.1117/12.2216275
[19] Han, Z., Wei, B., Zheng, Y., Yin, Y., Li, K., Li, S. (2017). Breast cancer multi-classification from histopathological images with structured deep learning model. Scientific Reports, 7(1): 4172. https://doi.org/10.1038/s41598-017-04075-z
[20] Wei, B., Han, Z., He, X., Yin, Y. (2017). Deep learning model based breast cancer histopathological image classification. In 2017 IEEE 2nd International Conference on Cloud Computing and Big Data Analysis (ICCCBDA), Chengdu, pp. 348-353. https://doi.org/10.1109/ICCCBDA.2017.7951937
[21] Khuriwal, N., Mishra, N. (2018). Breast cancer diagnosis using deep learning algorithm. In 2018 International Conference on Advances in Computing, Communication Control and Networking (ICACCCN), Greater Noida, India, pp. 98-103. https://doi.org/10.1109/ICACCCN.2018.8748777
[22] Cardoso, F., Spence, D., Mertz, S., Corneliussen-James, D., Sabelko, K., Gralow, J., Cardoso, M., Peccatori, F., Paonessa, D., Benares, A., Sakurai, N., Beishon, M., Barker, S., Mayer, M. (2018). Global analysis of advanced/metastatic breast cancer: Decade report (2005–2015). The Breast, 39: 131-138. https://doi.org/10.1016/j.breast.2018.03.002
[23] Toğaçar, M., Ergen, B. (2018). Deep learning approach for classification of breast cancer. In 2018 International Conference on Artificial Intelligence and Data Processing (IDAP), Malatya, Turkey, pp. 1-5. https://doi.org/10.1109/IDAP.2018.8620802
[24] Ismail, N.S., Sovuthy, C. (2019). Breast cancer detection is based on a deep learning technique. In 2019 International UNIMAS STEM 12th Engineering Conference (EnCon), Kuching, Malaysia, pp. 89-92. https://doi.org/10.1109/EnCon.2019.8861256
[25] Zhang, X., Zhang, Y., Zhang, Q., Ren, Y., Qiu, T., Ma, J., Sun, Q. (2019). Extracting comprehensive clinical information for breast cancer using deep learning methods. International Journal of Medical Informatics, 132: 103985. https://doi.org/10.1016/j.ijmedinf.2019.103985
[26] Murtaza, G., Shuib, L., Abdul Wahab, A.W., Mujtaba, G., Mujtaba, G., Nweke, H.F., Al-Garadi, M.A., Zulfiqar, F., Raza, G., Azmi, N.A. (2020). Deep learning-based breast cancer classification through medical imaging modalities: State of the art and research challenges. Artificial Intelligence Review, 53: 1655-1720. https://doi.org/10.1007/s10462-019-09716-5
[27] Jiménez-Gaona, Y., Rodríguez-Álvarez, M.J., Lakshminarayanan, V. (2020). Deep-learning-based computer-aided systems for breast cancer imaging: A critical review. Applied Sciences, 10(22): 8298. https://doi.org/10.3390/app10228298
[28] Saber, A., Sakr, M., Abo-Seida, O.M., Keshk, A., Chen, H. (2021). Using the transfer-learning technique, a novel deep-learning model for automatic detection and classification of breast cancer. IEEE Access, 9: 71194-71209. https://doi.org/10.1109/ACCESS.2021.3079204
[29] Ghosh, P., Azam, S., Hasib, K.M., Karim, A., Jonkman, M., Anwar, A. (2021). A performance based study on deep learning algorithms in the effective prediction of breast cancer. In 2021 International Joint Conference on Neural Networks (IJCNN), Shenzhen, China, pp. 1-8. https://doi.org/10.1109/IJCNN52387.2021.9534293
[30] Liu, T., Huang, J., Liao, T., Pu, R., Liu, S., Peng, Y. (2022). A hybrid deep learning model for predicting human breast cancer molecular subtypes using multimodal data. IRBM, 43(1): 62-74, https://doi.org/10.1016/j.irbm.2020.12.002
[31] Gaber, T., Ismail, G., Anter, A., Soliman, M., Ali, M., Semary, N., Hassanien, A.E., Snasel, V. (2015). Thermogram breast cancer prediction approach based on neutrosophic sets and fuzzy c-means algorithm. In 2015 37th Annual International Conference of the IEEE Engineering in Medicine and Biology Society (EMBC), Milan, pp. 4254-4257. https://doi.org/10.1109/EMBC.2015.7319334
[32] Cabıoğlu, Ç., Oğul, H. (2020). Computer-aided breast cancer diagnosis from thermal images using transfer learning. In Bioinformatics and Biomedical Engineering: 8th International Work-Conference, IWBBIO 2020, Granada, Spain, pp. 716-726. https://doi.org/10.1007/978-3-030-45385-5_64
[33] Milosevic, M., Jankovic, D., Peulic, A. (2014). Thermography-based breast cancer detection uses texture features and minimum variance quantization. EXCLI Journal, 13: 1204-1215.
[34] Dey, N., Rajinikanth, V., Hassanien, A.E. (2021). An examination system to classify the breast thermal images into early/acute DCIS class. In: Ray, K., Roy, K.C., Toshniwal, S.K., Sharma, H., Bandyopadhyay, A. (eds) Proceedings of International Conference on Data Science and Applications. Lecture Notes in Networks and Systems, Springer, Singapore. https://doi.org/10.1007/978-981-15-7561-7_17
[35] Kavitha, T., Mathai, P.P., Karthikeyan, C., Ashok, M., Kohar, R., Avanija, J., Neelakandan, S. (2021). Deep learning-based capsule neural network model for breast cancer diagnosis using mammogram images. Interdisciplinary Sciences: Computational Life Sciences, 14: 113-129. https://doi.org/10.1007/s12539-021-00467-y
[36] Das, A., Mohanty, M.N., Mallick, P.K., Tiwari, P., Muhammad, K., Zhu, H. (2021). Breast cancer detection using an ensemble deep learning method. Biomedical Signal Processing and Control, 70: 103009. https://doi.org/10.1016/j.bspc.2021.103009
[37] Joshi, R.C., Singh, D., Tiwari, V., Dutta, M.K. (2022). An efficient deep neural network-based abnormality detection and multi-class breast tumor classification. Multimedia Tools and Applications, 81(10): 13691-13711. https://doi.org/10.1007/s11042-021-11240-0
[38] Ragab, M., Albukhari, A., Alyami, J., Mansour, R.F. (2022). Ensemble deep-learning-enabled clinical decision support system for breast cancer diagnosis and classification on ultrasound images. Biology, 11(3): 439. https://doi.org/10.3390/biology11030439
[39] Bakator, M., Radosav, D. (2018). Deep learning and medical diagnosis: A review of the literature. Multimodal Technologies and Interaction, 2(3): 47. https://doi.org/10.3390/mti2030047
[40] Latha, R.S., Sreekanth, G.R.R., Suganthe, R.C., Selvaraj, R.E. (2021). A survey on the applications of Deep Neural Networks. In 2021 International Conference on Computer Communication and Informatics (ICCCI), Coimbatore, India, pp. 1-3. https://doi.org/10.1109/ICCCI50826.2021.9457016
[41] Hajipour Khire Masjidi, B., Bahmani, S., Sharifi, F., Peivandi, M., Khosravani, M., Hussein Mohammed, A. (2022). CT-ML: Diagnosis of breast cancer based on ultrasound images and time-dependent feature extraction methods using contourlet transformation and machine learning. Computational Intelligence and Neuroscience, 2022: 1493847. https://doi.org/10.1155/2022/1493847
[42] CBIS-DDSM. https://wiki.cancerimagingarchive.net/pages/viewpage.action?pageId=22516629, accessed on 6 January 2024.
[43] Mohamed, E.A., Rashed, E.A., Gaber, T., Karam, O. (2022). The deep learning model for fully automated breast cancer detection system from thermograms. PloS One, 17(1): e0262349. https://doi.org/10.1371/journal.pone.0262349
[44] Naseem, U., Rashid, J., Ali, L., Kim, J., Haq, Q.E.U., Awan, M.J., Imran, M. (2022). Automatic detection of breast cancer diagnosis and prognosis based on machine learning using an ensemble of classifiers. IEEE Access, 10: 78242-78252. https://doi.org/10.1109/ACCESS.2022.3174599
[45] Wang, L.M., Li, X.L., Cao, C.H., Yuan, S.M. (2006). Combining decision tree and Naive Bayes for classification. Knowledge-Based Systems, 19(7): 511-515. https://doi.org/10.1016/j.knosys.2005.10.013
[46] Masud, M., Eldin Rashed, A.E., Hossain, M.S. (2020). Convolutional neural network-based models for diagnosis of breast cancer. Neural Computing and Applications, 34: 11383-11394. https://doi.org/10.1007/s00521-020-05394-5
[47] Breast Cancer or Not (with 15 ML). https://www.kaggle.com/code/mirichoi0218/classification-breast-cancer-or-not-with-15-ml/input, accessed on 6 January 2024.