Lalitha Kumari Gaddala![]() | Vijaya Kumar Reddy Radha
| Vijaya Kumar Reddy Radha![]() | Srinivasa Rao Buraga
| Srinivasa Rao Buraga![]() | Venkata Lalitha Narla
| Venkata Lalitha Narla![]() | Koteswara Rao Kodepogu*
| Koteswara Rao Kodepogu*![]() | Surekha Yalamanchili
| Surekha Yalamanchili![]()
© 2024 The authors. This article is published by IIETA and is licensed under the CC BY 4.0 license (http://creativecommons.org/licenses/by/4.0/).
OPEN ACCESS
Lung cancer ranks as one of the main sources of death around the world. Because of the absence of symptoms in beginning phase patients, identifying and evaluating affected areas presents a significant challenge. Consequently, the mortality rate associated with lung cancer surpasses that of other lung diseases. Cellular breakdown in the lungs can be ordered into three sorts as Non-Small Cell Lung Cancer (NSCLC), Small Cell Lung Cancer (SCLC), and Carcinoid. Early detection is imperative, as it enables individuals to live longer lives. Computed Tomography (CT) scans are employed to locate tumors and determine the extent of cancer spread within the body. Early conclusion and characterization of cellular breakdown in the lungs are vital for working on a patient's possibilities of endurance, necessitating prompt lung disease detection. Accordingly, numerous machine learning and image processing models have been developed. This work efficiently classifies lung cancer as benign, malignant, or normal using a machine learning-based method for improved accuracy in lung cancer diagnosis on CT scans. The suggested model's accuracy on CT scans is increased by using the Random Forest algorithm to the detection of lung cancer. Metrics for accuracy, precision, sensitivity, and recall are used to assess the effectiveness of the approach that is being given.
lung cancer, machine learning, classification, benign and malignant
Lung cancer, a prevalent malignancy affecting both men and women, is the deadliest cancer type with the highest mortality rate. Early detection of the disease can save numerous lives; however, Lung cancer continues to be the leading cause of melanoma deaths globally. Factors contributing to lung cancer include smoking, environmental pollutants, gender, genetics, age, and exposure to secondhand smoke in both smokers and non-smokers. Lung tumors can manifest as cancerous (malignant) or non-cancerous (benign) growths in lung tissue or airways connected to the lungs [1].
With over 218,500 new cases and 142,000 deaths annually, lung cancer is the primary cause of cancer-related mortality among men and women in the United States. Symptoms for lung cancer can vary among individuals, and when cancer originates in the lungs, the term "primary lung cancer" describes it. While cancer from other organs can also migrate to the lungs, primary lung cancer can metastasis to lymph nodes or other organs, including the brain [2].
Various lung diseases, including Interstitial Lung Disease (ILD), Chronic Obstructive Pulmonary Disease (COPD), and Acute Respiratory Distress Syndrome (ARDS), are associated with significant changes in lung mechanical properties [3]. ILD, a group of severe disorders characterized by fibrosis and stiffening of lung tissue, encompasses over 200 conditions, such as pulmonary fibrosis, pulmonary edema, and pneumonia. Lung cancer, Idiopathic pulmonary fibrosis (IPF), the most often diagnosed malignancy in both men and women, is acknowledged as a public health problem. It is responsible for around 25% of all cancer-related deaths.
Based on the patient's location and the afflicted area, lung cancer is categorised. Factors such as tumor size and location are considered in estimating the severity of the cancer. Lung cancer can be detected by Computed Tomography (CT) scans more accurately than with traditional diagnostic X-rays, and treatment success rates can be increased with early identification [4]. This methodology aids in analyzing the outcomes of chemotherapy, radiotherapy, and surgery, as well as diagnosing cancer in the healthcare industry.
More than 80% of individuals with initial malignancies have non-small cell lung cancer (NSCLC). The two main histological subtypes of non-small cell lung cancer are adenocarcinoma (ADC) and squamous cell carcinoma (SCC). originate from larger and smaller airway epithelia, respectively [5]. In clinical practice, manual tissue categorization using conventional light microscopy is a useful technique for histological segmentation. However, owing to heterogeneity both within and across tumours, a biopsy cannot capture the entire diseased morphologic and phenotypic pattern. It might be challenging to detect squamous cell carcinoma, a malignant epithelial tumour with squamous differentiation and/or keratinization. pathologically due to subtle morphological differences between various types of lung cancer [6].
Lung disorders pose a significant concern, particularly in low- and middle-income countries where air pollution and poverty afflict millions of people. According to estimates from the World Health Organization, illnesses like pneumonia and asthma brought on by indoor air pollution account for almost 4 million preventable deaths each year. Consequently, it is crucial to implement effective diagnostic methods that aid in detecting lung disorders [7].
Malignant tumors are pathologically diagnosed using a computerized process called computer-aided diagnosis (CAD), a type of artificial intelligence (AI) that combines analysis and computing with physiological and biochemical methods, as well as medical image processing tools. AI can help medical practitioners make clinical decisions by translating subjective, qualitative visual data into objective, quantitative data.
Computer-Aided Detection (CADe) methods have been developed by several research organizations to assist radiologists in accurately locating nodules. Early identification of malignant nodules is one of the primary problems in the creation of CADe systems. Which may be as small as 3 mm to 30 mm in size? Clinical studies indicate that early detection significantly improves lung cancer mortality rates.
Machine Learning (ML) methods have proven successful in dividing up neural structures and locating areas that contain nodules. The network combines relatively low features to create predictions, use higher-level characteristics from later layers in early levels. In addition, Computer-Aided Diagnosis (CAD) systems often use machine learning methods to identify and categorise lung cancer. Machine Learning approaches are typically chosen for their faster, more accurate results while requiring fewer computational resources.
This research proposes an improved accuracy method for lung cancer diagnosis on CT scans using machine learning. Section II provides an overview of the literature review on various lung cancer detection and classification methods. The machine learning classification of lung cancer diagnosis and enhanced accuracy on CT images is introduced in Section III. A case study of the examination of lung cancer detection data is presented in Section IV. Lastly, Section V brings the paper to a close.
Elnakib et al. [8] have enhanced deep learning methods for the earlier detection of lung cancer. One such method involves using Computer-Aided Detection (CADe) during Low-Dose Computed Tomography (LDCT) imaging to swiftly identify lung nodules. To improve the contrast of the low-dose images, the method initially preprocesses the raw data. A Genetic Algorithm (GA) is then employed to select the most significant features for improved automatic recognition, optimizing the characteristics chosen from the data sets. Finally, additional categories are established to provide a comprehensive characterization of lung nodules. The method was evaluated using 320 LDCT images from 50 different patients, with data sourced from an online public lung dataset.
Yuan et al. [9] provided an analysis of lung cancer subtype gene expression profiles using machine learning techniques. They investigated the gene expression patterns of lung adenocarcinoma (AC) and squamous cell carcinoma (SCC) using a variety of machine learning approaches, with data collected from the Gene Expression Omnibus. The classification rules were developed using a rule-learning algorithm based on informative features.
Banerjee and Das [10] offered a machine learning perspective on lung cancer prediction. They proposed a framework for early cancer prediction, aiming to save lives at risk. The framework focuses on two main areas of computer science: Digital Image Processing (DIP) and Machine Learning (ML). It highlights the importance of the preprocessing stage in DIP and details how ML contributes to predicting lung cancer with precision.
Mukherjee and Bohra [11] discussed a machine learning approach designed for lung cancer disease diagnosis. They established a framework based on Artificial Intelligence (AI) and Deep Neural Networks (DNN). The process utilizes supervised learning (SL), foregoing deep learning techniques, which has led to increased accuracy. The framework employs a Convolutional Neural Network (CNN) classification strategy for categorizing lung tumors. It encompasses several steps, including image acquisition, preprocessing, feature enhancement, classification, feature extraction, and the identification of neural conceptual models.
Deep learning is described in detail in Sreekumar et al.'s [12] explanation of how to locate malignant lung nodules. The portions of the photos' lungs were blacked out using a pre-processing technique. A 3D CNN (Three-Dimensional Convolutional Network) model created after that the properties were extracted using the C3D network architecture. The outcome is a model that uses CT scan data to forecast the locations of malignant lung nodules and identify surrounding regions. The resultant method predicted the malignancy ratings of 50 distinct individuals and showed an 86 percent sensitivity for identifying malignant lung nodules.
Machine learning approach is presented by Yu et al. [13] and uses feature analysis of CT images for the detection of non-small cell lung cancer pathological phase. We examined the precision-recall curve, Average Precision (AP) score, and classification accuracy to determine how well the predictions model performed on the training and testing sets. The model's prediction accuracy was assessed using samples of lung squamous cell carcinoma (LUSC) and lung adenocarcinoma (LUAD) from the TCGA database.
Pham et al. [14] proposed that it is feasible to recognise lung cancer original tumour metastases, including whole histopathology pictures, using just a two-phase deep learning methodology. This method is used to create a comprehensive two-stage deep learning system that addresses false positive prediction issues while preserving the accuracy of cancer detection. Lung cancer lymph node pictures were collected on 349 complete slides in total, with 233 slides used to run the algorithm, 10 slides for verification, and 106 slides for assessments.
Vaishnavi et al. [15] proposed the identification of lung cancer utilizing ML is presented. To improve accuracy, yield, and speed up diagnosis, one automatic lung cancer detection method has been introduced in this analysis. The tissues have to be separated into three groups: benign, malignant, and normal. The following phases of the diagnosis technique include pre-processing, extraction of features from CT images, extraction and classification from Probabilistic Neural Networks (PNN) and categorization of the CT images. PNN was utilized to categorize normal and abnormal in the last phase.
Ahmed et al. [16] presented the categorization of lung cancer using supervised learning and data mining techniques on a multidimensional data set. Using patient photos, they segmented possibly cancerous lesions using a classifier. To minimize false positives, a straightforward approach stores nodule detections only if they are found in the slice using data mining. Surprisingly, this technique examined three alternative ways to encode the patches and discovered that utilising the raw pixels produced better results than using more sophisticated techniques like autoencoders and local binary sequences.
Singh and Gupta [17] examined the effectiveness of several ML-based methods for identifying and categorising lung cancer among humans. The proposed method initially applies image processing methods to these photos before classifying them with supervised learning algorithms. Based on the data, the MLP classifier has an accuracy rate of 88.55%, which is greater than the other classifiers.
Machine learning can be used to improve the identification of lung lesions in low dose positron emission tomography images, according to Nai et al. [18]. They investigate if it is feasible to enhance lesion diagnosis during low-dose PET scans by transforming low-dose PET pictures to normal dosage, high-quality images using machine learning. They use IQT, a ML technique, to translate parameters from subpar to exceptional photos using patch-regression. The quality or resolution of the information has improved. Lesion identification and picture quality have improved when low dose images have been analysed using IQT.
Deep learned characteristics on a sparse population’s dataset are used to characterize lung cancer categorization [19]. This method proposes a deep auto encoder classification technique that first acquires deep features before instructing an Artificial Neural Network using these acquired characteristics. Whenever trained with all characteristics and the identical training data, the deep learned classification exceeds all other classifications.
Hua et al. [20] on computed tomography scans, lung nodules can be classified with the aid of a computer using a deep learning technique. Using Deep Learning approaches, the authors tried to optimize the typical CAD image analysis workflow. They presented frameworks of a deep learning model and a CNN particularly for the categorization of nodules in computed tomography pictures.
Several authors have been presented various techniques to classify the lung cancer disease, however those are cost effective, time consuming and in accurate. To overcome these issues an accurate lung cancer classification approach is essential in order to save the life of a patient.
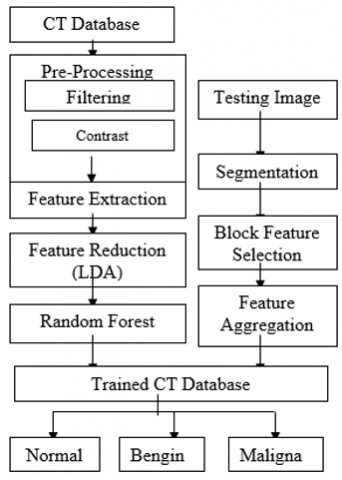
This method talks about enhancing accuracy on CT images and classifying lung cancer using machine learning. The block diagram of the system is shown in Figure 1.
A substantial dataset of CT images has been made available to the public by the NIH Clinical Center, which will aid the research establishment in enhancing the precision of lesion detection. While the majority of publicly accessible medical image collections only contain a few hundred lesions, The DeepLesion collection includes over 32,000 CT scans with lesions labelled. The pictures, that have been completely anonymized, represent 4,400 distinct patients who are NIH study partners.
Figure 1. The block diagram of presented approach
The gathered medical database photos are tainted with various types of noise. If a picture is noisy and the target pixels nearby pixels have values between 0 and 255, the middle value should be used in place of the target pixels recognize. When removing noise from the databases, this visibility restoration method is known as adaptive histogram equalization. As in Eq. (1).
contrast $(i, j)=$ rank $*$ max_intensity $(i, j)$ (1)
Rank=0 is initially. This histogram at the designated point for every row is now derived by eliminating the following column along with the new leading and utilizing the base location of the previous row. The diversity of CT scans has to be raised and the limit established, so that it can recognize them, the grey level of the image and independently modify the dispersion of the two surrounding grey levels in the updated histogram.
The feature extraction method's goal is to represent the picture as a collection of unique, compressed single variables or a matrix vector. Feature extraction determines which image can be used for classification when computing dimensionality reduction in image processing. It includes compressing the input data into a streamlined set of feature-based representations. The characteristics are used as input to classifications, which assign these to the category that they describe. By estimating positive qualities, feature extraction aims to minimize the amount of data. The current method uses three different types of components that are extracted from different bands of CT images: wavelet features, texture features, and histogram features.
LDA (Linear Discriminant Analysis) is used to reduce the initial informational collection by calculating the precise qualities or properties that distinguish one performance measurement from another. All of CT's negative characteristics are to be combined in order to lower the features. LDA is a feature extraction technique that converts the initial input space into a feature space that is independent and has additional incompressible dimensions. The feature reduction matrix is as follows in the Eq. (2):
$M_w=\sum_{j-1}^c \sum_{i-1}^{N S}\left|\left(m_i^j-\alpha_j\right)\left(m_i^j-\alpha_j\right)^T\right|$ (2)
where, c signifies the number of classes and mj, Ns, and αj are a class test, the number of tests in the class, and the signification of the class. The equation is used to compute the reducing matrix as shown in the Eq. (3):
$R_s=\sum_{j-1}^k\left(m_j-m\right)\left(m_j-m\right)^T$ (3)
The direct discriminant hypothesis is used to apply LDA techniques, and m is the mean of all the classes.
The widely used supervised learning approach includes the Random Forest machine learning algorithm. Both regression and classification problems in machine learning can benefit from this. This is predicated on the concept of ensemble learning, which delineates the process of amalgamating many categories to address a complex problem and augment the efficacy of the system.
Random Forest, as its name implies, is a classifier that improves a dataset's prediction accuracy by aggregating the results of many decision trees applied to various dataset subsets. Because random forests integrate several decision trees and avoid overfitting, they offer greater predictive performance and resilience than individual decision trees. This leads to an overall increase in accuracy. While a random forest mixes several decision trees, a decision tree only combines certain decisions. As such, it is a laborious and drawn-out procedure. On the other hand, a decision tree—especially a linear one—operates quickly and effortlessly on big data sets. Thorough training is required for the random forest model.
SVM may be computationally costly, particularly when handling big datasets. Long training times may occur, and the technique might not perform well with very big datasets. Lack of transparency: SVM models, particularly in high-dimensional domains, can be challenging to read and comprehend. Compared to other classifiers, KNN requires more memory and data storage because to its slow method. Both in terms of money and effort, this may be expensive. Businesses will spend more on memory and storage, and processing larger amounts of data may take longer.
A random forest classifies the outcomes based on the majority of votes from the projections, including estimates from each decision tree rather than relying just on one.
The following hyper parameters define a typical random forest: the number of features taken into consideration for splitting, the number of estimators, the maximum depth, the minimum number of samples in a leaf, and the maximum number of features.
However, during the testing phase, the classification system results show if the images contain spots for lung cancer or healthy tissue.
The threshold is extracted from the original image using a spatial image clustering algorithm. It can be set up as a pixel of a particular area, then the split-screen adaptive threshold strategy can perform offensive measures. It is examined for threshold segmentation and dark level because of its steep surface slope. The input image is initially read into this system's pre-processed image during the segmentation method, and the image is then taken to the variable 'Q,' where it is given as follows in the Eq. (4).
$Q=\operatorname{Im} \operatorname{resize}(Q[512$ 512] $)$ (4)
The idea to match a low refractive CT image plane to the image data region comes next. similar to Eq. (5).
$f(x, y, a, m)=\sum_{i+j \leq m} a_{i j} x^i y^j$ (5)
If the mistake is minor and stated as, it can be concluded that the pixel values correspond to the same location as in Eq. (6):
$E(R, a, m)=\sum_{(X, Y) \in R}\left[g(x, y)-f(x, y, a, m)^2\right]$ (6)
Plot the contrast among lung image clusters according to their centroid H-space now. Both projections matrix and projection matrix covering the joint are present in the following slice, which is a random beginning slice as in Eq. (7):
Background $=I M$ open $(I$, strel,$(' d i s k ', 100))$ (7)
This system adjusts the image background value where ‘i’ is the variable. The approach can increase the identification of the lung region according to analysis of connected components. This procedure should be repeated for every pixel. The four blocks around an unmarked pixel are examined for a local minimum. Up until every single pixel in the image has been separated, this process is repeated.
Feature selection is a technique for converting an input parameter to a representation by using only important information and removing unnecessary information. To get each pixel, repeat this process. The four blocks around an unmarked pixel are examined for a local minimum. Up until every single pixel in the image has been separated, this process is repeated.
Using statistical techniques, aggregating features allows you to group them into logical groups. For the purposes of exploration and analysis, ArcGIS Pro provides the viewing of aggregated data. For a feature or group of related features, one can aggregate several records (observations) or multiple features. Any machine learning model can contain one of two primary types of faults. Errors can be classified as either reducible or irreducible. Irreducible mistakes are those whose values cannot be lowered and which, due to unknown factors, will always exist in a machine learning model.
In particular, categorization involves two stages: training and testing. The classification was performed using the training data’s specified characteristics. However, throughout the testing stage, the classification method findings reveal whether the photos contained lung cancer sections or non-cancerous sections. Depending on the features gathered, CT lung scans are generally considered acceptable, benign, or malignant during the classification process.
This method uses Python to apply machine learning for lung cancer detection categorization and to improve accuracy on CT images. The examination of the offered approach's results is demonstrated in this section. Presented approach classifies lung cancer as benign, malignant, or normal using a Random Forest (RF) classifier. The given technique's performance is assessed using the True Positive (TP), True Negative (TN), False Positive (FP), and False Negative (FN) confusion matrix metrics.
True Positive (TP): In the event that a particular case is accurately classified as positive and truly.
True Negative (TN): When a circumstance is properly and unquestionably labelled as negative.
False Positive (FP): When a state is mistakenly labelled as positive when it is truly negative.
False Negative (FN): If a situation is falsely classified as being bad when it is actually positive.
All the measuring parameters can be seen the Eqs. (8)-(11).
Accuracy: It is supplied as, and it is defined as the ratio of properly detected occurrences to all instances.
Accuracy $=\frac{T P+T N}{T P+F P+T N+F N} \times 100$ (8)
Sensitivity: The ratio of genuine positive cases to real positive instances is known as the genuine Positive Rate (TPR), and it is commonly used in discussions.
Sensitivity $=\frac{T P}{T P+F N} \times 100$ (9)
Precision: The proportion of all-positive forecasts (TP+FP) to total predictions (TPs) is used to calculate precision.
Precision $=\frac{T P}{(T P+F P)} \times 100$ (10)
F1 - Score: When there is an uneven distribution of classes and a need to strike a balance between precision and sensitivity, it becomes necessary.
$F 1-$ Score $=2 \times \frac{\text { Precision } * \text { sensitivity }}{\text { Precision }+ \text { sensitivity }} \times 100$ (11)
The Table 1 describes the performance evaluation of presented and Naive Bayes based classification of lung cancer detection.
Table 1. Performance metrics evaluation
|
Performance Metrics |
NB Classification Approach |
Presented Classification Approach (Random Forest Classifier) |
|
Sensitivity (%) |
86.7 |
94.8 |
|
Precision (%) |
87.6 |
95.2 |
|
F1-score (%) |
85.4 |
95 |
|
Accuracy (%) |
88.5 |
96.4 |
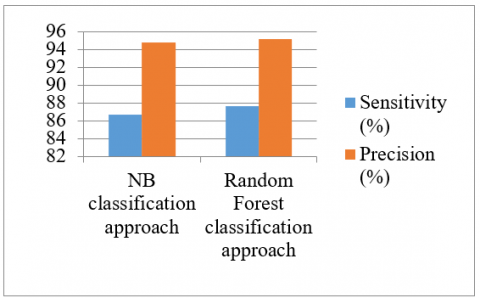
The performance of presented ML classification approach is compared with naïve bayes classifier. In comparison to the other classifiers, the Random Forest classifier performs better in terms of F1-score, accuracy, sensitivity, and precision. The comparison of sensitivity and accuracy between the given technique and other naïve bayes classification approaches is depicted in Figure 2. The given and NB classification strategy is represented by the x-axis, while the y-axis shows the sensitivity and specificity expressed as a percentage.
The naïve bayes classifier has 86.7% sensitivity and 86.7% precision whereas RF classifier has 94.8% sensitivity and 95.2% precision.
Figure 2. Sensitivity and precision comparison for presented and NB classification approaches
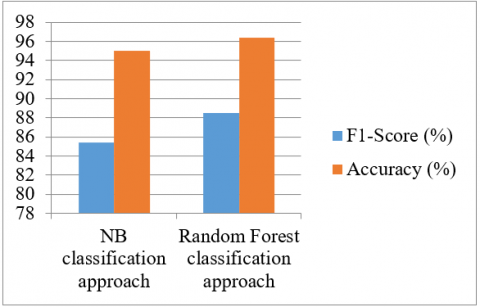
The Figure 3 shows the accuracy and F1-score comparison for presented earlier NB classification approach. The NB classifier has less accuracy and F1-score than RF classifier.
Figure 3. Accuracy and f1-score comparison for naïve bayes and presented classification approaches
Hence presented ML classification of lung cancer detection and improving accuracy on CT images has effectively classified the lung cancer as normal, benign and malignant. The presented classification approach has better accuracy than earlier naïve bayes classification approach.
This method presents a machine learning classification for lung cancer diagnosis that enhances the precision of CT scans. The Random Forest algorithm is utilized in this technique to improve the accuracy of the developed model on CT scans and to identify lung cancer. A publicly available CT dataset is used in this approach for lung cancer classification. The approach has effectively classified lung cancer as normal, benign, and malignant. The F1-score, accuracy, sensitivity, and precision are used to assess the effectiveness of the given approach. The performance of the presented approach is compared with an earlier Naïve Bayes classification method. Compared to the Naïve Bayes approach, the presented method demonstrates better accuracy, precision, F1-score, and sensitivity. In the future, advanced techniques will be employed to provide accurate diagnoses based on lung disease classification and patient health conditions.
[1] Salama, W.M., Shokry, A., Aly, M.H. (2022). A generalized framework for lung cancer classification based on deep generative models. Multimedia Tools and Applications, 81(23): 32705-32722. https://doi.org/10.1007/s11042-022-13005-9
[2] Ito, Y., Nakajima, T., Inage, T., Otsuka, T., Sata, Y., Tanaka, K., Sakairi, Y., Suzuki, H., Yoshino, I. (2022). Prediction of nodal metastasis in lung cancer using deep learning of endobronchial ultrasound images. Cancers, 14(14): 3334. https://doi.org/10.3390/cancers14143334
[3] Kavithaa, G., Balakrishnan, P., Yuvaraj, S.A. (2021). Lung cancer detection and improving accuracy using linear subspace image classification algorithm. Interdisciplinary Sciences: Computational Life Sciences, 13: 779-786. https://doi.org/10.1007/s12539-021-00468-x
[4] Chaunzwa, T.L., Hosny, A., Xu, Y., Shafer, A., Diao, N., Lanuti, M., Christiani, D.C., Mak, R.H., Aerts, H.J. (2021). Deep learning classification of lung cancer histology using CT images. Scientific Reports, 11(1): 1-12. https://doi.org/10.1038/s41598-021-84630-x
[5] Chen, C.L., Chen, C.C., Yu, W.H., Chen, S.H., Chang, Y.C., Hsu, T.I., Hsiao, M., Yeh, C., Chen, C.Y. (2021). An annotation-free whole-slide training approach to pathological classification of lung cancer types using deep learning. Nature Communications, 12(1): 1193. https://doi.org/10.1038/s41467-021-21467-y
[6] Bharati, S., Podder, P., Mondal, M.R.H. (2020). Hybrid deep learning for detecting lung diseases from X-ray images. Informatics in Medicine Unlocked, 20: 100391. https://doi.org/10.1016/j.imu.2020.100391
[7] Cong, L., Feng, W., Yao, Z., Zhou, X., Xiao, W. (2020). Deep learning model as a new trend in computer-aided diagnosis of tumor pathology for lung cancer. Journal of Cancer, 11(12): 3615-3622. https://doi.org/10.7150/jca.43268
[8] Elnakib, A., Amer, H.M., Abou-Chadi, F.E. (2020). Early lung cancer detection using deep learning optimization. International Association of Online Engineering.
[9] Yuan, F., Lu, L., Zou, Q. (2020). Analysis of gene expression profiles of lung cancer subtypes with machine learning algorithms. Biochimica et Biophysica Acta (BBA)-Molecular Basis of Disease, 1866(8): 165822. https://doi.org/10.1016/j.bbadis.2020.165822
[10] Banerjee, N., Das, S. (2020). Prediction lung cancer–in machine learning perspective. In 2020 International Conference on Computer Science, Engineering and Applications (ICCSEA), Gunupur, India, pp. 1-5. https://doi.org/10.1109/ICCSEA49143.2020.9132913
[11] Mukherjee, S., Bohra, S.U. (2020). Lung cancer disease diagnosis using machine learning approach. In 2020 3rd International Conference on Intelligent Sustainable Systems (ICISS), Thoothukudi, India, pp. 207-211. https://doi.org/10.1109/iciss49785.2020.9315909
[12] Sreekumar, A., Nair, K.R., Sudheer, S., Nayar, H.G., Nair, J.J. (2020). Malignant lung nodule detection using deep learning. In 2020 International Conference on Communication and Signal Processing (ICCSP), Chennai, India, pp. 0209-0212. https://doi.org/10.1109/iccsp48568.2020.9182258
[13] Yu, L., Tao, G., Zhu, L., Wang, G., Li, Z., Ye, J., Chen, Q. (2019). Prediction of pathologic stage in non-small cell lung cancer using machine learning algorithm based on CT image feature analysis. BMC Cancer, 19(1): 1-12. https://doi.org/10.1186/s12885-019-5646-9
[14] Pham, H.H.N., Futakuchi, M., Bychkov, A., Furukawa, T., Kuroda, K., Fukuoka, J. (2019). Detection of lung cancer lymph node metastases from whole-slide histopathologic images using a two-step deep learning approach. The American Journal of Pathology, 189(12): 2428-2439. https://doi.org/10.1016/j.ajpath.2019.08.014
[15] Vaishnavi, D., Arya, K.S., Devi Abirami, T., Kavitha, M.N. (2019). Lung cancer detection using machine learning. International Journal of Engineering Research & Technology (IJERT), 7(1).
[16] Ahmed, S.R.A., Al-Barazanchi, I., Mhana, A., Abdulshaheed, H.R. (2019). Lung cancer classification using data mining and supervised learning algorithms on multi-dimensional data set. Periodicals of Engineering and Natural Sciences, 7(2): 438-447. https://doi.org/10.21533/pen.v7i2.483
[17] Singh, G.A.P., Gupta, P.K. (2019). Performance analysis of various machine learning-based approaches for detection and classification of lung cancer in humans. Neural Computing and Applications, 31: 6863-6877. https://doi.org/10.1007/s00521-018-3518-x
[18] Nai, Y., Schaefferkoetter, J.D., Fakhry-Darian, D., Conti, M., Shi, X., Townsend, D.W., Sinha, A.K., Tham, I., Alexander, D.C., Reilhac, A. (2018). Improving lung lesion detection in low dose positron emission tomography images using machine learning. In 2018 IEEE Nuclear Science Symposium and Medical Imaging Conference Proceedings (NSS/MIC), Sydney, NSW, Australia, pp. 1-3. https://doi.org/10.1109/NSSMIC.2018.8824292
[19] Salaken, S.M., Khosravi, A., Khatami, A., Nahavandi, S., Hosen, M.A. (2017). Lung cancer classification using deep learned features on low population dataset. In 2017 IEEE 30th Canadian Conference on Electrical and Computer Engineering (CCECE), Windsor, ON, Canada, pp. 1-5. https://doi.org/10.1109/CCECE.2017.7946700
[20] Hua, K.L., Hsu, C.H., Hidayati, S.C., Cheng, W.H., Chen, Y.J. (2015). Computer-aided classification of lung nodules on computed tomography images via deep learning technique. OncoTargets and Therapy, 2015-2022. https://doi.org/10.2147/OTT.S80733