Ahmed Elaraby*![]() | Abdulaziz AlMohimeed
| Abdulaziz AlMohimeed![]() | Redhwan M. A. Saad
| Redhwan M. A. Saad![]()
© 2024 The authors. This article is published by IIETA and is licensed under the CC BY 4.0 license (http://creativecommons.org/licenses/by/4.0/).
OPEN ACCESS
The segmentation of liver images from computed tomography (CT) scans is a pivotal technique that supports various medical applications, including computer-aided diagnostics, disease identification, and the evaluation of hepatic function. In this study, an advanced segmentation method for CT liver images is introduced, leveraging the synergy between Rényi entropy and fuzzy c-partition methodologies. The proposed approach commences with the enhancement of input CT images employing an adaptive histogram equalization technique, thereby improving the contrast of hepatic tissues. Subsequently, these images are transformed into the fuzzy domain, wherein the entropies of the hepatic object and the surrounding tissue are meticulously defined. The optimization of the Rényi entropy measure is adeptly carried out using the Differential Evolution (DE) algorithm, which establishes precise CT image thresholds for segmentation. The efficacy of the proposed framework is substantiated through extensive experiments, which reveal its superior performance in segmenting liver CT images against complex backgrounds. The results affirm the framework's proficiency, particularly in medical imaging contexts with intricate backdrops, thereby underscoring its potential for enhanced diagnosis and therapeutic planning.
segmentation, liver CT, threshold, fuzzy Rényi entropy, differential evolution
Analyzing medical images is a meticulous and time-intensive process that requires the utmost care and professionalism from specialists, as well as a significant time investment. In many instances, a prompt and accurate diagnosis can substantially facilitate and accelerate a patient's recovery. The analysis of medical images is the primary method for diagnosing liver cancer. At the current stage in oncology, specialists rely on the results of various radiological studies to establish an objective response of the tumor to a given treatment. The most common radiological method for assessing liver treatment outcomes, such as metastases, is X-ray CT. Image segmentation is a critical stage in the image processing workflow that addresses diagnostic challenges. Several methods are employed to segment liver images; these can be categorized into three main groups: classical computer vision methods, machine learning methods, and neural networks [1].
Image segmentation is the process of dividing a digital image into multiple sections or groups of pixels that share common features, such as texture, intensity, or color. This division is typically based on the type of tissue and anatomical structure present. Segmentation results in a collection of areas that, together, encompass the entire image, as well as a series of contours derived from these areas. Due to the lack of a specific and universally accepted definition of the segmentation problem, it is widely regarded as an open challenge [2]. Numerous approaches to medical image segmentation have been proposed in the literature, each with its own strengths and limitations. We review various techniques and approaches for image segmentation, including classical computer vision methods, machine learning methods, neural networks, and techniques based on active contours and level set functions.
In the literature, segmentation approaches and active contour models have been introduced for the automatic extraction of tumors from MRI scans [3, 4]. A segmentation method based on quantum entanglement has been proposed for imaging brain tumors [5]. The quantum-inspired computing approach was introduced to segment cell colonies, alongside a secure quantum model, which uses a two-qubit system for the classification and segmentation of brain tumors [6, 7]. Furthermore, an enhanced region-growing algorithm has been proposed, which automatically initializes the seed point and employs a thresholding technique to separate the skull from each input brain scan [8]. The features of the training set significantly influence the results of machine learning-based segmentation methods [9, 10]. Methods relying on a priori models [11] and probabilistic atlases [12] encounter several issues, as they require labor-intensive early stages of model development, including sample collection, classification, and manual segmentation. Although these techniques are typically effective and straightforward, they often perform poorly when processing non-standard images or incur large computational costs. Active contour and level set function-based techniques offer more flexibility and are not as constrained by these issues. It has been demonstrated that level set function-based segmentation techniques can reduce the complexity of the segmentation [13, 14]. The primary challenge in their development is formulating an appropriate velocity function and its parameters. The adoption of the level set function for the numerical modeling of patient organ image segmentation, based on tomographic examination results, has been considered [15]. Factors such as the curvature of the segmented sections, the intensity distribution, or the image structure greatly influence segmentation. Level set function-based approaches are notable for their adaptability to the original image's parameters, which simplifies the management of the segmentation process for medical scans.
The objective of this study is to create an algorithm that can accurately segment human liver images obtained from CT scans, utilizing fuzzy-Rényi entropy enhancement through multi-level optimization boosted by DE [16]. The results presented demonstrate the potential for segmenting liver neoplasms comparably to other existing methods. This paper illustrates the applicability of our approach to the problem of neoplasm segmentation. We analyze the quality of our approach and perform optimization to improve the execution speed. The proposed post-processing algorithm enables a sixfold increase in segmentation speed with only a minimal reduction in quality. Additionally, by implementing an extra class division, we are able to significantly enhance the quality, achieving accuracy on par with that reported in similar studies.
In recent years, image processing literature has given a lot of attention to threshold approaches based on entropy. Moreover, they have been found to be one of the most effective methods for image segmentation. Entropy Thresholding methods exploit the information content of an image to determine an optimal threshold. The entropy of an image is calculated by measuring the distribution of pixel intensities. A higher entropy value indicates greater uncertainty or complexity in the image. By considering the entropy of an image, thresholding algorithms can adaptively determine an optimal threshold value that effectively separates objects from the background. This approach is particularly valuable in scenarios where the image contains varying levels of noise, illumination, or complex foreground and background structures. Entropy-based thresholding methods have been widely applied in various image processing tasks. They offer a robust and automated approach for threshold selection, eliminating the need for manual tuning and improving the accuracy and efficiency of image analysis. In summary, entropy-based thresholding methods leverage the concept of entropy to determine an optimal threshold value for image segmentation. By considering the information content of an image, these methods provide a reliable and adaptive approach for object separation and analysis in diverse image processing applications. Previous study utilized entropies based on approaches got a good result in medical images analysis and based on the performance of Rényi entropy with other entropy measures, we utilized in the proposed framework for image segmentation task [17-19].
In literature of Gray [20] Shannon entropy is defined as:
$S(p)=-\sum_{i=1}^k p_i \ln p_i$ (1)
Shannon entropy has the extensive property (additively) $\text{S(A+B)}=\text{S(A)}+\text{S(B)}$ this formalization has been demonstrated to be limited to the Boltzmann-Gibbs-Shannon (BGS) statistics. Rényi entropy successfully expanded Shannon entropy into a continuous set of entropy measures [21]. The Rényi entropy measure, characterized by order $\alpha$, is applied to evaluate the entropy of an image.
Rényi entropy is defined as:
$\mathrm{H}_\alpha(\mathrm{P})=\frac{1}{1-\alpha}\left(\ln \sum_{\mathrm{i}=1}^{\mathrm{k}} \mathrm{p}_{\mathrm{i}}^\alpha\right)$ (2)
The definition of Rényi entropy of order $\alpha$ is applied to each distribution as follows:
$\begin{aligned}
\mathrm{H}_\alpha^{\mathrm{X}}(\mathrm{t}) & =\frac{1}{1-\alpha}\left(\ln \sum_{\mathrm{i}=1}^{\mathrm{t}}\left(\frac{\mathrm{p}_{\mathrm{i}}}{\mathrm{P}_{\mathrm{X}}}\right)^\alpha\right) ,\\
\mathrm{H}_\alpha^{\mathrm{Y}}(\mathrm{t}) & =\frac{1}{1-\alpha}\left(\ln \sum_{\mathrm{i}=\mathrm{t}+1}^{\mathrm{k}}\left(\frac{\mathrm{p}_{\mathrm{i}}}{\mathrm{P}_{\mathrm{Y}}}\right)^\alpha\right)
\end{aligned}$ (3)
The value of $\mathrm{H}_\alpha(\mathrm{t})$ in relation to the threshold t for the foreground and background is dependent on parameters. The optimal threshold value, which maximizes $\mathrm{H}_\alpha(\mathrm{t})$ corresponds to the brightness level t that achieves this maximum.
$\left.\mathrm{t}^*(\alpha)=\operatorname{Arg} \max \left[\mathrm{H}_\alpha^{\mathrm{X}}(\mathrm{t})+\mathrm{H}_\alpha^{\mathrm{Y}}(\mathrm{t})\right)\right]$. (4)
The mathematical expressions in Eqs. (1)-(4) is to select threshold based on Rényi entropy.
The combination of Rényi entropy and fuzzy c-partition can be defined as following:
Classical set A can be described as follows in the fuzzy domain:
$A=\left\{\left(x, \mu_A(x) \mid x \in X\right)\right\}$ (5)
where, $0 \leq \mu_A(x) \leq 1$ and $\mu_A(x)$ is called the membership function.
In order to simplicity, this study estimates the membership of $n$ divided regions using a trapezoidal membership function, $\mu_1, \mu_2, \ldots, \mu_n$ by using $2 \times(n-1)$ unknown fuzzy parameters, namely $a_1, c_1, \ldots a_{n-1}, c_{n-1}$ where $0 \leq a_1 \leq c_1 \leq \cdots \leq$ $a_{n-1} \leq c_{n-1} \leq L-1$.
The following membership function can therefore be derived for the $n$ level threshold.
$\mu_1(k)=\left\{\begin{array}{cl}1 & k \leq a_1 \\ \frac{k-c_1}{a_1-c_1} & a_1 \leq k \leq c_1 \\ 0 & k>c_1 \\ & \vdots\end{array}\right.$ (6)
$\mu_{n-1}(k)=\left\{\begin{array}{cl}0 & k \leq a_{n-2} \\ \frac{k-a_{n-2}}{c_{n-2}-a_{n-2}} & a_{n-2} \leq k \leq c_{n-2} \\ 1 & c_{n-2} \leq k \leq a_{n-2} \\ \frac{k-c_{n-1}}{a_{n-1}-c_{n-1}} & a_{n-1} \leq k \leq c_{n-1} \\ 0 & k>c_{n-1}\end{array}\right.$ (7)
$\mu_n(k)=\left\{\begin{array}{cc}1 & k \leq a_{n-1} \\ \frac{k-a_n}{c_n-a_n} & a_{n-1} \leq k \leq c_{n-1} \\ 1 & k>c_{n-1}\end{array}\right.$ (8)
For each segment of the n-level segments, the maximum fuzzy Rényi entropy can be defined as:
$\mathrm{H}_1^\alpha(\mathrm{p})=\frac{1}{1-\alpha}\left(\ln \sum_{\mathrm{i}=0}^{\mathrm{t}_1}\left(\frac{p_i}{P_1}\right)^\alpha\right)$ (9)
$\mathrm{H}_2^\alpha(\mathrm{p})=\frac{1}{1-\alpha}\left(\ln \sum_{\mathrm{i}=\mathrm{t} 1+1}^{\mathrm{t}_{\mathrm{n}}}\left(\frac{p_i}{P_n}\right)^\alpha\right)$ (10)
$\mathrm{H}_{\mathrm{n}}^\alpha(\mathrm{p})=\frac{1}{1-\alpha}\left(\ln \sum_{\mathrm{i}=\mathrm{t}_{\mathrm{n}-1}+1}^{\mathrm{L}-1}\left(\frac{p_i}{P_n}\right)^\alpha\right)$ (11)
where, $\quad\alpha\neq1,\quad P_1=\sum_{i=0}^{\mathrm{t}_1} p_i *\mu_1(i), P_2=\sum_{i=0}^{\mathrm{t}_2} p_i *$$\mu_2(i),\cdots,P_n=\sum_{i=0}^{L-1} p_i*\mu_n(i)$.
The optimal values of the parameters can be obtained by maximizing the overall entropy.
$\begin{gathered}\varphi\left(a_1, c_1, \ldots a_{n-1}, c_{n-1}\right) ={Arg\, Max}\left(\left[H_1(t)+H_2(t)+\cdots+H_n(t)\right]\right)\end{gathered}$ (12)
The following is how the (n-1) threshold values can be obtained using fuzzy parameters:
$t_1=\frac{\left(a_1+c_1\right)}{2}, t_2=\frac{\left(a_2+c_2\right)}{2}, \ldots, t_{n-1}=\frac{\left(a_{n-1}+c_{n-1}\right)}{2}$ (13)
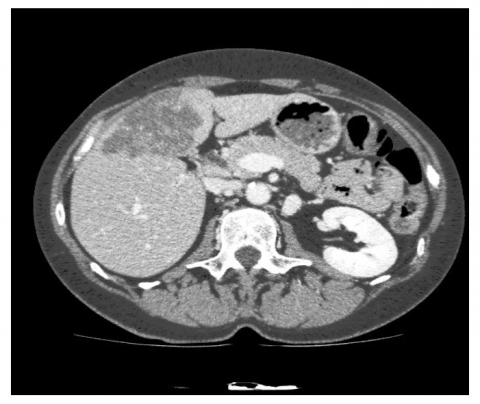
The experiments performed using MATLAB R2018$\mathrm{a}$. Various CT liver images are examined. In our experiment, to accentuate the features of the liver using an algorithm, we are using enhancement phase to increase the contrast of the liver CT presented in the research paper [22].
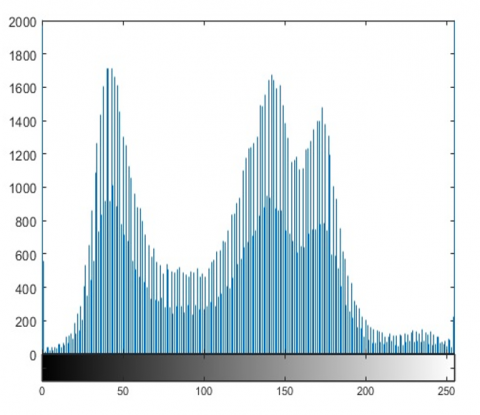
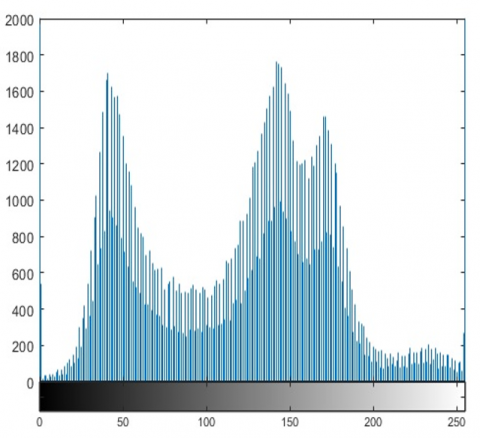
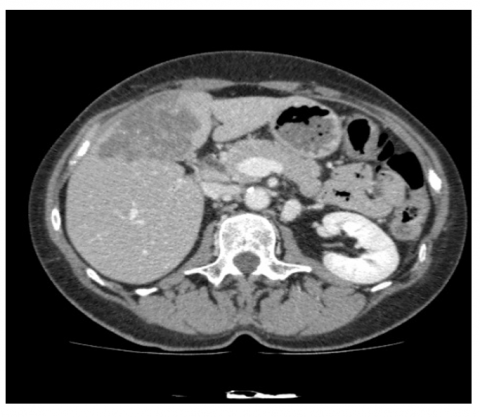
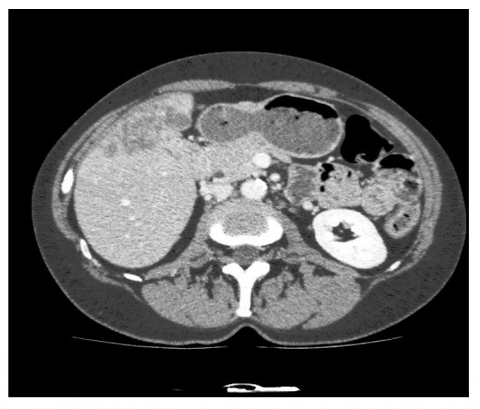
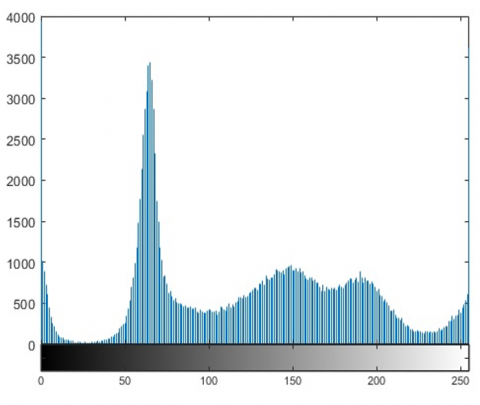
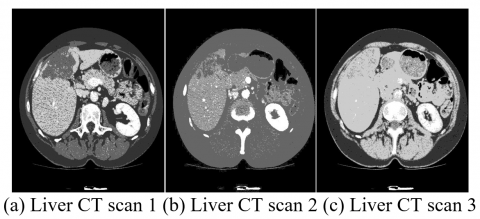
The size of the search space for an n-level segmentation problem is $\mathrm{D}=2^*(\mathrm{n}-1)$ because there are 2 unknown fuzzy parameters. The flowchart of the proposed method is shown in Figure 1. Figure 2 shows the corresponding histograms for three separate Liver CT scan images that form the dataset. The corresponding enhanced images are shown in Figure 3. Figures 4-6 show level 3 to level 5 of segmented liver CT scan images where Figures 7-9 show level 3 to level 5 of enhanced segmented liver CT scan images.
Figure 1. The flowchart of proposed segmentation framework
(a) Liver CT scan 1
(a') Histogram for Liver CT scan 1
(b) Liver CT scan 2
(b') Histogram for Liver CT scan 2
(c) Liver CT scan 3
(c') Histogram for Liver CT scan 3
Figure 2. Liver CT scan images and corresponding histograms
(a) Liver CT scan 1
(a') Histogram for Liver CT scan 1
(b) Liver CT scan 2
(b') Histogram for Liver CT scan 2
(c) Liver CT scan 3
(c') Histogram for Liver CT scan 3
Figure 3. Enhanced liver CT scan images and corresponding histograms
Figure 4. Proposed approach level 3 segmented liver CT scan images
Figure 5. Proposed approach level 4 segmented liver CT scan images
Figure 6. Proposed approach level 5 segmented liver CT scan images
Figure 7. Proposed approach level 3 segmented of enhanced segmented liver CT scan images
Figure 8. Proposed approach level 4 segmented of enhanced segmented liver CT scan images
Figure 9. Proposed approach level 5 segmented of enhanced segmented liver CT scan images
Table 1. Parameter values obtained by DE for 3–5 level thresholds without enhancement process
|
Image |
L |
Parameter Values |
|
Liver CT scan 1 |
3 |
25 32 161 208 231 233 |
|
4 |
23 68 72 109 133 149 195 210 |
|
|
5 |
22 42 51 53 64 172 202 216 230 238 |
|
|
Liver CT scan 2 |
3 |
66 107 222 224 228 242 |
|
4 |
11 34 40 59 155 165 206 234 |
|
|
5 |
51 115 128 159 162 186 206 220 221 253 |
|
|
Liver CT scan 3 |
3 |
17 50 75 95 189 194 |
|
4 |
60 65 94 199 208 212 216 234 |
|
|
5 |
23 39 78 94 94 149 176 185 224 236 |
*L is the level of threshold.
Table 2. Parameter values obtained by DE for 3–5 level thresholds with enhancement process
|
Image |
L* |
Parameter Values |
|
Enhanced Liver CT scan 1 |
3 |
31 92 109 119 136 147 |
|
4 |
0 30 33 54 147 152 178 227 |
|
|
5 |
85 88 121 121 148 152 193 215 242 244 |
|
|
Enhanced Liver CT scan 2 |
3 |
16 51 52 82 86 189 |
|
4 |
18 30 52 57 69 94 176 239 |
|
|
5 |
7 22 107 162 173 186 212 225 228 241 |
|
|
Enhanced Liver CT scan 2 |
3 |
45 140 141 179 206 234 |
|
4 |
36 51 91 136 186 200 211 217 |
|
|
5 |
5 28 44 51 74 89 122 176 231 253 |
*L is the level of threshold.
From experimental results, it can essay observer the impact of the choice of parameters, such as the number of thresholds and the value of the α parameter, on the segmentation results as we can get various view of segmentation results of CT scan of the livers that have potential applications in clinical settings.
The segmentation results of the suggested approach with level 3 threshold are shown in Figure 3, level 4 thresholds are shown in Figure 4, and level 5 threshold is shown in Figure 5. The corresponding enhanced CT liver segmentation results with level 3-5 threshold are shown in Figures 6-8. Table 1 and Table 2 show the value of the parameters determined by DE Considering 3-5 level thresholds for input CT liver images before and after applying enhancement algorithm. The determination of parameter values for the 3-5 level thresholds in DE relies on evaluating the visual clarity of segmented images obtained using different threshold values, such as Th = 3, Th = 4, and Th = 5. It was found that the segmented image visual quality is better with integrated enhancement algorithm for the input images, and the higher level of threshold (Th = 5) produces better results than the level of with Th = 4 and Th = 3. Furthermore, Various CT liver pictures can be used to show the effect of multilevel threshold. From Figure 4, it is clear that level 3 of threshold has little effect on the details in the CT liver picture. However, when the number of thresholds is increased to 5 (i.e., Figure 6), the specifics are easier to identify. Similar mixing-up occurs in Figure 7's CT liver image with the objects in the background.
Segmentation of liver images obtained from CT scans is a critical technique that supports various medical applications, including computer-aided diagnostics, disease identification, and hepatic function evaluation. It can be challenging to appropriately segment liver when CT imaging is used because of issues with low contrast and erratic grey-scale intensities. In this work, we introduced an efficient framework for enhanced segmentation of liver CT images using differential evolution optimization and fuzzy Rényi entropy. From the experimental results, we can conclude that the multi-level liver segmentation using the fuzzy Rényi entropy-based threshold technique significantly improves segmentation performance. Additionally, it might perform better when used with CT medical images with complex backdrops. The results confirm the proficiency of the framework, particularly in medical imaging scenarios with intricate backdrops, highlighting its potential for enhanced diagnosis and therapeutic planning. In the future, other medical scans performance indicators might be employed to verify the segmentation algorithm's proficiency as well as adding the service-continuity to the proposed approach to adapt with the dynamic systems.
[1] Sharp, G., Fritscher, K.D., Pekar, V., Peroni, M., Shusharina, N., Veeraraghavan, H., Yang, J. (2014). Vision 20/20: Perspectives on automated image segmentation for radiotherapy. Medical Physics, 41(5): 050902. https://doi.org/10.1118/1.4871620
[2] Tamal, M. (2020). Intensity threshold based solid tumour segmentation method for Positron Emission Tomography (PET) images: A review. Heliyon, 6(10): e05267. https://doi.org/10.1016/j.heliyon.2020.e05267
[3] Dake, S.S., Nguyen, M., Yan, W.Q., Kazi, S. (2019). Human tumor detection using active contour and region growing segmentation. In 2019 4th International Conference and Workshops on Recent Advances and Innovations in Engineering (ICRAIE), Kedah, Malaysia, pp. 1-5. https://doi.org/10.1109/ICRAIE47735.2019.9037642
[4] Shahvaran, Z., Kazemi, K., Fouladivanda, M., Helfroush, M.S., Godefroy, O., Aarabi, A. (2021). Morphological active contour model for automatic brain tumor extraction from multimodal magnetic resonance images. Journal of Neuroscience Methods, 362: 109296. https://doi.org/10.1016/j.jneumeth.2021.109296
[5] Zhang, T., Zhang, J., Xue, T., Rashid, M.H. (2022). A brain tumor image segmentation method based on quantum entanglement and wormhole behaved particle swarm optimization. Frontiers in Medicine, 9: 794126. https://doi.org/10.3389/fmed.2022.794126
[6] Sergioli, G., Militello, C., Rundo, L., Minafra, L., Torrisi, F., Russo, G., Giuntini, R. (2021). A quantum-inspired classifier for clonogenic assay evaluations. Scientific Reports, 11(1): 2830. https://doi.org/10.1038/s41598-021-82085-8
[7] Zhang, X., Zhang, C., Tang, W., Wei, Z. (2012). Medical image segmentation using improved FCM. Science China Information Sciences, 55: 1052-1061. https://doi.org/10.1007/s11432-012-4556-0
[8] Biratu, E.S., Schwenker, F., Debelee, T.G., Kebede, S.R., Negera, W.G., Molla, H.T. (2021). Enhanced region growing for brain tumor MR image segmentation. Journal of Imaging, 7(2): 22. https://doi.org/10.3390/jimaging7020022
[9] Lee, C.C., Chung, P.C., Tsai, H.M. (2003). Identifying multiple abdominal organs from CT image series using a multimodule contextual neural network and spatial fuzzy rules. IEEE Transactions on Information Technology in Biomedicine, 7(3): 208-217. https://doi.org/10.1109/TITB.2003.813795
[10] Elaraby, A., Elansary, I. (2021). A framework for multi-threshold image segmentation of low contrast medical images. Traitement du Signal, 38(2): 309-314. https://doi.org/10.18280/ts.380207
[11] Lamecker, H., Lange, T., Seebass, M. (2004). Segmentation of the liver using a 3D statistical shape model. ZIB Report, 1-25.
[12] Zhou, X., Kitagawa, T., Hara, T., Fujita, H., Zhang, X., Yokoyama, R., Hoshi, H. (2006). Constructing a probabilistic model for automated liver region segmentation using non-contrast X-ray torso CT images. In Medical Image Computing and Computer-Assisted Intervention–MICCAI 2006: 9th International Conference, Copenhagen, Denmark, pp. 856-863. https://doi.org/10.1007/11866763_105
[13] Lefohn, A.E., Cates, J.E., Whitaker, R.T. (2003). Interactive, GPU-based level sets for 3D segmentation. In Medical Image Computing and Computer-Assisted Intervention-MICCAI 2003: 6th International Conference, Montréal, Canada, pp. 564-572. https://doi.org/10.1007/978-3-540-39899-8_70
[14] Cates, J.E., Lefohn, A.E., Whitaker, R.T. (2004). GIST: an interactive, GPU-based level set segmentation tool for 3D medical images. Medical Image Analysis, 8(3): 217-231. https://doi.org/10.1016/j.media.2004.06.022
[15] Eruslanov, R.V., Orehova, M.N., Dubrovin, V.N. (2015). Retroperitoneal space organ segmentation from CT images based on the level set function. Computer Optics, 39(4): 592-599. https://doi.org/10.18287/0134-2452-2015-39-4-592-599
[16] Storn, R., Price, K. (1997). Differential evolution–a simple and efficient heuristic for global optimization over continuous spaces. Journal of Global Optimization, 11: 341-359. https://doi.org/10.1023/A:1008202821328
[17] Elaraby, A.E., Nechaevskiy, A.V.E. (2021). An effective segmentation approach for liver computed tomography scans using fuzzy exponential entropy. Компьютерные исследования и моделирование, 13(1): 195-202. https://doi.org/10.20537/2076-7633-2021-13-1-195-202
[18] Elaraby, A.E. (2021). A framework for medical image segmentation based on measuring diversity of pixel's intensity utilizing interval approach. Компьютерные исследования и моделирование, 13(5): 1059-1066. https://doi.org/10.20537/2076-7633-2021-13-5-1059-1066
[19] Elaraby, A., Al-Ameen, Z. (2022). Multi-phase information theory-based algorithm for edge detection of aerial images. Journal of Information and Communication Technology, 21(2): 233-254. https://doi.org/10.32890/jict2022.21.2.4
[20] Gray, R.M. (2011). Entropy and information theory. Springer Science & Business Media.
[21] Pal, N.R., Pal, S.K. (1991). Entropy: A new definition and its applications. IEEE Transactions on Systems, Man, and Cybernetics, 21(5): 1260-1270. https://doi.org/10.1109/21.120079
[22] Elaraby, A., Taha, A. (2022). An approach for cross-modality guided quality enhancement of liver image. International Journal of Electrical & Computer Engineering, 12(2): 1449-1455. https://doi.org/10.11591/ijece.v12i2.pp1449-1455