Lavu Venkata Rajani Kumari*![]() | Kalthi Jagruti | Gollapudi Ramesh Chandra
| Kalthi Jagruti | Gollapudi Ramesh Chandra![]() | Muthyala Sharath Reddy | B. Bhadramma
| Muthyala Sharath Reddy | B. Bhadramma
© 2024 The authors. This article is published by IIETA and is licensed under the CC BY 4.0 license (http://creativecommons.org/licenses/by/4.0/).
OPEN ACCESS
Knee Osteoarthritis (KOA) is a prevalent condition that deteriorates with time and may lead to disability. Diagnosis depends on subjective symptom evaluation and radiograph analysis. The Kellgren-Lawrence (KL) grading system is widely used to assess the severity of knee osteoarthritis, with grades ranging from 0 (no osteoarthritis) to 4 (severe osteoarthritis). The detection and classification of KOA play a crucial role in medical diagnosis and treatment planning. It enables healthcare professionals to detect the condition at an early stage to take necessary precautions through medication to prevent its progression, leading to a better quality of life for those affected by it. In this work, we propose an approach for knee osteoarthritis classification using fine-tuned deep learning models. We employed the concept of transfer learning by utilizing three pre-trained EfficientNet models: EfficientNet-B5, EfficientNet-B6, and EfficientNet-B7. By customizing the layers of the model, transfer learning enables us to use prior knowledge and models to enhance the performance of new tasks with limited data. The proposed system aims to automate the KL grading process by analyzing knee X-rays and classifying them into one of the five grades using fine-tuned EfficientNet models. Each model's performance is evaluated. The experimental results show that the EfficientNet-B7 model achieved the highest accuracy of 78.53%, while EfficientNet-B5 and EfficientNet-B6 attained accuracies of 75.14% and 76.47%, respectively.
deep learning, EfficientNet, Kellgren and Lawrence (KL), Knee Osteoarthritis (KOA), transfer learning
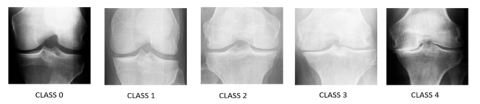
The most common kind of arthritis, knee osteoarthritis is a degenerative disorder of the knee joint that restricts movement and worsens the quality of life for millions of people [1]. Although there is no known treatment for KOA, there are several medical, environmental, and biological risk factors that can be altered and those that cannot, are known to contribute to the emergence and development of the illness [2]. Knee osteoarthritis is radiologically categorized using the Kellgren-Lawrence grading system, which categorizes it into five classes. From grade 0 to grade 4, it advances. To determine the seriousness of the condition, knee osteoarthritis must be graded. The 5 classes are divided into healthy(0), doubtful(1), minimal(2), moderate(3), and severe(4) class types. The KL grades are illustrated in Figure 1.
The two main components of treating knee OA illness are diagnosis and treatment. The best outcomes for illness management are achieved when diagnosis and therapy are combined. Based on symptoms and signs, a diagnosis determines the presence of a disease in a patient, whereas treatment focuses on the disease itself to provide palliative and curative effects. The purpose of treatment is to halt the progression of the disease and prevent it from reaching its most severe state; therefore several diagnoses can be made to track the course of the illness. The prognosis might be used to forecast future illness occurrences and treatment outcomes by expanding our understanding of how diseases progress [3]. KOA diagnosis can result in variation in assessment among clinicians. Pain perception can vary among individuals, making it difficult to measure and track disease progression. Furthermore, early symptoms of KOA are often unrecognized, and joint pain is sometimes perceived as a normal part of aging. KOA symptoms can also overlap with other musculoskeletal conditions or systemic diseases, making it important to carefully evaluate and distinguish it from other forms of arthritis like rheumatoid arthritis.
Currently, it is impossible to predict knee OA because of the unknown association between variables. Predicting disease development and creating a preventative strategy is challenging for medical professionals. As far as we are aware, there is no predictive tool used in clinical practice. The notion of creating diagnostic and prognostic prediction models for the healthcare sector was recently developed [3], and it might be applied to improve the present knee OA management system. X-ray imaging and patient-reported outcome measures (PROMs) are now the major methods used to diagnose knee OA. Arthroscopic examination, physical examination, joint aspiration, and advanced imaging systems are further diagnostic methods for diagnosing knee OA. Diagnoses of knee OA often occur in the middle to end stages of the illness when there is already significant evidence of permanent joint damage. Early diagnosis enables healthcare professionals to provide timely and appropriate interventions, leading to improved prognoses, enhanced treatment options, and ultimately better quality of life for patients. The earlier the diagnosis, the better the chances of slowing down the progression of the disease and preventing permanent damage. It is important to keep in mind that all currently available diagnostic techniques demand time-consuming, high-level interpretation from medical professionals. As a result of the success of the data-driven approach in other areas of healthcare, deep learning algorithms and sensor technologies are now being used to exploit present diagnostic systems.
Figure 1. Grading of KOA
Deep learning is a powerful technique for the categorization and analysis of images that is extensively used in many industries, including the medical industry, and performs admirably. Deep Convolutional Neural Networks (CNNs) and machine learning (ML) have recently demonstrated significant superiority in identifying even the smallest variances in biological joint structural alterations in X-rays [4]. The early detection and treatment of knee OA may be made possible by a deeper understanding of the condition. The best strategy to manage knee OA is thought to be with early treatments and preventative measures. Unfortunately, there hasn't yet been a reliable method that is widely used to detect the disease in its earliest stages.
The High-Resolution Network (HRNet) was utilized by Jain et al. [5] to collect the multi-scale aspects of knee X-rays and an attention mechanism was added to enhance performance. For the validation of network learning, they additionally used Gradient-based Class Activation Maps (Grad-CAMs). In the above study, due to the radiograph’s lack of complex characteristics, certain radiographs could not be appropriately categorised.
To autonomously identify the region of interest (ROI) inside X-rays, Swiecicki et al. [6] devised a methodology that made use of the RPN (region proposal network). Posteroanterior (PA) and Lateral (LAT) views were both used in this approach as the model's input. In clinical practices, certain cases might lack one of these views, which would render this method unusable. One potential limitation of comparing the model's scores with radiologist-assigned grades is the inherent variability in radiologist ratings. Radiologists may interpret images differently, which could impact the assessment of the method's performance and make it difficult to establish a definitive benchmark.
A CNN using ResNet architecture was trained by Olsson et al. [7]. To accomplish knee localization and KL-grade prediction, Zhang et al. [8] utilized various residual neural network (ResNet) architectures—ResNet-18 and ResNet-34.
Using baseline plain radiographs, Leung et al. [9] suggested a multitask DL model based on ResNet-34 to diagnose the severity of OA and forecast the likelihood of total knee replacement (TKR) in the next nine years.
Chen et al. [10] proposed a customized YOLOv2 network to detect knee joints from X-ray images and utilized fine-tuned CNN models such as ResNet, DenseNet, InceptionV3 and VGG to classify the detected knee joint images using an adjustable ordinal loss. Shamir et al. [11] methodology involves identifying informative image content descriptors and transforms, assigning weights using Fisher scores to the images, and using a weighted nearest neighbour’s algorithm to predict the KL grade. Guan et al. [12] used knee X-ray images to predict KOA with VGG16 and DenseNet, along with a support vector machine (SVM) on non-image data. Based on the YOLO and DenseNet models, the authors [13] developed an OA prediction model that integrates the two deep neural network models for classification and joint cropping. To construct a collaborative training model, they integrated the DL model with data on radiographic and demographic risk factors, similar to the study [12]. This study used a relatively small dataset of 1950 knees from the Osteoarthritis Initiative (OAI) database. These models are developed and evaluated specifically for predicting the progression of radiographic medial joint space loss in the knee's medial compartment over a 48-month follow-up period. The applicability of the models to predicting other endpoints or in different time frames is not explored.
Abdullah and Rajasekaran [14] located the knee joint space width (JSW) region using a faster region with CNN (RCNN) architecture and employed pre-trained networks, ResNet-50 for feature extraction and AlexNet for KOA severity classification. The selection criteria for patients above 50 years old with OA symptoms might introduce a bias towards older patients, potentially limiting the generalizability of the model to a broader demographic.
To identify OA lesions in both knees based on the KL scale, Cueva et al. [15] proposed a semi-automatic CADx model employing Deep Siamese convolutional neural networks and ResNet-34. For learning the similarity measure between the radiographs, Tiulpin et al. [16] implemented a technique using a deep Siamese network. The image resolution in this study was reduced to 8-bit that could have resulted in the loss of detailed information from the images, impacting the accuracy and performance of the model. There were instances where the model misclassified certain images, as there were differences between its predicted KL grade and the assessments made by a radiologist and an orthopaedist. This suggests that there may be inaccuracies in the ground truth KL grades of the dataset.
By modifying the template matching method, Antony et al. [17] were able to identify the knee joint centre’s using a linear SVM and Sobel horizontal image gradients. Through classification and regression, a CNN was then used to evaluate the severity of knee OA. Inception-ResNet-V2 was used by Kwon et al. [18] to extract features from radiography images that were then used by an SVM for the multi-classification of KOA. This study evaluated the performance of the model internally and used a relatively small sample size. However, the lack of open-source databases containing both radiographic images and gait data for KOA patients hinders external validation of the model. Although gait data provides significant information on joints, its complexity and the variety of features extracted could lead to challenges in interpretation, implementation, and clinical adoption. It does not delve into potential difficulties in processing and utilizing gait data.
The primary goal of this work is to develop a deep learning model using Knee digital X-ray images and classify KOA using the developed model. Deep learning models are modified to fit our KOA database using the transfer learning technique and validated through testing for detecting KOA.
The rest of the work is divided into the following sections. Our suggested technique, which involves dataset gathering, extraction of features and classification, is described in Section 3. Investigative results are shown and contrasted with existing state-of-the-art models in Section 4. The conclusion can be found in Section 5.
The transfer learning technique aids in the transfer of the learned skills of the pretrained models and in the gathering of knowledge needed to handle fresh data. Transfer learning enables the reuse of pre-existing parameters, such as convolution weights from a model learned on a huge dataset, for training new models with a limited number of annotated images.
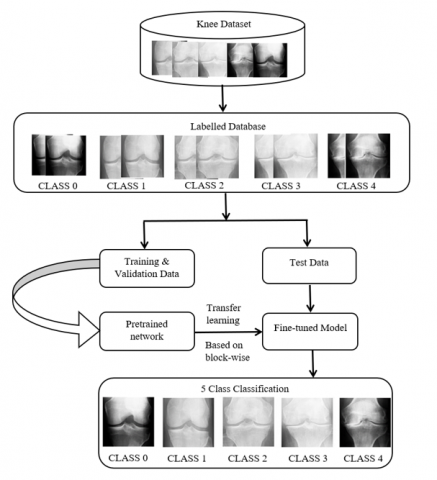
In this work, the B5, B6, and B7 models of EfficientNet were investigated. The implemented methodology's block diagram is shown in Figure 2. The dataset used includes 4796 participants aged between 45 and 79. It comprises of 4130 X-ray images, each representing two knee joints, resulting in a total of 8260 knee joints. To overcome the issue of class imbalance in classification, data augmentation is performed on the dataset as the severe class's x-ray images have the fewest while the healthy class's images have the greatest number. The X-ray image resolution used in this work is 224x224. The proposed approach commences with gathering X-ray images from the KOA Dataset, augmenting the data, followed by feature extraction and classification of the KOA using a deep learning model.
3.1 Collection of datasets and pre-processing
The knee X-ray dataset is taken from the Kaggle database [19]. It consists of 5 class types—healthy, doubtful, minimal, moderate, and severe. Data augmentation is applied when employing transfer learning to train a dataset. Hence, the length of an original dataset has been increased using data augmentation techniques such as flipping, rotation, shifting, etc. The samples from the dataset for training, testing and validation are displayed in Table 1. Several transformations are applied to the images, such as rotating them by an angle of 20 degrees in either direction or performing horizontal flipping for X-Ray images. Shifting techniques such as width and height shift with a factor of 0.2 are also utilised. Furthermore, zooming in by a factor of 0.2 is applied to the images as well.
Figure 2. Block diagram of knee classification
Table 1. Total augmented knee X-ray images
|
Knee Type |
Total |
Training |
Validation |
Testing |
|
Healthy [0] |
6503 |
4571 |
655 |
1277 |
|
Doubtful [1] |
2987 |
2091 |
305 |
591 |
|
Minimal [2] |
4347 |
3031 |
423 |
893 |
|
Moderate [3] |
2170 |
1514 |
211 |
445 |
|
Severe [4] |
1667 |
1513 |
53 |
101 |
|
Total |
17,674 |
12,720 |
1647 |
3307 |
3.2 Classification through deep learning
In the implementation of our deep learning model for KOA classification, we utilized the commonly used ReLU activation function and a fully connected layer (FC) with the SoftMax layer as the last layer. Changes to offsets and weights are made using optimizers such as root mean square propagation (RMSprop), stochastic gradient descent with momentum (SGDM) and adaptive moment estimation (ADAM). The SGDM accelerates an undesirable descent path to reduce oscillation. It is performed by combining the learning rate η with the prior stage update vector γ.
$v_t=\gamma v_{t-1}+\eta \nabla_\theta J(\theta)$ (1)
$\theta_{t+1}=\theta_t-v_t$ (2)
$v_t$ - momentum, $\theta_{t+1}$-parameter.
Using an exponentially decaying average, RMSprop adaptively converges and is defined as:
$E\left|g^2\right|_t=\gamma E\left|g^2\right|_{t-1}+(1-\gamma) g_t^2$ (3)
$\theta_{t+1}=\theta_t-\frac{\eta}{\sqrt{E\left|g^2\right| t}+\epsilon} g_t$ (4)
$E\left|g^2\right|_t$ - running average, $g_t=\nabla_\theta J(\theta)$.
The Adams optimizer determines the learning rates for every parameter. The second moment's variance $v_t$ and the first moment's mean $m_t$ are updated as:
$m_t=\beta_1 m_{t-1}+\left(1-\beta_1\right) g_t$ (5)
$v_t=\beta_2 v_{t-1}+\left(1-\beta_2\right) g_t^2$ (6)
It is common practice to either use input images with greater resolutions for training and testing or to enhance the depth or breadth of the CNN to scale a model. Although these methods boost accuracy, they frequently lead to subpar outcomes and the need for time-consuming human correction. While increasing individual dimensions enhance the model’s performance, it was found that optimizing network performance required balancing all network dimensions—depth, width, and image resolution—against the available resources.
3.2.1 EfficientNet
EfficientNet scales up models rapidly and easily using a technique known as a compound coefficient. Compound scaling consistently scales each dimension with a predetermined fixed set of scaling factors rather than arbitrarily changing depth, resolution, or width. EfficientNet's developers created seven models in varying dimensions using an AutoML and scaling approach, outperforming most CNNs' accuracy while being much more efficient [20].
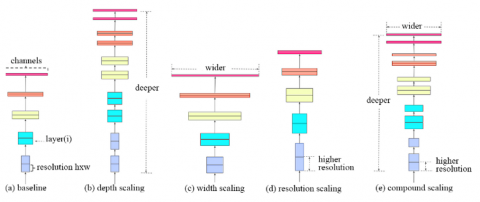
For developing the method of compound scaling, the authors systematically studied the impacts that each scaling technique has on the model's performance and efficiency. The compound scaling method is shown in Figure 3. The compound scaling method is based on the idea of balancing dimensions of width, depth, and resolution by scaling with a constant ratio. The scaling coefficients of EfficientNet variants are shown in Table 2.
The equations below show how it is achieved mathematically,
Resolution $R=\gamma^{\varnothing}$, Depth $D=\alpha^{\varnothing}$, Width $W=\beta^{\varnothing}$, Such that $\alpha . \beta^2 \cdot \gamma^2 \approx 2 \,\,\alpha \geq 1, \beta \geq 1, \gamma \geq 1$ (7)
Comparing the compound scaling technique to other random scaling techniques, it helped to improve the model accuracy and efficiency of previous CNN models, like ResNet and MobileNet, by about 1.4% and 0.7%, respectively [20]. The experimental findings demonstrated that using EfficientNet on the other dataset under consideration significantly increases overall prediction accuracy when compared to a known baseline [21, 22]. Table 3 displays the EfficientNet-B0 baseline network's parameters.
Figure 3. Model scaling. (a) network of baseline; (b)-(d) Individual scaling of depth, width and resolution in a network; (e) uniform scaling of resolution, width and depth in a network
Table 2. EfficientNet model scaling coefficients-(B0, B5, B6, B7)
|
Model (EfficientNet) |
D_coe (Depth) |
W_coe (Width) |
S_coe (Scale) |
|
B0 |
1 |
1 |
1 |
|
B5 |
2.2 |
1.6 |
456/224 |
|
B6 |
2.6 |
1.8 |
528/224 |
|
B7 |
3.1 |
2.0 |
600/224 |
Table 3. Baseline EfficientNet-B0 network’s parameters
|
ithStage |
Operators |
Resolution |
#No of Channels |
#No of Layers |
|
1 |
Conv3×3 |
224×224 |
32 |
1 |
|
2 |
MBConv1, k3×3 |
112×112 |
16 |
2 |
|
3 |
MBConv1, k3×3 |
112×112 |
24 |
4 |
|
4 |
MBConv1, k3×3 |
56×56 |
40 |
4 |
|
5 |
MBConv1, k3×3 |
28×28 |
80 |
5 |
|
6 |
MBConv1, k3×3 |
14×14 |
112 |
5 |
|
7 |
MBConv1, k3×3 |
14×14 |
192 |
7 |
|
8 |
MBConv1, k3×3 |
7×7 |
320 |
2 |
|
9 |
Conv1 × 1 &Pooling&FC |
7×7 |
1280 |
1 |
Our model was trained and tested using a dataset of knee X-rays which are classified using the KL grading system. The findings of this work demonstrated the potential for classifying knee OA with the help of X-ray images using transfer learning-based EfficientNet.
4.1 Parameters considered
The learning rate of 0.001, epochs of 10,15,20, batch size of 20 and 32, and different optimizers are used in these models, which is represented in Table 4. The test set was used to determine the accuracy after the model had been trained on the knee KOA dataset.
Table 4. Considered parameters
|
Parameters |
Inputs |
|
Optimizer |
Adams, RMSprop, SGD |
|
Pooling |
Maximum pooling |
|
Batch size |
20,32 |
|
Learning rate |
0.001 |
|
Drop factor |
0.4 |
|
Maximum epochs |
10,15,20 |
Epochs are simply the number of iterations. The model is trained at 10 epochs while maintaining a batch size of 20. We observed that as the epochs increase, the training accuracy increases. A learning rate of 0.001 is considered. The drop factor of values 0.2 and 0.4 was considered. Optimizers improve model performance by adjusting weight parameters that reduce the loss function and minimize experienced loss. By comparing the true value and the predicted value from a neural network, the loss function determines loss. Optimizers such as RMSprop, SGDM, and ADAMs are utilized to enhance the performance of deep learning models.
To train models, at least 10 epochs were taken into account. The model was trained using the three different optimizers with these parameters. The experimental results of the model's fine-tuning are shown in Tables 5-7.
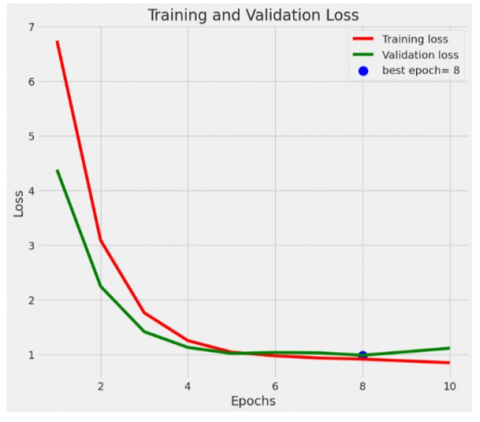
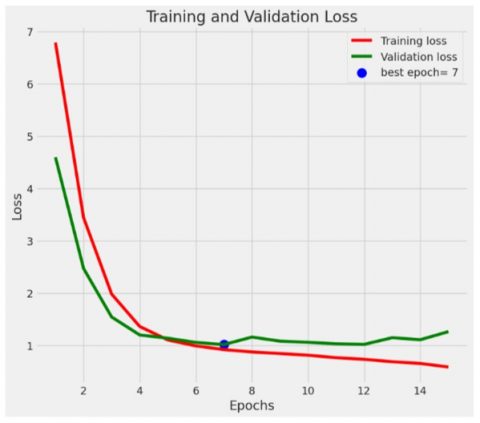
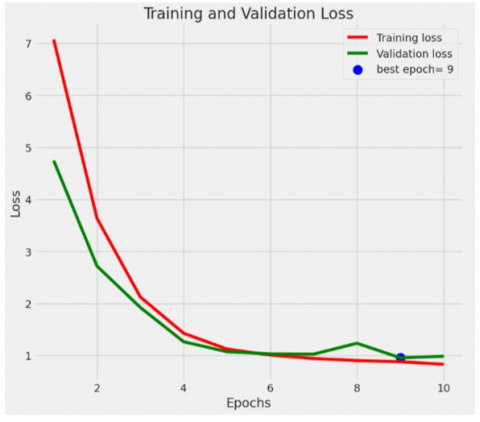
Using the Adams optimizer, EfficientNet-B5 attained the best accuracy of 75.14%, EfficientNet-B6 obtained the best accuracy of 76.47% and EfficientNet-B7 achieved the greatest accuracy of 78.53% of all on the 5-class dataset. Figure 4 depicts the loss function of the top-performing fine-tuned models.
Table 5. EfficientNet-B5 fine-tuned investigative results
|
Tested Parameter |
Optimizers |
|
|
|
ADAMs |
RMSprop |
SGDM |
|
|
Batch size |
20 |
20 |
20 |
|
No. of epochs |
10 |
10 |
10 |
|
Learning rate |
0.001 |
0.001 |
0.001 |
|
Drop factor |
0.4 |
0.4 |
0.4 |
|
Accuracy |
75.14% |
71.23% |
64.73% |
Table 6. EfficientNet-B6 fine-tuned investigative results
|
Tested Parameter |
Optimizers |
|
|
|
ADAMs |
RMSprop |
SGDM |
|
|
Batch size |
20 |
20 |
20 |
|
No. of epochs |
10 |
10 |
10 |
|
Learning rate |
0.001 |
0.001 |
0.001 |
|
Drop factor |
0.2 |
0.2 |
0.2 |
|
Accuracy |
76.47% |
69.80% |
56.14% |
Table 7. EfficientNet-B7 fine-tuned investigative results
|
Tested Parameter |
Optimizers |
|
|
|
ADAMs |
RMSprop |
SGDM |
|
|
Batch size |
20 |
20 |
20 |
|
No. of epochs |
10 |
10 |
10 |
|
Learning rate |
0.001 |
0.001 |
0.001 |
|
Drop factor |
0.2 |
0.2 |
0.2 |
|
Accuracy |
78.53% |
72.35% |
67.88% |
(a) EfficientNet-B5
(b) EfficientNet-B6
(c) EfficientNet-B7
Figure 4. The loss function of fine-tuned EfficientNet models
4.2 Equations for performance measures
The performance of the model is represented by a confusion matrix. Table 8 displays the confusion matrix for a classification involving the "P" class, characterized by dimensions of P × P.
Table 8. P class confusion matrix
|
True Class |
Predicted Class |
|
|
|
|
Class 1 |
Class 2 |
… |
Class P |
|
|
Class 1 |
X11 |
X12 |
… |
X1P |
|
Class 2 |
X21 |
X22 |
… |
X2P |
|
. : |
. : |
. : |
. : |
. : |
|
Class P |
XP1 |
XP2 |
… |
XPP |
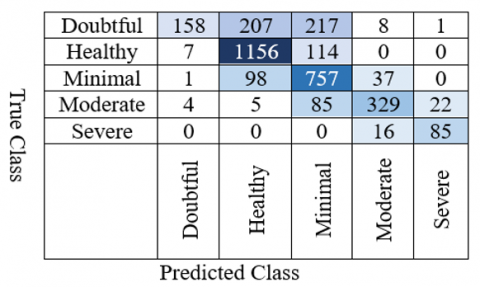
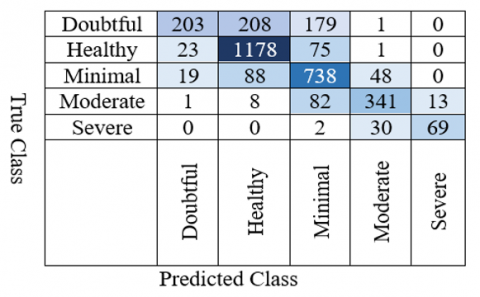
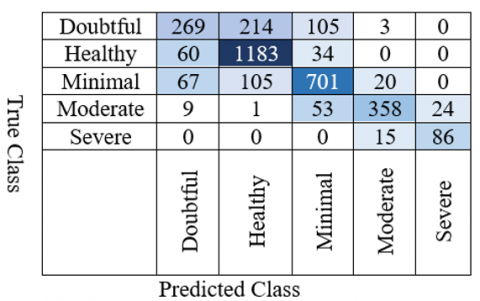
The confusion matrices produced by our models are shown in Figures 5-7. Measures of performance like Accuracy, F1-score, recall, and precision are computed [23-30]. The following is a collection of formulas for calculating performance measures.
Precision (class k)=$\frac{c_{k k}}{\sum_{j=1}^n C_{j k}}$ (8)
Recall (class k)=$\frac{C_{k k}}{\sum_{j=1}^n C_{k j}}$ (9)
$F - \textit{score}$ (class k)=$\frac{2 \times C_{k k}}{\sum_{j=1}^n C_{k j}+\sum_{j=1}^n C_{j k}}$ (10)
$\textit{Specificity}$ (class k)=$\frac{\sum_{j=1}^n c_{j j}-C_{k k}}{\left(\sum_{j=1}^n c_{j k}-C_{k k}\right)+\left(\sum_{j=1}^n c_{j j^{-}}-C_{k k}\right)}$ (11)
Overall Accuracy $=\frac{\sum_{j=1}^n c_{k k}}{\sum_{K=1}^n \sum_{j=1}^n c_{k j}}$ (12)
Figure 5. EfficientNet-B5’s confusion chart
Figure 6. EfficientNet-B6’s confusion chart
Figure 7. EfficientNet-B7’s confusion chart
Table 9. EfficientNet-B5 performance measures
|
Class |
Precision (%) |
Recall (%) |
Specificity (%) |
Fl-Score (%) |
|
Doubtful |
92.94 |
26.73 |
86.20 |
41.52 |
|
Healthy |
78.85 |
90.52 |
93.43 |
84.29 |
|
Minimal |
64.54 |
84.77 |
93.63 |
73.20 |
|
Moderate |
84.36 |
73.93 |
96.02 |
78.80 |
|
Severe |
78.70 |
84.16 |
99.50 |
81.34 |
|
Average |
79.87 |
72.02 |
93.75 |
71.83 |
The test accuracy of the model is 75.14%
Table 10. EfficientNet-B6 performance measures
|
Class |
Precision (%) |
Recall (%) |
Specificity (%) |
Fl-Score (%) |
|
Doubtful |
82.52 |
34.35 |
87.32 |
48.51 |
|
Healthy |
79.49 |
92.25 |
94.38 |
85.39 |
|
Minimal |
68.59 |
82.64 |
93.05 |
74.96 |
|
Moderate |
81.00 |
76.63 |
96.04 |
78.74 |
|
Severe |
84.15 |
68.32 |
99.01 |
75.41 |
|
Average |
79.15 |
70.84 |
93.96 |
72.60 |
The test accuracy of the model is 76.47%
Table 11. EfficientNet-B7 performance measures
|
Class |
Precision (%) |
Recall (%) |
Specificity (%) |
Fl-Score (%) |
|
Doubtful |
66.42 |
45.52 |
88.90 |
54.56 |
|
Healthy |
78.71 |
92.64 |
94.76 |
85.11 |
|
Minimal |
78.50 |
78.50 |
92.05 |
78.50 |
|
Moderate |
90.40 |
80.45 |
97.01 |
85.14 |
|
Severe |
78.18 |
85.15 |
99.53 |
81.52 |
|
Average |
78.44 |
76.45 |
94.45 |
76.96 |
The test accuracy of the model is 78.53%
Tables 9-11 provide a summary of the performance metrics for all the fine-tuned models. From the tabulated results, it is obvious that the fine-tuned B7 model when performed on a 5-class dataset attained the highest test accuracy of 78.53%.
4.3 Comparison of models
Table 12 lists the performance measures obtained by several models in the literature. Our EfficientNet-B5, B6, and B7 models outperformed existing models in the literature with a 75.14%, 76.47%, and 78.53% accuracy rate.
Table 12. Comparison of different studies
|
Experimental Study |
Number of Images |
Number of Classes |
Models |
Precision (%) |
F Score (%) |
Recall (%) |
Accuracy (%) |
|
Antony et al. [17] |
14,732 |
5 |
CNN |
56 |
56 |
60 |
60.3 |
|
Cueva et al. [15] |
31,164 |
5 |
RESNET34 |
65.80 |
- |
61.6 |
61.71 |
|
Tiulpin et al. [16] |
27,293 |
5 |
Deep Siamese Convolutional Neural Network |
- |
- |
- |
66.71 |
|
Kwon et al. [18] |
728 |
5 |
(only radiographical images) INCEPTION RESNETV2 |
60 |
55 |
55 |
64.7 |
|
Proposed Model |
17,674 |
5 |
EfficientNet-B5 EfficientNet-B6 EfficientNet-B7 |
79.87 79.15 78.44 |
71.83 72.60 76.96 |
72.02 70.84 76.45 |
75.14 76.47 78.53 |
Identifying and classifying KOA with precision and accuracy is a challenging task, especially given the similarity between different Kellgren-Lawrence (KL) grades. Automated classification models can aid in early detection, enabling timely interventions and personalized treatment plans. In this paper, a deep-learning-based EfficientNet algorithm has been employed for the detection and classification of knee osteoarthritis. The three EfficientNet models in this research are B5, B6, and B7. These models were trained using transfer learning. It was found that EfficentNet-B5, B6, and B7 produced accuracies of 75.14%, 76.47% and 78.53%. Compared to the variants of EfficientNet, the fine-tuned EfficientNet-B7 model achieves the best classification performance. A limitation of our model is its apparent underperformance in classifying KL-0 and KL-1 classes, likely due to the subtle distinction between these two classes. The results obtained show that automated OA detection and prediction based on X-ray images of the knee is possible and is faster than manual detection and classification. As a result, an automatic diagnostic system can save time, enabling doctors to focus on clinical findings. Our future work will include exploring new techniques and methods to optimize performance and develop robust diagnostic tools for detecting and classifying the KOA. It also involves integrating additional information, such as the existence or severity of symptoms. Additionally, it is intended to adapt and evaluate the techniques created for the examination of joint illnesses other than OA, such as rheumatoid arthritis and osteoporosis.
[1] Lespasio, M.J., Piuzzi, N.S., Husni, M.E., Muschler, G.F., Guarino, A.J., Mont, M.A. (2017). Knee osteoarthritis: A primer. The Permanente Journal, 21: 16-183. https://doi.org/10.7812/TPP/16-183
[2] Courties, A., Sellam, J., Berenbaum, F. (2017). Metabolic syndrome-associated osteoarthritis. Current Opinion in Rheumatology, 29(2): 214-222. https://doi.org/10.1097/BOR.0000000000000373
[3] Van Smeden, M., Reitsma, J.B., Riley, R.D., Collins, G.S., Moons, K.G. (2021). Clinical prediction models: Diagnosis versus prognosis. Journal of Clinical Epidemiology, 132: 142-145. https://doi.org/10.1016/j.jclinepi.2021.01.009
[4] Yeoh, P.S.Q., Lai, K.W., Goh, S.L., Hasikin, K., Hum, Y.C., Tee, Y.K., Dhanalakshmi, S. (2021). Emergence of deep learning in knee osteoarthritis diagnosis. Computational Intelligence and Neuroscience, 2021: 1-20. https://doi.org/10.1155/2021/4931437
[5] Jain, R.K., Sharma, P.K., Gaj, S., Sur, A., Ghosh, P. (2021). Knee osteoarthritis severity prediction using an attentive multi-scale deep convolutional neural network. arXiv preprint arXiv:2106.14292. https://doi.org/10.48550/arXiv.2106.14292
[6] Swiecicki, A., Li, N., O'Donnell, J., Said, N., Yang, J., Mather, R.C., Jiranek, W.A., Mazurowski, M.A. (2021). Deep learning-based algorithm for assessment of knee osteoarthritis severity in radiographs matches performance of radiologists. Computers in Biology and Medicine, 133: 104334. https://doi.org/10.1016/j.compbiomed.2021.104334
[7] Olsson, S., Akbarian, E., Lind, A., Razavian, A.S., Gordon, M. (2021). Automating classification of osteoarthritis according to Kellgren-Lawrence in the knee using deep learning in an unfiltered adult population. BMC Musculoskeletal Disorders, 22(1): 1-8. https://doi.org/10.1186/s12891-021-04722-7
[8] Zhang, B., Tan, J., Cho, K., Chang, G., Deniz, C.M. (2020). Attention-based CNN for kl grade classification: Data from the osteoarthritis initiative. In 2020 IEEE 17th International Symposium on Biomedical Imaging (ISBI), Iowa City, IA, USA, pp. 731-735. https://doi.org/10.1109/ISBI45749.2020.9098456
[9] Leung, K., Zhang, B., Tan, J., Shen, Y., Geras, K.J., Babb, J.S., Cho, K., Chang, G., Deniz, C.M. (2020). Prediction of total knee replacement and diagnosis of osteoarthritis by using deep learning on knee radiographs: Data from the osteoarthritis initiative. Radiology, 296(3): 584-593. https://doi.org/10.1148/radiol.2020192091
[10] Chen, P., Gao, L., Shi, X., Allen, K., Yang, L. (2019). Fully automatic knee osteoarthritis severity grading using deep neural networks with a novel ordinal loss. Computerized Medical Imaging and Graphics, 75: 84-92. https://doi.org/10.1016/j.compmedimag.2019.06.002
[11] Shamir, L., Ling, S.M., Scott, W.W., Bos, A., Orlov, N., Macura, T.J., Eckley, D.M., Ferrucci, L., Goldberg, I.G. (2008). Knee x-ray image analysis method for automated detection of osteoarthritis. IEEE Transactions on Biomedical Engineering, 56(2): 407-415. https://doi.org/10.1109/TBME.2008.2006025
[12] Guan, B., Liu, F., Mizaian, A.H., Demhri, S., Neogi, T., Guermazi, A., Kijowski, R. (2019). Deep learning approach to predict radiographic knee osteoarthritis progression. Osteoarthritis and Cartilage, 27: S395-S396. https://doi.org/10.1016/j.joca.2019.02.396
[13] Guan, B., Liu, F., Haj-Mirzaian, A., Demehri, S., Samsonov, A., Neogi, T., Guermazi, A., Kijowski, R. (2020). Deep learning risk assessment models for predicting progression of radiographic medial joint space loss over a 48-MONTH follow-up period. Osteoarthritis and Cartilage, 28(4): 428-437. https://doi.org/10.1016/j.joca.2020.01.010
[14] Abdullah, S.S., Rajasekaran, M.P. (2022). Automatic detection and classification of knee osteoarthritis using deep learning approach. La Radiologia Medica, 127(4): 398-406. https://doi.org/10.1007/s11547-022-01476-7
[15] Cueva, J.H., Castillo, D., Espinós-Morató, H., Durán, D., Díaz, P., Lakshminarayanan, V. (2022). Detection and classification of knee osteoarthritis. Diagnostics, 12(10): 2362. https://doi.org/10.3390/diagnostics12102362
[16] Tiulpin, A., Thevenot, J., Rahtu, E., Lehenkari, P., Saarakkala, S. (2018). Automatic knee osteoarthritis diagnosis from plain radiographs: A deep learning-based approach. Scientific Reports, 8(1): 1727. https://doi.org/10.1038/s41598-018-20132-7
[17] Antony, J., McGuinness, K., Moran, K., O’Connor, N.E. (2017). Automatic detection of knee joints and quantification of knee osteoarthritis severity using convolutional neural networks. In: Perner, P. (eds) Machine Learning and Data Mining in Pattern Recognition. MLDM 2017. Lecture Notes in Computer Science, vol 10358. Springer, Cham. https://doi.org/10.1007/978-3-319-62416-7_27
[18] Kwon, S.B., Han, H.S., Lee, M.C., Kim, H.C., Ku, Y. (2020). Machine learning-based automatic classification of knee osteoarthritis severity using gait data and radiographic images. IEEE Access, 8: 120597-120603. https://doi.org/10.1109/ACCESS.2020.3006335
[19] Osteoarthritis Dataset with Severity Grading. Kaggle. Available online: https://www.kaggle.com/datasets/shashwatwork/knee-osteoarthritis-dataset-with-severity?resource=download&select=auto_test, accessed on 12 Feb. 2024.
[20] Tan, M., Le, Q. (2019). Efficientnet: Rethinking model scaling for convolutional neural networks. In International Conference on Machine Learning, pp. 6105-6114.
[21] Zhang, P., Yang, L., Li, D. (2020). EfficientNet-B4-Ranger: A novel method for greenhouse cucumber disease recognition under natural complex environment. Computers and Electronics in Agriculture, 176: 105652. https://doi.org/10.1016/j.compag.2020.105652
[22] Duong, L.T., Nguyen, P.T., Di Sipio, C., Di Ruscio, D. (2020). Automated fruit recognition using EfficientNet and MixNet. Computers and Electronics in Agriculture, 171: 105326. https://doi.org/10.1016/j.compag.2020.105326
[23] Rajani Kumari, L.V., Chalapathi Rao, Y. (2023). ECG beat classification using proposed pattern adaptive wavelet-based hybrid classifiers. Signal, Image and Video Processing, 17: 2827-2835. https://doi.org/10.1007/s11760-023-02501-6
[24] Kumari, L.V.R., Lohitha, A., Kavya, A., Tarakeswar, N. (2022). Automated sleep apnea classification based on statistical and spectral analysis of electrocardiogram signals. Indonesian Journal of Electrical Engineering and Computer Science, 25(3): 1450-1457. https://doi.org/10.11591/ijeecs.v25.i3.pp1450-1457
[25] Mohebbanaaz, Kumar, L.R., Sai, Y.P. (2022). A new transfer learning approach to detect cardiac arrhythmia from ECG signals. Signal, Image and Video Processing, 16(7): 1945-1953. https://doi.org/10.1007/s11760-022-02155-w
[26] Sai, Y.P., Kumari, L.R. (2022). Cognitive assistant DeepNet model for detection of cardiac arrhythmia. Biomedical Signal Processing and Control, 71: 103221. https://doi.org/10.1016/j.bspc.2021.103221
[27] Kumari, L.V., Sai, Y.P. (2022). Classification of ECG beats using optimized decision tree and adaptive boosted optimized decision tree. Signal, Image and Video Processing, 16(3): 695-703. https://doi.org/10.1007/s11760-021-02009-x
[28] Mohebbanaaz, M., Sai, Y.P., Kumari, L.V.R. (2021). Detection of cardiac arrhythmia using deep CNN and optimized SVM. Indonesian Journal of Electrical Engineering and Computer Science, 24(2): 217-225. https://doi.org/10.11591/ijeecs.v24.i1.pp217-225
[29] Rajani Kumari, L.V., Padma Sai, Y., Balaji, N. (2023). R-peak identification in ECG signals using pattern-adapted wavelet technique. IETE Journal of Research, 69(5): 2468-2477. https://doi.org/10.1080/03772063.2021.1893229
[30] Kumari, L.R., Lohitha, A., Tarakeswar, N. (2021). Detection of sleep apnea from ECG signal using various machine learning algorithms. In 2021 IEEE 8th Uttar Pradesh Section International Conference on Electrical, Electronics and Computer Engineering (UPCON), Dehradun, India, pp. 1-7. https://doi.org/10.1109/UPCON52273.2021.9667603