Msallam Abbas Abdulhussein*![]() | Ali W. Aldeen
| Ali W. Aldeen![]() | Hamid Al-Abboodi
| Hamid Al-Abboodi![]()
© 2024 The authors. This article is published by IIETA and is licensed under the CC BY 4.0 license (http://creativecommons.org/licenses/by/4.0/).
OPEN ACCESS
This investigation explores cortical connectivity in individuals diagnosed with migraine, employing high-density electroencephalography (HD-EEG) and steady-state visual evoked potentials (SSVEP) to discern distinctions between migraine with aura (MWA) and migraine without aura (MWoA). The cohort comprised 22 participants suffering from migraines, categorized into MWA (13 participants, including 7 females) and MWoA (9 participants, with 5 females), alongside a control group of 19 healthy individuals (8 females), exhibiting no history of migraines. The ages of the migraine and control groups were 29±1 and 27±1 years, respectively. The methodology involved exposing subjects to visual stimuli at frequencies of four Hz and six Hz, each for a duration of 2 seconds, interspersed with inter-stimulus intervals of 1 to 1.5 seconds. The frequencies were presented in a randomized sequence, with each being delivered 100 times. Through the acquisition of EEG data from 128 custom electrode positions, inter- and intra-hemispheric coherence during the interictal phase was meticulously analyzed. It was observed that individuals with migraines exhibited a pronounced reduction in alpha-wave pattern uniformity across both intra- and inter-hemispheric connections, a phenomenon markedly accentuated in the MWA group. Further, a unique functional connectivity metric derived from HD-EEG data during repeated SSVEP stimulation emerged as a potential biomarker capable of differentiating between MWA and MWoA subjects. Notably, a significant discrepancy in the slope between Block 1 and Block 6 was observed in MWA subjects, highlighting a distinct response irrespective of stimulation frequency. These findings underscore the clinical significance of cortical connectivity measures in understanding migraine pathophysiology and developing targeted treatments. The variation in alpha-band coherence could reflect differential sensory processing and neural communication mechanisms, potentially linked to Cortical Spreading Depression (CSD). Despite the promising insights, the limited sample size underscores the need for cautious interpretation of the results and further research. This study contributes to the body of knowledge on migraine-induced alterations in brain function, paving the way for refined diagnostic and therapeutic strategies.
cortical connectivity, high-density EEG, steady-state visual evoked potentials (SSVEP), migraine, cortical spreading depression (CSD), aura
Migraines are not just severe headaches; they're a complicated blend of issues involving nerves and blood vessels in the brain. These headaches are more than just painful; they often bring along other problems with the nervous system [1]. Interestingly, about 20% of people with migraines get a warning signal known as an 'aura', manifesting as symptoms such as visual disturbances [2, 3]. This is thought to be linked to a phenomenon known as CSD, a theory that suggests a kind of electrical wave sweeps across the brain, setting off the symptoms of a migraine. In cases of MWA, there's something noteworthy: the brain seems to react more intensely to sensory information, even in the periods between migraines. This heightened activity in the brain is quite different from what is seen in people who have MWoA or those who don't have migraines at all. Getting a handle on this distinct brain activity in MWA, particularly in the quieter times between attacks, is key to fully understanding and managing migraines [4].
In research focusing on migraines, particularly in those who experience auras (MWA), there is a consistent discovery of distinct brain activity patterns, especially noticeable during the interictali phase, the period between migraine attacks. During these stages, people with MWA have stronger reactions to some visual tests and have a harder time getting used to these stimuli than people with MWoA and healthy controls (HC) [5-8]. This heightened response becomes evident when they undergo SSVEP testing. 1 SSVEPs are renowned for eliciting robust and reliable neural reactions, offering a window into the detailed workings of cortical activity and its connections. The superior signal-to-noise ratio of SSVEPs and their ability to trace the brain's functional connectivity over time set them apart from other sensory testing methods. These characteristics render SSVEPs a critical tool in investigating the intricacies of brain function, proving particularly valuable in enhancing our understanding of the changes in brain activity associated with migraines [9-11]. This choice was based on preliminary analyses and thorough reviews of existing literature, both of which showed how important these choices were for accurately capturing the neural dynamics that are typical of migraines [12].
Our particular focus on the 4-6 Hz frequency range was informed by its proven importance in prior research on migraines, highlighting its relevance in our quest to deepen the understanding of this complex neurological condition [13].
Studies on migraines show that certain stimuli can cause synchronized brain activity in visual areas. This suggests that sensory processing has changed, and there may be a link between migraine sufferers having frequent visual auras and their visual systems not working properly [14].
Looking into how different parts of the cortex communicate with each other when people are motivated, especially when they see something, is a good way to learn more about sensory hyperresponsiveness in MWA and how it works [15]. The goal of functional connectivity analysis is to look at the brain as a constantly changing system. This is different from the usual way of studying specific brain areas using EEG lead locations or voxels in fMRI research. By analyzing the interconnections and communication across cortical areas, scholars can gain valuable knowledge on the intricate network interactions that play a role in sensory anomalies [16-18]. Various mathematical algorithms are available to investigate synchronized neuronal activity and understand the functional connectivity and overall integrity of human brain networks. One commonly used algorithm is coherence, which examines whether multiple sensors or brain regions exhibit similar neuronal or oscillatory patterns. Coherence analysis has been employed since the 1960s, primarily by comparing the frequency distributions among EEG sensors. The coherence of EEG signals within a certain frequency range is measured by how consistent the relative amplitude and phase of those signals are [19-21].
EEG coherence is a widely employed metric to assess functional connectivity by examining cross-correlations between signals in the frequency domain, thereby revealing the interrelationships among EEG signals. This measure provides valuable insights into the level of connectivity and synchronization between different brain regions, facilitating a better understanding of the functional interactions and information processing within the neural network [22]. The fact that people with migraines have stronger neural responses to sensory stimuli than healthy controls, irrespective of the type of migraine, is strong evidence of sensory hyper-responsivity [23]. Both fMRI and EEG studies demonstrate this heightened responsiveness, while the diminished habituation to repetitive stimuli additionally implies heightened sensitivity to sensory input. Taken together, these findings point towards a modified sensory processing mechanism in individuals experiencing migraines, marked by intensified neural responses and compromised habituation to sensory stimuli. Different types of stimuli, like checkerboards, repeated flashes, and pattern reversal stimulation, have helped us learn a lot more about cortical hyper-responsiveness in migraine [18, 24].
Several studies have demonstrated this phenomenon, providing substantial evidence. As an example, one study found that people who had interictal MWA had bigger SSVEPs and trouble getting used to things compared to people who had MWoA and people who were not experiencing migraine [14]. Furthermore, these stimuli elicited synchronized oscillations in multiple cortical regions, including the visual areas. These findings underscore the presence of cortical hyperresponsiveness and the associated alterations in sensory processing among individuals affected by migraines. The inclination towards abnormal visual system activity may be associated with the higher occurrence of visual auras, which are more prevalent in individuals with migraines. This suggests a possible association between the prevalence of visual auras and the atypical functioning of the visual system [25-27].
Coherence EEG has been widely used in migraine research to investigate functional connectivity and neural dynamics. However, several limitations should be considered when interpreting the findings. The spatial resolution of the EEG is limited, preventing precise localization of brain activity. The interpretation of coherence values can be complex, as they need to provide information about the directionality or causality of connections. The selection of frequency bands and artifacts can also influence coherence measurements. Additionally, small sample sizes, heterogeneity of migraine subtypes, and the need for more standardization in methodologies pose challenges in drawing definitive conclusions from coherent EEG studies [28]. Considering these limitations, future research should explore complementary approaches to investigate cortical processing in migraine patients. One such approach uses stimulus-state high-density EEG analysis, which can comprehensively assess cortical activity without relying on specific tasks. Furthermore, recent studies have investigated the spatial coherence of different frequency bands in migraine patients, offering valuable insights into cortical processing abnormalities. These advancements can enhance our understanding of migraine pathophysiology and provide a more comprehensive picture of cortical dynamics in individuals with migraines [13].
We used HD-EEG to look into neural activity problems in the cortex of people who have migraines during the interictal phase of the migraine. Our primary focus was to analyze the response to SSVEP stimuli within the 4-6 Hz frequency range. Our main objective was to identify the most plausible explanation for these abnormalities by examining various clinical manifestations, including unsynchronized brain areas. Moreover, our objective was to broaden the scope of our electrophysiological inquiries into functional connectivity and reactivity in migraine by examining distinctions between two distinct phenotypes of migraine: individuals with MWA and individuals with MWOA along two primary axes.
The first axis of our study involves investigating differences in specific frequency bands between individuals with MWA and those with MWoA, compared to a control group (HC). Meanwhile, the second axis focuses on examining coherence over time during repeated visual stimulation, with particular emphasis on comparing the responses of Block 1 and Block 6 in migraineurs.
To do this, we did a full and detailed study of cortical coherence, looking at how the brains of these migraine subgroups and a group of HCs worked. This approach enhances our understanding of the neural underpinnings of different migraine subtypes and how they respond uniquely to visual stimuli, thus contributing to a more comprehensive comprehension of the pathophysiology of migraines. These findings can inform targeted therapeutic interventions for managing migraines effectively.
Our study provides strong evidence supporting the hypothesis that individuals with migraines have an overly active regulatory mechanism, rendering them susceptible to instability and heightened sensitivity to environmental factors. This regulatory mechanism leads to a reduction in coherence among brain areas at migraineurs, exhibiting a clear and significant slope during repeated stimulation over time, with particularly pronounced effects observed in individuals with MWA compared to those with MWoA.
These findings align with current theories proposing the role of dysfunctional subcortical structures in the pathophysiology of migraines. To be more specific, our observations show a significant drop in the coherence of alpha-band neural activity within the frontal clusters of the cortex. This means that synapses in these brain areas are not working as well as they should. Additionally, our spatial coherence analysis revealed that individuals diagnosed with MWA exhibited a more pronounced decrease in alpha-band spatial coherence in response to visual stimuli than those diagnosed with MWoA. This approach enhances our understanding of the neural underpinnings of different migraine subtypes and how they respond uniquely to visual stimuli, thus contributing to a more comprehensive comprehension of the pathophysiology of migraines. These findings can inform targeted therapeutic interventions for managing migraines effectively.
The study comprised a cohort of 22 individuals diagnosed with migraine, with an average age of 29±1. The sample was divided into two groups: MWA, consisting of 13 participants, 7 of whom were female, and MWoA, consisting of 9 participants, 5 of whom were female. The study was conducted at the Al-Ahram laboratory [29]. The study's HC group comprised 19 participants with a mean age of 27±1, and 8 were female. Patient records were examined to collect data on diverse clinical variables, including the frequency, duration, and length of migraine attacks. One crucial requirement for participation in the study was that participants were required to be devoid of migraine episodes for a minimum of three consecutive days before and following the recording sessions.
This condition was verified by employing headache diaries and interviews done either by telephone or email communication. The rationale behind selecting a 3-day interval was to prevent the unintended inclusion of persons suffering a migraine episode during this period by the criteria outlined in the International Classification of Headache Disorders. A total of two participants were eliminated from the study due to experiencing a migraine episode three days after their recording session. The primary emphasis was documenting participants' behavior during periods of freedom from migraines (interictal). Each participant was compensated with $10 and provided a comprehensive explanation of the study, followed by the collection of written informed consent (Table 1).
Table 1. The clinical and demographic characteristics of the healthy controls (HC) and the entire groups of patients with migraine with aura (MWA) and migraine without aura (MWoA) are depicted. The data are presented as mean ± standard deviation (SD)
|
Demographici Data and Clinicali Characteristics |
HC (n=27) |
MWA (n=13) |
MWoA (n=19) |
|
Women |
81 |
171 |
151 |
|
Age1(years) |
27±11 |
128±11 |
130±11 |
|
Duration1of migraine1 history (years)1 |
/ |
115.2±8.1 |
114.1±2.31 |
|
Attack 1frequency/month (n) |
/ |
12.8±2.1 |
12.1±1.21 |
|
Attack 1duration (hours) |
/ |
128.8±19.71 |
124.6±20.31 |
|
Days since the last migraine attack1 |
/ |
114.7±18.11 |
119.9±17.11 |
2.2 The procedures
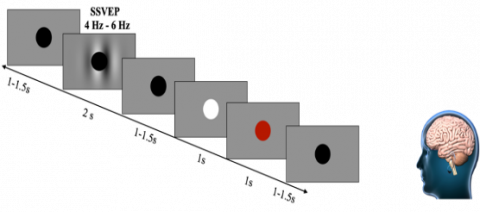
During the recording session, participants were instructed to maintain visual fixation on the central black point. A total of six blocks, each lasting two minutes, were recorded, resulting in a cumulative duration of 12 minutes. A self-paced rest period was taken between each block. The sequencing of the visual and aural recordings was counterbalanced across the subjects. In all recordings, as illustrated in Figure 1, stimuli were presented for a duration of two seconds. Prior to and following the presentation of stimuli, a gray screen with a fixation cross was displayed, creating an inter-stimulus interval ranging from 1 to 11.5 seconds. The timing of the inter-stimulus interval was randomized using a uniform distribution.
Figure 1. Steady-state visually evoked potentials (SSVEP) were measured utilizing a fixation black circle presented for 2 seconds, followed by an inter-stimulus1interval lasting 11-1.5 seconds
The participants were instructed to disregard the stimuli instead of focusing on the fixation circle. Participants were instructed to respond by pressing the spacebar when the cross stimulus was shown for 0.1 seconds and appeared white. The occurrence of this stimulus was randomized and seen in 10% of the total trials. In cases where the subject failed to answer, a visual cue in the form of a red fixation cross was presented for 0.1 seconds. The experiment consisted of four sets of 50 trials, with each set containing 25 trials of stimuli at a frequency of 4Hz and 25 trials at a frequency of 6Hz. Within each set, the sequence of stimulation frequencies was randomized. Every trial block lasted for three minutes, resulting in each participant providing six minutes of EEG data for both the auditory and visual conditions [13].
2.3 EEG capture
For high-density coverage of the central occipital, parietal, and frontal areas, a high-density electroencephalogram (EEG) with 124 electrodes and a gap of 14 millimeters between each pair was used. To record EEG data, a BioSemi Active Two system was used (BioSemi, Amsterdam, Netherlands). After that, digitizing is used to do a 124-bit A/D conversion on the data to digitize it. The patient had four extra electrodes placed around their eyes so that electrooculography (EOG) signals could be detected. The CMS1 and DRL1 electrodes offered by BioSemi can be operated online.
2.4 Steady-state visually evoked potentials
SSVEP stimulation was created and displayed during the experiment using 1Psychtoolbox coupled to 1MATLAB. Participants adjusted to ambient room lights for 10 minutes before SSVEP recordings. Gratings with contrast alternated at 4Hz and 6Hz according to Eq. (1) for 2 seconds, followed by an inter-stimulus interval of 1 to 1.5 seconds to obtain a steady pupillary diameter. A 5 cd/m2 brightness field surrounded the TV monitor in an acoustically isolated room with mute lighting. The cortical response was divided into six successive blocks, each containing 100 sweeps (lasting 200ms), with at least 95 artifact-free sweeps in each block. Fixation was presented as a black circle in the center for 0.1-1.5 seconds, followed by a gray screen and a 4-6Hz stimulus for SSVEP (2 seconds). Subjects pressed the spacebar when the circle flashed white for 0.1 seconds. Responses greater than 1 seconds and those preceding the color change were excluded. The SignalTM software package version 4.1 collected and sampled 600 sequential sweeps. A low-pass digital filter (4000Hz and 35Hz) was applied. The average responses for each block were computed using SignalTM software.
$\begin{aligned} L(X, Y)=L o[1+ & C \exp \left(-\frac{(X-X)^2}{2 \sigma x s^2}\right. \left.-\frac{(Y-Y)^2}{2 \sigma y s^2}\right) \sin \left(2 \pi f s\left(x-x_s\right)+\emptyset\right]\end{aligned}$ (1)
To handle artifacts, signals with an amplitude greater than 90% of the ADC range were automatically rejected using SignalTM's artifact rejection tool, which also involved visual inspection. This approach ensured severe artifacts were removed without systematically deleting any signals. Linear DC drift, eye movement, and blink corrections were conducted offline for the evoked potential signal.
2.5 Response time
In the initial phase, we conducted an analysis of reaction times (RT) concerning the response to the color1change at fixation. Trials with RTs exceeding 1 second or those lacking a response, amounting to 12% of the total trials, were excluded. This exclusion comprised 4% of trials for MWA and 6% for MWoA, as well as 14% of control trials. Importantly, the proportion of excluded trials was determined to be statistically independent of the participant group, whether migraineurs1or controls (P>0.1, Chi-square test of independence) [30]. Additionally, 0.2% of trials, where RTs preceded the color change, potentially indicating anticipatory behaviour, were also excluded. Subsequently, the remaining1RTs for each participant were averaged for each visual and stimulation frequency (4 and 6 Hz).
2.6 Pre-processing
The EEG data underwent meticulous pre-processing using MATLAB, EEGLAB, and ERPLAB toolboxes. The steps involved were as follows: (1) Offline re-referencing of EEG data to the average of the two mastoid electrodes and applying a zero-phase Butterworth filter to constrain signal frequency between 0.1 and 100 Hz. (2) Visual identification and interpolation of noisy channels, accounting for approximately 0.95% in the migraine group and 0.3% in the control group. (3) Utilizing independent component analysis for the detection and removal of eye-related artifacts, including blinks, horizontal eye movements, and heartbeat. (5) Extracting the initial 2 seconds after stimulus onset for visual trials. (6) Applying zero-phase Kaiser bandpass filters to these 2-second intervals to derive five frequency bands: delta (0.5-3 Hz), theta (4-7Hz), alpha (8-12Hz), beta (12-30Hz), and gamma (30-100Hz).
Despite the common use of a lowpass filter with a cutoff frequency of 30 Hz for noisy EEG data, we retained the high-frequency gamma band due to the Biosemi Active Two systems’ characteristics, which can tolerate high electrode impedances. Furthermore, participants were seated within a Faraday cage during EEG recording to minimize electromagnetic interference, and noisy channels were addressed through interpolation, as mentioned in Step 2 of the pre-processing procedure.
2.7 The coherence inter-intra hemispheric
To construct a coherence map, we computed the mean of the absolute values of the estimated PCCs over a two-second window. We then classified the PCCs according to the length of the corresponding electrode links on a 2D electrode map. We assumed that the horizontal and vertical inter-electrode distances were identical for adjacent electrode pairs (except for the gaps between the frontal and parietal clusters), and we used this distance as the unit for calculating the IED. We distinguished four IED categories (IED 1-4) based on different intervals of electrode link lengths (IED1 21-40, IED2 41-60, IED3 61-80, and IED4⩾80). We discarded links with the shortest length (20) to avoid spurious high correlations among nearby electrodes. For each electrode cluster, we derived two metrics: inter-hemispheric PCC, which compares electrodes located on opposite hemispheres, and intra-hemispheric PCC, which compares electrodes located on the same hemisphere. We calculated the mean of these metrics for each link length [13].
2.8 Analyses of statistics
The data were analyzed and charted using IBM SPSS 26.0 and Microsoft Excel 2019. Across multiple trials, the average response time of each participant was computed based on the SSVEP frequencies (4 and 6 Hz). These factors were then utilized in an ANOVA with MWA, MWoA, and HC as the between-subject variables. The results indicated that migraine patients exhibited significantly faster reflexes and response times (average=450ms) in both the MWA and MWoA groups (average=455ms) compared to the HC group (average=530ms). This finding suggests a main effect of group (P<0.001) and significant group effects for MWA (P<0.0009) and MWOA (P<0.001). We conducted normality assessments using the Kolmogorov-Smirnov and Shapiro-Wilk tests, revealing non-normal distribution patterns across blocks and groups. Additionally, normal distribution was confirmed (P>0.5), and the assumption of homoscedasticity was satisfied (P>0.2). Two separate six-way mixed-model ANOVAs were performed for EEG coherence measurements for each stimulation frequency (4 and 6 Hz).
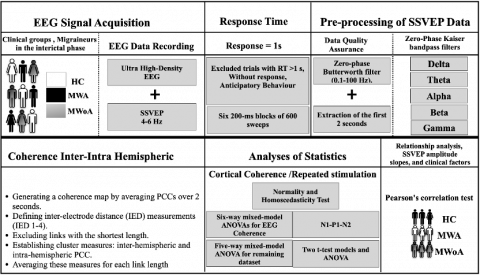
As can be seen in Figure 2, the ANOVAs encompassed various factors, including frequency bands (delta, theta, alpha, beta, and gamma), IED (21-40, 41-60, 61-80, and 81), two levels of stimulation, and eight spatial1clusters (occipito-parietal, left and right occipital, parietal, and frontal). Additionally, a five-way mixed-model ANOVA was performed on the remaining dataset. This analysis integrated four within-subject factors (EEG frequency bands, IED, spatial clusters, and hemisphere) and included the group as a between-subjects factor. The sample size was sufficiently large to detect statistically significant interactions. To find out how repeated stimulation affected coherence, two t-test models and an ANOVA were used to make meaningful comparisons. Tukey's HSD was then used for post hoc testing. ANOVA was also applied to assess slope, with post hoc analysis using Tukey tests. Additionally, partial eta squared (η²) and effect size (ηp²) were employed for further evaluation. Pearson's correlation test assessed SSVEP amplitude slopes and clinical factors. The dataset underwent a hyperbolic transformation (HP) to address the unmet assumptions before conducting a coherence analysis.
Figure 2. Block diagram of the study
3.1 Frequency bands and electrode links affect spatial coherence
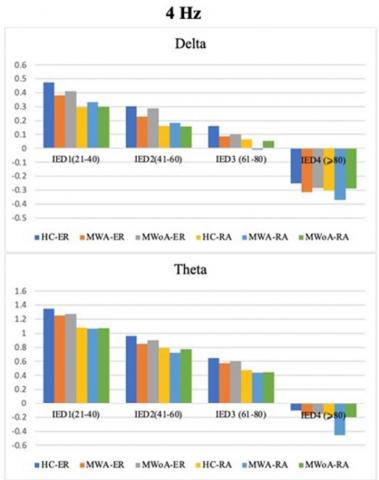
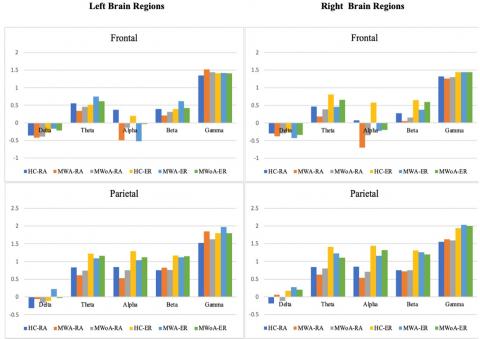
This section of the study involved investigating and comparing the effects of different electrode connections and frequency ranges on the spatial coherence of individuals with MWA and MWOA compared to healthy controls. The results, presented in (left graphs in Figure 3), illustrate the spatial coherence values obtained from the 4 Hz SSVEP stimulation frequency range, considering IED across five frequency bands and hemispheres (intra/inter), as well as groups (i.e., the four-way interaction of group, hemisphere, frequency bands, and IED).
The Hyperbolic transformation (HP)(RA= intra/ RE=inter)
The Hyperbolic transformation (HP)(RA= intra/ RE=inter)
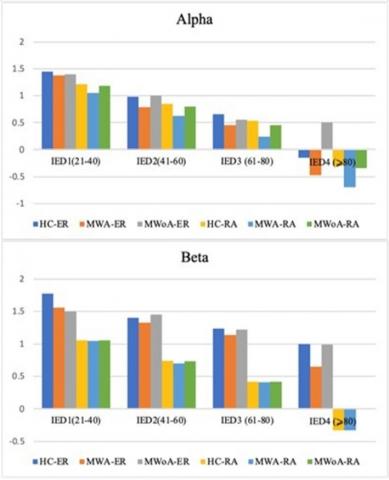
Figure 3. Analyzes the four-way coherence1interaction between group, hemispheres, frequency1bands, and inter-electrode distance (IED) about a 4-6Hz visual stimulation frequency range. It aims to compare spatial coherence in individuals with (MWA), (MWoA), and (HC)
Compared to HC, both individuals with MWA and MWOA demonstrated a significant decrease in spatial coherence within the alpha frequency band during visual stimulation at IED 3 (P<0.03.5; MWA=-0.098±0.046), (P<0.04; MWOA=-0.089±0.046), and (HC=-0.198±0.035). This reduction in spatial coherence was observed for both long inter- and intra-hemisphere connections.
In this study, the spatial coherence values for the SSVEP stimulation frequency of 61Hz were analyzed. The examination considered each of the five frequency bands, hemisphere (intra/inter), and groups1(examining1the four-way interaction1of group,1hemisphere, frequency bands, and IED). The obtained results were then compared to those of the control group. The findings revealed that individuals with migraines demonstrated significantly lower spatial coherence during visual1stimulation at a frequency of 6 Hz, particularly in the alpha frequency band, specifically for long inter- and intra-hemisphere connections (refer to Figure 3 on the right).
Generally, the study found that individuals experiencing MWA exhibited a notable decrease in spatial1coherence1within the alpha1frequency band when inter-electrode distances were long. The study found that during visual stimuli, individuals with MWoA exhibited a lower level of spatial coherence compared to healthy controls (HC), albeit to a minor extent, for both 4 and 6Hz stimulation frequencies. The present study aimed to investigate the coherence1differences for each spatial cluster at each electrode link to identify the cluster or clusters that exhibit significant1group differences1in long inter-electrode distances, as previously observed.
The results presented in Figure 3 illustrate spatial coherence values corresponding to a visual stimulation frequency of 4-6 Hz concerning IED. These values were analyzed for each of the eight spatial clusters,1hemisphere (intra/inter), and1groups, taking into account the five-way interaction1of the group, IED, spatial1clusters, hemisphere, and modalities.
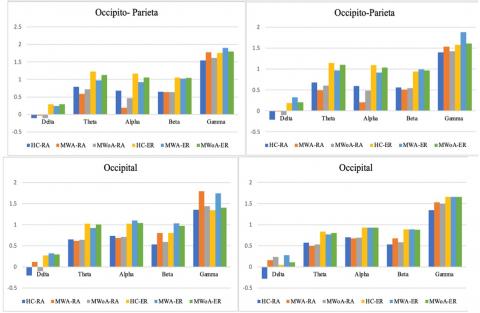
3.2 The variation of coherence with electrode links and spatial clustering at 4-6hz
The primary objective of the current study was to examine coherence1differences for each spatial1cluster at each electrode link in order to identify clusters that display significant group differences in1long inter-electrode1distances, as observed1in previous studies.
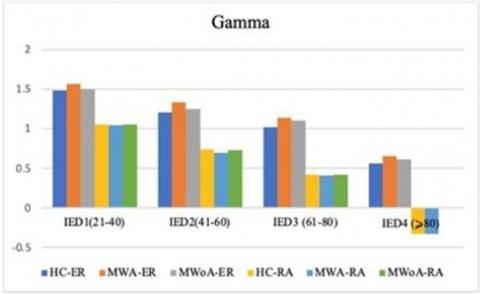
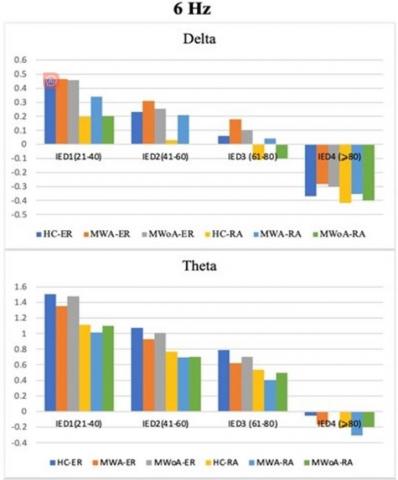
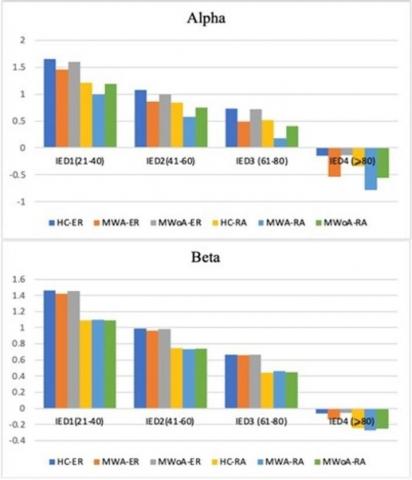
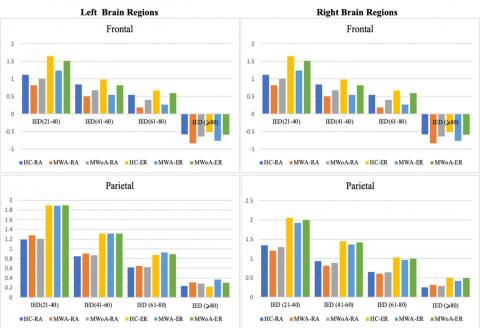
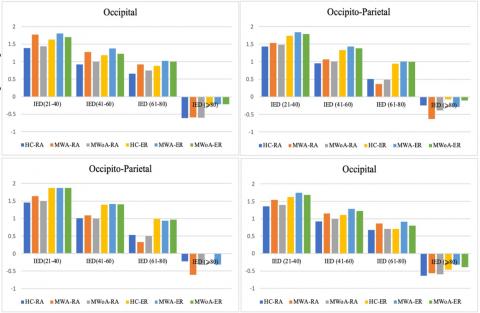
The results, as portrayed in Figure 4 and Figure 5, depict spatial coherence values associated with a visual1stimulation frequency of 4-6Hz concerning IED for each of the1eight spatial clusters. This analysis considered the hemisphere (intra/inter), and groups, taking into account the five-way interaction of the group, IED, spatial1clusters, hemisphere, and modalities.
In the context of a 4Hz visual stimulation frequency, the MWA group demonstrated a statistically important reduction in spatial coherence compared to the HC group. Similarly, albeit with a lesser degree of significance, the MWoA group showed a reduction in long inter-hemispheric connections ranging from 61–80 IED in both frontal clusters (P<0.04; MWA=0.256±0.079, P<0.04; MWoA=0.260±0.08, and P<0.05, HC=0.55±0.054). The study also observed variations in the right frontal.
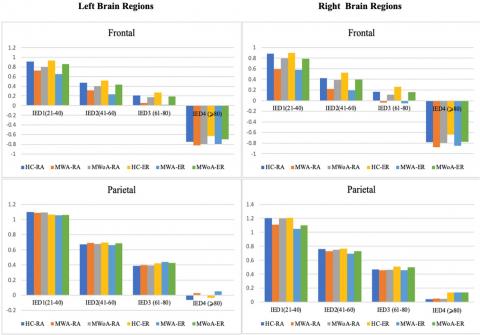
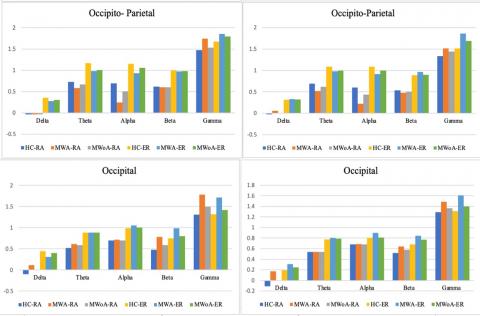
Cluster1regarding short-and1medium-length inter-hemisphere1connections with an IED ratio of 21-60 (P<0.04; MWA=0.715±0.079, P<0.05; MWoA=0.721±0.08, and P<0.05, HC=1.020±0.065). The left frontal cluster too showed variations in short and long intra-hemisphere connections of IED 21–80 (P<0.05; MWA=0.366±0.065, MWOA=0.375±0.059, and HC=0.681±0.047). At a stimulation frequency of 6Hz, as depicted in Figure 6, the study found that MWA individuals exhibited reduced spatial coherence in certain brain regions compared to MWoA and control groups. Notably, in the alpha frequency range, both within and between the frontal clusters, spatial coherence was considerably lower in migraineurs (P<0.0001; MWA=-0.188 ±0.043, MWoA=-0.171±0.045, HC=0.333±0.038). The migraine group also showed notably lower spatial coherence1 in the parietal1 and occipito-parietal1 clusters1 for intra-hemisphere connections in the alpha frequency band (P<0.04; MWA=0.355±0.049, MWoA=0.365±0.045, and HC=0.615±0.036). Finally, in the theta frequency band, migraineurs exhibited differences in spatial coherence compared to controls.
Hemisphere spatial coherence (ER=inter/RA=intra)
Figure 4. The study evaluates the spatial coherence between different factors, such as group, link lengths, spatial clusters, hemispheres, and stimulation during 4 Hz stimulation. The aim is to assess the spatial coherence among individuals with (MWA), (MWoA), and (HC)
The Hyperbolic transformation (HP) (RA=intra/RE=inter)
Figure 5. The study evaluates the spatial coherence between different factors, such as group, link lengths, spatial clusters, hemispheres, and stimulation during 6 Hz stimulation. The aim is to assess the spatial coherence among individuals with (MWA), (MWoA), and (HC)
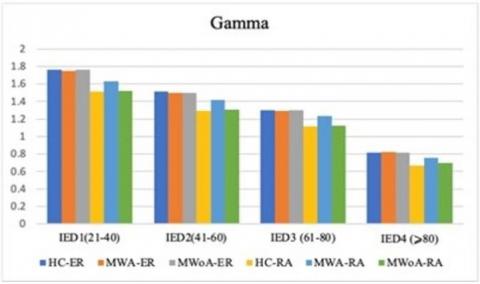
Lower spatial coherence in inter-hemisphere connections within the left frontal cluster (P<0.05; MWA=0.425±0.079, MWoA=0.415±0.071, HC=0.651±0.073). Moreover, MWA displayed less spatial coherence in certain brain regions compared to MWoA and HC. Specifically, MWA exhibited significantly lower spatial coherence in the gamma frequency band for intra-hemisphere connections in the right parietal and occipital clusters (P<0.04; MWA=0.073±1.176, MWoA=1.334±0.075, HC=1.110±0.061). Additionally, MWA demonstrated lower spatial coherence in the gamma frequency band for inter-hemisphere connections in the right occipital cluster (P<0.04; MWA=1.333±0.101, MWoA=1.323±0.090, HC=1.445±0.081).
In Figure 7, the delta frequency band, MWA exhibited lower spatial coherence for intra-hemisphere connections in the left occipital cluster (P<0.03; MWA=0.209±0.122, MWoA=0.216±0.088, HC=0.285±0.090) and for inter-hemisphere connections in the right parietal cluster (P<0.03; MWA=0.247±0.085, MWoA=0.259±0.080, HC=0.320±0.073).
Importantly, when analyzing the alpha frequency band, the study clarified that individuals experiencing migraineurs of both types displayed reductions in inter-and intra-hemisphere coherence within the frontal clusters. Additionally, these individuals exhibited decreased intra-hemisphere coherence in the parietal and occipito-parietal clusters for the same frequency band. It was observed that there was a significant difference in MWA. At the same time, it was demonstrated a slight decrease in MWoA. These findings were consistent regardless of the modality and frequency of stimulation used in the study.
The Hyperbolic transformation (HP) (RA=intra/RE=inter)
Figure 6. At 4 Hz stimulation, analyzing the 1four-way coherence interaction involving group,1hemisphere, frequency1bands, and spatial1clusters. Its primary aim is to compare spatial coherence among individuals with (MWA), (MWoA), and (HC)
The Hyperbolic transformation (HP) (RA=intra/RE=inter)
Figure 7. At 6 Hz stimulation, analyzing the1four-way coherence interaction involving group, hemisphere, frequency1bands, and spatial clusters. Its primary aim is to compare spatial coherence among individuals with (MWA), (MWoA), and (HC)
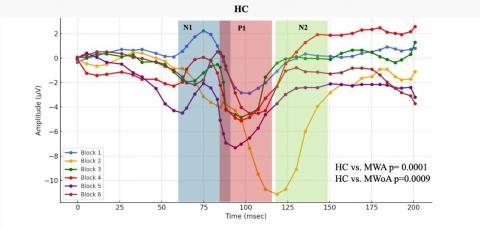
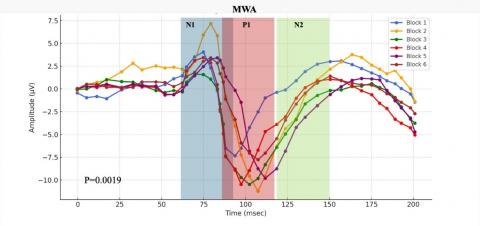
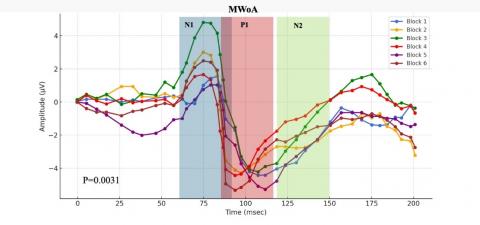
3.4 Repetitive stimulation influence on cortical coherence in migraine patients
This section conducts a comprehensive analysis of the effects of repetitive SSVEP stimulation, particularly within the 4-6Hz frequency range, on cortical coherence dynamics in individuals with migraine pathologies. The investigation examines the temporal variations in coherence patterns elicited by visual stimuli, focusing on the transition phase from the initial Block 1 to the subsequent Block 6. This analytical endeavor is confined to a cohort of individuals diagnosed with migraine disorders.
Employing paired T-tests, the research compares1N1-P1 and P1-N2 components across different cohorts, namely HC, MWA, and MWoA. The analysis reveals distinct patterns, especially in the N1-P1 condition, thus identifying MWA as a salient candidate for diagnostic applications. Findings show that certain parts of an electroencephalogram (EEG) can help doctors tell the difference between different types of migraines.
In this study, we look at how external sensory input from repetitive SSVEP stimulation affects changes in cortical coherence. This helps us answer the important question of whether this kind of stimulation can change neural connectivity and, in turn, change the unique features of different types of migraines. By categorizing the migraine population into those with aura (MWA) and those without aura (MWoA), the study assesses the statistical significance of the observed coherence changes.
After a thorough statistical analysis of the data, the MWA subgroup showed coherence changes, resulting in a p-value of 0.019, indicating a notable response to repetitive SSVEP stimulation. Similarly, the MWoA subgroup displayed an even more pronounced statistical response, with a p-value below 0.031, suggesting substantial alterations in cortical coherence patterns following the same SSVEP stimulation protocol, as can be seen in Figure 8.
Figure 8. In response to visual stimuli, coherence patterns undergo temporal variations
Representative SSVEP recordings (filtered with a low-pass filter at 35 Hz) from individuals in the interictal phase, including Healthy Controls (HC), Migraine Patients without aura (MWoA), and Migraine Patients with aura (MWA), were analyzed. We conducted comparisons by aggregating data from every three consecutive blocks, comprising 100 averaged responses each.
These study outcomes elucidate the complex relationship between external sensory stimuli and subsequent dynamic brain responses observed in discrete subpopulations affected by migraines. The subgroup labeled as MWA displays a statistically significant and markedly enhanced response to SSVEP activation. This contributes to a better understanding of the distinct symptoms and underlying pathophysiological mechanisms inherent in various migraine subtypes. In conclusion, the novel concepts introduced herein hold promise for advancing methodologies tailored to address the unique challenges faced by diverse cohorts of individuals suffering from this condition, thereby improving the clinical management of migraines.
The objective of this study was to comprehensively evaluate cortical dynamics in individuals with MWA and MWoA, in comparison to healthy controls, during sensory stimulation. The researchers delved into the spatial coherence (connectivity) within different frequency bands of EEG signals, utilizing a specialized ultra-high-density1EEG system. The responses to visual stimulation were thoroughly analyzed, taking into account both normalized and1unnormalized signals. Comparisons were made within and between hemispheres, considering two stimulation1frequencies (41Hz and 61Hz), and the distance between electrodes. Several significant findings were observed as a result of this comprehensive investigation. The individuals who suffer from migraines exhibited a notably quicker response time when presented with the fixation point compared to the control group. The observed phenomenon of heightened visual-evoked EEG responses to stimuli1such as checkerboards, repetitive flashes, or pattern reversal stimulation in individuals with migraines may be attributed to the hyper-responsiveness of the cortex [31, 32]. Numerous studies have provided evidence suggesting that a deficiency in neural habituation to repetitive stimuli is responsible for this heightened responsiveness [33].
Discrepancies in spatial1coherence networks were identified between individuals afflicted with migraines and those without headache symptoms, as evidenced by recordings obtained during sensory stimulation and resting-state measurements. This observation bears significance, particularly in light of prior studies that have similarly highlighted aberrant functional connectivity within the migraine-affected population during periods of inactivity [5, 34, 35]. The disrupted connectivity observed in the recordings during sensory stimulation aligns with the increased sensory sensitivities commonly associated with migraines, even during the interictal period [16, 24, 34-36]. Additionally, the spatial coherence networks displayed similarities across visual-evoked recordings, indicating altered cortical dynamics across various modalities in migraine with and without aura. While subtle variations in the functional connectivity topography were noted during visual stimulation, further investigation into the differences across sensory modalities in migraines could contribute to a better understanding of the similarities and distinctions between modalities in this condition [23, 24].
In our investigation of visual1evoked signals across the five EEG1frequency1bands, our primary findings focused on spatial coherence, which measures the synchronization of electrocortical activities. Our analysis revealed a significant reduction in spatial coherence in the alpha-band neural activities during visual stimuli in individuals with MWA compared to those with MWoA and the control group [5, 37, 38]. This distinct pattern was particularly noticeable across various distances1between the frontal1clusters of scalp electrodes and other clusters for both inter-and intra-hemisphere connections. The observed desynchronization1of connections, as indicated by lower1coherence in the alpha band, suggests increased1functional activity and is consistent with the hyper-responsiveness of the cortex in individuals with migraines [39-42]. Additionally, our examination revealed a gradual increase in spatial coherence amplitude at repetitive stimulus presentations of significance, this progression showed a distinct decline from Block 1 to Block 6, especially discernible among (MWA) when compared to (MWoA) and (HC).
Undoubtedly, the absence of a scientifically established explanation for the neurological processes occurring in migraineurs' brains remains crucial to understanding the phenomenon at hand. One possible explanation for the desynchronization observed in migraines is the concept of thalamocortical dysrhythmia, which involves reduced1neural synchrony1across the1brain, particularly in low-frequency oscillations such as the theta range, due to underactivity in thalamic nuclei. Thalamocortical dysrhythmia has been proposed as a potential factor contributing to the cortical hyperresponsiveness and sensory disturbances observed in migraines [13, 43]. While this might partly be explained by thalamocortical dysrhythmia a disruption in brain rhythms, it's likely not the whole story. Other factors like increased brain cell excitability, neurotransmitter imbalances, brain structure changes, inflammation, and even genetics could also be playing a role. It seems that this loss of coherence is a complex puzzle, with many pieces contributing to the overall picture in migraine sufferers [44, 45].
However, the1desynchronization observed in the alpha band1signals during migraines contradicts previous reports of increased phase synchronization in the alpha band among patients1with interictal migraines and without aura. Individuals experiencing migraines without aura may exhibit distinct patterns of neural activity compared to those with aura [38].
Although it is widely regarded as a compelling scientific explanation, significant phenomena in the interictal phase were overlooked. Firstly, CSD is a propagating wave of depolarization characterized by a gradual (2-6 mm/min) spread through the membranes of both neuronal and glial cells. This depolarization inhibits cortical activity, which can persist for up to 30 minutes [46]. Secondly, a phenomenon known as habituation deficit refers to the decreased initial cortical responses to repetitive sensory stimulation in migraine patients. Unlike non-migraineurs who exhibit a gradual decrease in cortical responses after prolonged stimulation, migraine patients tend to lack habituation, increasing response amplitude as the stimulation continues [12, 47-49].
The pathophysiological mechanism that underlies habituation of visual evoked potentials (VEP) is not permanently affected by ictal events, regardless of the connection between ictal CSD and interictal VEP [33, 50, 51]. Migraineurs have more severe pathophysiological dysfunction because of genetic differences that cause cortical spreading depression, which makes meningeal nociception stronger. They are also affected by not getting used to being awake between ictal periods, which makes electrophysiological activity and perfusion less coherent [52].
These findings indicate that as the time between migraine attacks increases, the ability to inhibit and habituate to recurring stimuli diminishes. Our current data supports this observation. Psychophysical studies using the visual masking test have revealed a correlation between the inhibitory process and the number of days since the previous migraine attack. The magnocellular system, which processes transient visual inputs, prefers lower spatial frequencies. This preference may explain why individuals with migraines are more skilled at quickly identifying stimuli presented in rapid succession [53, 54].
Visual stimuli have been found to decrease the activity of GABAergic neurotransmitters in a concentration-dependent manner [55]. As a result, lactate levels in the occipital region of the brain in individuals with MWA are elevated in response to visual stimulation. This may be due to the biochemical connection between impaired inhibitory mechanisms and the downregulation of GABA activity induced by lactate in the occipital cortex. Higher levels of GABA have been associated with a greater burden of migraines [56].
The detection of anomalous electrophysiological activity in people suffering from migraines bears importance in both fundamental scientific research and pragmatic implementation. Exploration of alterations in cortical dynamics makes it possible to identify distinct neural patterns linked to various disorders [5]. The study has identified spatial coherence metrics that may function as diagnostic tools for detecting individuals who suffer from migraines. An example of this is the utilization of reduced connectivity within the theta frequency range, which has demonstrated efficacy in forecasting group affiliation through the implementation of a classifier. The observed decrease in connectivity is consistent with our research results. Furthermore, modifications in spectral power exhibit potential for forecasting the initiation of migraines [57]. Moreover, the practicality of conducting self-administered tests at home using a portable and economical EEG system is rising. Additional research on alterations in connectivity across the migraine cycle may facilitate the determination of the temporal occurrence of subsequent migraine episodes, thereby enhancing the precision of prophylactic therapeutic interventions [58, 59].
Our study's deep dive into the brain's workings during migraines could significantly change our approach to treatment. It suggests the possibility of customizing treatments to fit individual patients, particularly those experiencing aura, by zeroing in on the specific brain areas or pathways involved. This could revolutionize migraine care, leading to more precise and effective treatments, including potential new drugs aimed at the unique brain activity patterns we've discovered. Beyond medications, we're looking at innovative non-drug methods like brain training or neuromodulation to strengthen and correct brain connections. Our findings not only broaden our understanding of migraines but also pave the way for exciting, more effective treatment avenues. By identifying the unique brain dynamics in migraines, we're closer to unraveling the complex puzzle of their cause and progression. This insight is invaluable in crafting interventions that aim to lessen the severity of or perhaps even prevent migraines [57-63].
Techniques like transcranial magnetic stimulation (TMS) and transcranial direct-current stimulation (tDCS) are emerging as promising options to counteract the abnormal brain activity seen in migraine sufferers. These methods could disrupt the dysfunctional patterns and restore normal brain function. Ultimately, our research is guiding us toward a future where migraine treatments are not just reactive but proactive and personalized, offering new hope to those affected by this challenging condition [64-68].
This study has several limitations. First, we used EEG coherence to measure brain activity, but this method isn't perfect. We faced challenges like volume conduction, where brain signals spread and mix up, making it tricky to pinpoint exact activity sources. To tackle this, we used special filtering techniques to clear out the noise and get a clearer picture. Another issue was how the EEG's reference point can skew results, so we used a method that averages out all the signals, helping balance things out. Despite these efforts, it's important to remember that EEG coherence, while useful, has its limits and should be interpreted carefully. Secondly, high-density EEG electrodes focused on areas known for visual and auditory processing. While this was great for assessing responses to visual stimuli, it meant we might have missed some detail in other brain areas due to the limited 128 channels used. In the future, a more evenly distributed EEG setup could provide a fuller picture of brain activity. Additionally, examining how different brain regions interact naturally, especially during rest, could offer deeper insights into the heightened sensitivity seen in migraine sufferers, shifting from looking at isolated brain areas to viewing the brain as a whole, dynamic system.
In our study, we conducted a comprehensive analysis to investigate neural activity abnormalities in the cortical region of individuals with migraines during the inter-ictal phase. We specifically focused on the response to 4-6Hz SSVEP stimuli. We aimed to identify the most plausible explanation for these abnormalities by considering various clinical manifestations, including unsynchronized brain areas. To achieve this, we performed an extensive and intricate analysis of cortical coherence, comparing individuals with MWA and MWoA. Our findings support the idea that individuals with migraines exhibit an excessively active regulatory mechanism prone to instability, leading to increased sensitivity to environmental factors. These results align with current theories suggesting the involvement of dysfunctional subcortical structures in migraines. Specifically, we observed a significant decrease in alpha-band neural activity coherence in the frontal clusters of the cortex, indicating impaired synchrony in these brain regions. Moreover, our research indicates that migraine sufferers have overly sensitive response systems, possibly due to malfunctioning brain areas beneath the cortex. There's a significant reduction in alpha-wave activity in the frontal brain, suggesting less coordination in these areas. People with migraines and visual symptoms (aura) show a greater decrease (about 9.8%) in brain wave coherence in response to visual stimuli compared to those without aura (about 8.9%). Previous studies in this field consistently highlight the differences between the two types of headaches, encompassing cortical coherence and habituation [14]. These investigations provide evidence supporting the involvement of CSD with a complex relationship and incomprehensible coherence in migraine. One hypothesis suggests that CSD disrupts the typical coherence patterns among brain regions, resulting in abnormal functional connectivity and a deficit in habituation. This disruption contributes to the manifestation of migraine symptoms. Recent research reveals the impact of CSD on neurovascular coupling, leading to a loss of coherence between electrophysiological activity and perfusion [68]. Additionally, a rise in extracellular potassium concentration during a CSD wave has been observed. However, further research is necessary to fully comprehend the precise mechanisms underlying this complex relationship.
[1] Lauritzen, M. (1994). Pathophysiology of the migraine aura: the spreading depression theory. Brain, 117(1): 199-210. https://doi.org/10.1093/brain/117.1.199
[2] Tfelt-Hansen, P.C. (2010). History of migraine with aura and cortical spreading depression from 1941 and onwards. Cephalalgia, 30(7): 780-792. https://doi.org/10.1111/j.1468-2982.2009.02015.x
[3] Russell, M.B., Olesen, J. (1996). A nosographic analysis of the migraine aura in a general population. Brain, 119(2): 355-361. https://doi.org/10.1093/brain/119.2.355
[4] Brighina, F., Cosentino, G., Fierro, B. (2015). Is lack of habituation a biomarker of migraine? A critical perspective. The Journal of Headache and Pain, 16: 1-1. https://doi.org/10.1186/1129-2377-16-S1-A13
[5] Frid, A., Shor, M., Shifrin, A., Yarnitsky, D., Granovsky, Y. (2020). A biomarker for discriminating between migraine with and without aura: Machine learning on functional connectivity on resting-state EEGs. Annals of Biomedical Engineering, 48: 403-412. https://doi.org/10.1007/s10439-019-02357-3
[6] Mantegazza, M., Cestèle, S. (2018). Pathophysiological mechanisms of migraine and epilepsy: Similarities and differences. Neuroscience Letters, 667: 92-102. https://doi.org/10.1016/j.neulet.2017.11.025
[7] Sand, T., White, L.R., Hagen, K., Stovner, L.J. (2009). Visual evoked potential and spatial frequency in migraine: A longitudinal study. Acta Neurologica Scandinavica, 120: 33-37. https://doi.org/10.1111/j.1600-0404.2009.01211.x
[8] Sand, T., Zhitniy, N., White, L.R., Stovner, L.J. (2008). Visual evoked potential latency, amplitude and habituation in migraine: A longitudinal study. Clinical Neurophysiology, 119(5): 1020-1027. https://doi.org/10.1016/j.clinph.2008.01.009
[9] Wang, S., Ji, B., Shao, D., Chen, W., Gao, K. (2023). A methodology for enhancing SSVEP features using adaptive filtering based on the spatial distribution of EEG signals. Micromachines, 14(5): 976. https://doi.org/10.3390/mi14050976
[10] Wang, L., Han, D., Qian, B., Zhang, Z., Zhang, Z., Liu, Z. (2020). The validity of steady-state visual evoked potentials as attention tags and input signals: A critical perspective of frequency allocation and number of stimuli. Brain Sciences, 10(9): 616. https://doi.org/10.3390/brainsci10090616
[11] Lisicki, M., D'Ostilio, K., Coppola, G., Parisi, V. (2018). Brain correlates of single trial visual evoked potentials in migraine: More than meets the eye. Frontiers in Neurology, 9: 378434. https://doi.org/10.3389/fneur.2018.00393
[12] Abdulhussein, M.A., An, X., Alsakaa, A.A., Ming, D. (2022). Lack of habituation in migraine patients and Evoked Potential types: Analysis study from EEG signals. Journal of Information and Optimization Sciences, 43(4): 855-891. https://doi.org/10.1080/02522667.2022.2095958
[13] Chamanzar, A., Haigh, S.M., Grover, P., Behrmann, M. (2020). Abnormalities in cortical pattern of coherence in interictal migraine detected using ultra high-density EEG. MedRxiv, 2020-07. https://doi.org/10.1101/2020.07.17.20156299
[14] Abbas Abdulhussein, M., Alyasseri, Z.A.A., Mohammed, H.J., An, X. (2022). Lack of habituation in migraine patients based on high-density EEG analysis using the steady state of visual evoked potential. Entropy, 24(11): 1688. https://doi.org/10.3390/e24111688
[15] de Tommaso, M., Vecchio, E., Quitadamo, S.G., Coppola, G., Di Renzo, A., Parisi, V., Silvestro, M., Russo, A., Tedeschi, G. (2021). Pain-related brain connectivity changes in migraine: A narrative review and proof of concept about possible novel treatments interference. Brain Sciences, 11(2): 234. https://doi.org/10.3390/brainsci11020234
[16] Coutts, L.V., Cooper, C.E., Elwell, C.E., Wilkins, A.J. (2012). Time course of the haemodynamic response to visual stimulation in migraine, measured using near-infrared spectroscopy. Cephalalgia, 32(8): 621-629. https://doi.org/10.1177/0333102412444474
[17] Cucchiara, B., Datta, R., Aguirre, G.K., Idoko, K.E., Detre, J. (2015). Measurement of visual sensitivity in migraine: validation of two scales and correlation with visual cortex activation. Cephalalgia, 35(7): 585-592. https://doi.org/10.1177/0333102414547782
[18] Huang, J., Zong, X., Wilkins, A., Jenkins, B., Bozoki, A., Cao, Y. (2011). fMRI evidence that precision ophthalmic tints reduce cortical hyperactivation in migraine. Cephalalgia, 31(8): 925-936. https://doi.org/10.1177/0333102411409076
[19] Sun, R., Wong, W.W., Wang, J., Wang, X., Tong, R.K. (2021). Functional brain networks assessed with surface electroencephalography for predicting motor recovery in a neural guided intervention for chronic stroke. Brain Communications, 3(4): fcab214. https://doi.org/10.1093/braincomms/fcab214
[20] Bowyer, S.M., Okada, Y.C., Papuashvili, N., Moran, J.E., Barkley, G.L., Welch, K.M.A., Tepley, N. (1999). Analysis of MEG signals of spreading cortical depression with propagation constrained to a rectangular cortical strip: I. Lissencephalic rabbit model. Brain Research, 843(1-2): 71-78. https://doi.org/10.1016/S0006-8993(99)01892-2
[21] Bowyer, S.M. (2016). Coherence a measure of the brain networks: Past and present. Neuropsychiatric Electrophysiology, 2: 1-12. https://doi.org/10.1186/s40810-015-0015-7
[22] Chiarion, G., Sparacino, L., Antonacci, Y., Faes, L., Mesin, L. (2023). Connectivity analysis in EEG data: A tutorial review of the state of the art and emerging trends. Bioengineering, 10(3): 372. https://doi.org/10.3390/bioengineering10030372
[23] Ambrosini, A., Coppola, G., Iezzi, E., Pierelli, F., Schoenen, J. (2017). Reliability and repeatability of testing visual evoked potential habituation in migraine: A blinded case-control study. Cephalalgia, 37(5): 418-422. https://doi.org/10.1177/0333102416648656
[24] Haigh, S.M., Chamanzar, A., Grover, P., Behrmann, M. (2019). Cortical hyper‐excitability in migraine in response to chromatic patterns. Headache: The Journal of Head and Face Pain, 59(10): 1773-1787. https://doi.org/10.1111/head.13620
[25] Kropp, P., Gerber, W.D. (1998). Prediction of migraine attacks using a slow cortical potential, the contingent negative variation. Neuroscience Letters, 257(2): 73-76. https://doi.org/10.1016/S0304-3940(98)00811-8
[26] Kropp, P., Gerber, W.D. (1993). Is increased amplitude of contingent negative variation in migraine due to cortical hyperactivity or to reduced habituation?. Cephalalgia, 13(1): 37-41. https://doi.org/10.1046/j.1468-2982.1993.1301037.x
[27] Siniatchkin, M., Kropp, P., Gerber, W.D. (2001). Contingent negative variation in subjects at risk for migraine without aura. Pain, 94(2): 159-167. https://doi.org/10.1016/S0304-3959(01)00350-5
[28] Zhang, N., Pan, Y., Chen, Q., Zhai, Q., Liu, N., Huang, Y., Sun, T., Lin, Y., He, L., Hou, Y., Yu, Q., Li, H., Chen, S. (2023). Application of EEG in migraine. Frontiers in Human Neuroscience, 17: 1082317. https://doi.org/10.3389/fnhum.2023.1082317
[29] McAbee, G.N., Morse, A.M., Assadi, M. (2016). Pediatric aspects of headache classification in the international classification of headache disorders-3 (ICHD-3 beta version). Current Pain and Headache Reports, 20: 1-6. https://doi.org/10.1007/s11916-015-0537-5
[30] Pearson, K. (1900). X. On the criterion that a given system of deviations from the probable in the case of a correlated system of variables is such that it can be reasonably supposed to have arisen from random sampling. The London, Edinburgh, and Dublin Philosophical Magazine and Journal of Science, 50(302): 157-175. https://doi.org/10.1080/14786440009463897
[31] Aldrich, A., Hibbard, P., Wilkins, A. (2019). Vision and hyper-responsiveness in migraine. Vision, 3(4): 62. https://doi.org/10.3390/vision3040062
[32] Battista, J., Badcock, D.R., McKendrick, A.M. (2011). Migraine increases centre-surround suppression for drifting visual stimuli. PloS One, 6(4): e18211. https://doi.org/10.1371/journal.pone.0018211
[33] Datta, R., Aguirre, G.K., Hu, S., Detre, J.A., Cucchiara, B. (2013). Interictal cortical hyperresponsiveness in migraine is directly related to the presence of aura. Cephalalgia, 33(6): 365-374. https://doi.org/10.1177/0333102412474503
[34] Cao, Z., Lin, C.T., Chuang, C.H., Lai, K.L., Yang, A.C., Fuh, J.L., Wang, S.J. (2016). Resting-state EEG power and coherence vary between migraine phases. The Journal of Headache and Pain, 17: 1-9. https://doi.org/10.1186/s10194-016-0697-7
[35] Haigh, S.M., Karanovic, O., Wilkinson, F., Wilkins, A.J. (2012). Cortical hyperexcitability in migraine and aversion to patterns. Cephalalgia, 32(3): 236-240. https://doi.org/10.1177/0333102411433301
[36] Huang, J., Cooper, T.G., Satana, B., Kaufman, D.I., Cao, Y. (2003). Visual distortion provoked by a stimulus in migraine associated with hyperneuronal activity. Headache: The Journal of Head and Face Pain, 43(6): 664-671. https://doi.org/10.1046/j.1526-4610.2003.03110.x
[37] Koeda, T., Takeshima, T., Matsumoto, M., Nakashima, K., Takeshita, K. (1999). Low interhemispheric and high intrahemispheric EEG coherence in migraine. Headache: The Journal of Head and Face Pain, 39(4): 280-286. https://doi.org/10.1046/j.1526-4610.1999.3904280.x
[38] De Tommaso, M., Stramaglia, S., Marinazzo, D., Trotta, G., Pellicoro, M. (2013). Functional and effective connectivity in EEG alpha and beta bands during intermittent flash stimulation in migraine with and without aura. Cephalalgia, 33(11): 938-947. https://doi.org/10.1177/0333102413477741
[39] Markovska-Simoska, S., Pop-Jordanova, N., Pop-Jordanov, J. (2018). Inter-and intra-hemispheric EEG coherence study in adults with neuropsychiatric disorders. Prilozi, 39(2-3): 5-19. 10.2478/prilozi-2018-0037
[40] Brookes, M.J., Gibson, A.M., Hall, S.D., Furlong, P.L., Barnes, G.R., Hillebrand, A., Singh, K.D., Holliday, I.E., Francis, S.T., Morris, P.G. (2005). GLM-beamformer method demonstrates stationary field, alpha ERD and gamma ERS co-localisation with fMRI BOLD response in visual cortex. Neuroimage, 26(1): 302-308. https://doi.org/10.1016/j.neuroimage.2005.01.050
[41] Singh, K.D., Barnes, G.R., Hillebrand, A. (2003). Group imaging of task-related changes in cortical synchronisation using nonparametric permutation testing. Neuroimage, 19(4): 1589-1601. https://doi.org/10.1016/S1053-8119(03)00249-0
[42] Haigh, S.M., Cooper, N.R., Wilkins, A.J. (2018). Chromaticity separation and the alpha response. Neuropsychologia, 108: 1-5. https://doi.org/10.1016/j.neuropsychologia.2017.11.020
[43] De Tommaso, M., Ambrosini, A., Brighina, F., Coppola, G., Perrotta, A., Pierelli, F., Sandrini, G., Valeriani, M., Marinazzo, D., Stramaglia, S., Schoenen, J. (2014). Altered processing of sensory stimuli in patients with migraine. Nature Reviews Neurology, 10(3): 144-155. https://doi.org/10.1038/nrneurol.2014.14
[44] Coppola, G., Di Renzo, A., Tinelli, E., Petolicchio, B., Parisi, V., Serrao, M., Porcaro, C., Fiorelli, M., Caramia, F., Schoenen, J., Piero, V.D., Pierelli, F. (2021). Thalamo-cortical networks in subtypes of migraine with aura patients. The Journal of Headache and Pain, 22(1): 58. https://doi.org/10.1186/s10194-021-01272-0.
[45] Hodkinson, D.J., Wilcox, S.L., Veggeberg, R., Noseda, R., Burstein, R., Borsook, D., Becerra, L. (2016). Increased amplitude of thalamocortical low-frequency oscillations in patients with migraine. Journal of Neuroscience, 36(30): 8026-8036. https://doi.org/10.1523/JNEUROSCI.1038-16.2016
[46] Iadecola, C. (2002). From CSD to headache: A long and winding road. Nature Medicine, 8(2): 110-112. https://doi.org/10.1038/nm0202-110
[47] de Tommaso, M., Guido, M., Libro, G., Losito, L., Difruscolo, O., Sardaro, M., Puca, F.M. (2004). Interictal lack of habituation of mismatch negativity in migraine. Cephalalgia, 24(8): 663-668. https://doi.org/10.1111/j.1468-2982.2004.00731.x
[48] Bednář, M., Kubová, Z., Kremláček, J. (2014). Lack of visual evoked potentials amplitude decrement during prolonged reversal and motion stimulation in migraineurs. Clinical Neurophysiology, 125(6): 1223-1230. https://doi.org/10.1016/j.clinph.2013.10.050
[49] Buonfiglio, M., Toscano, M.A.S.S.I.M.I.L.I.A.N.O., Puledda, F., Avanzini, G., Di Clemente, L., Di Sabato, F., Di Piero, V. (2015). Lack of habituation of evoked visual potentials in analytic information processing style: Evidence in healthy subjects. Neurological Sciences, 36: 391-395. https://doi.org/10.1007/s10072-014-1962-7
[50] Wei, H.L., Zhou, X., Chen, Y.C., Yu, Y.S., Guo, X., Zhou, G.P., Zhou, Q.Q., Qu, L.J., Yin, X., Li, J., Zhang, H. (2019). Impaired intrinsic functional connectivity between the thalamus and visual cortex in migraine without aura. The Journal of Headache and Pain, 20: 1-9. https://doi.org/10.1186/s10194-019-1065-1
[51] Coppola, G., Parisi, V., Di Lorenzo, C., Serrao, M., Magis, D., Schoenen, J., Pierelli, F. (2013). Lateral inhibition in visual cortex of migraine patients between attacks. The Journal of Headache and Pain, 14: 1-11. https://doi.org/10.1186/1129-2377-14-20
[52] Chang, J.C., Shook, L.L., Biag, J., Nguyen, E.N., Toga, A.W., Charles, A.C., Brennan, K.C. (2010). Biphasic direct current shift, haemoglobin desaturation and neurovascular uncoupling in cortical spreading depression. Brain, 133(4): 996-1012. https://doi.org/10.1093/brain/awp338
[53] Carneiro-Nascimento, S., Levy, D. (2022). Cortical spreading depression and meningeal nociception. Neurobiology of Pain, 11: 100091. https://doi.org/10.1016/j.ynpai.2022.100091
[54] Shepherd, A.J., Wyatt, G., Tibber, M.S. (2011). Visual metacontrast masking in migraine. Cephalalgia, 31(3): 346-356. https://doi.org/10.1177/0333102410380755
[55] Cerda-Company, X., Penacchio, O., Otazu, X. (2021). Chromatic induction in Migraine. Vision, 5(3): 37. https://doi.org/10.3390/vision5030037
[56] Bell, T., Stokoe, M., Khaira, A., Webb, M., Noel, M., Amoozegar, F., Harris, A.D. (2021). GABA and glutamate in pediatric migraine. Pain, 162(1): 300-308. https://doi.org/10.1097/j.pain.0000000000002022
[57] Martins, I.P., Westerfield, M., Lopes, M., Maruta, C., Gil-da-Costa, R. (2020). Brain state monitoring for the future prediction of migraine attacks. Cephalalgia, 40(3): 255-265. https://doi.org/10.1177/0333102419877660
[58] Gantenbein, A.R., Sándor, P.S. (2006). Physiological parameters as biomarkers of migraine. Headache: The Journal of Head and Face Pain, 46(7): 1069-1074. https://doi.org/10.1111/j.1526-4610.2006.00500.x
[59] Loder, E., Rizzoli, P. (2006). Biomarkers in migraine: Their promise, problems, and practical applications. Headache: The Journal of Head and Face Pain, 46(7): 1046-1058. https://doi.org/10.1111/j.1526-4610.2006.00498.x
[60] Coppola, G., Iacovelli, E., Bracaglia, M., Serrao, M., Di Lorenzo, C., Pierelli, F. (2013). Electrophysiological correlates of episodic migraine chronification: evidence for thalamic involvement. The Journal of Headache and Pain, 14: 1-8. https://doi.org/10.1186/1129-2377-14-76
[61] Coppola, G., Bracaglia, M., Di Lenola, D., Iacovelli, E., Di Lorenzo, C., Serrao, M., Evangelista, M., Parisi, V., Schoenen, J., Pierelli, F. (2016). Lateral inhibition in the somatosensory cortex during and between migraine without aura attacks: correlations with thalamocortical activity and clinical features. Cephalalgia, 36(6): 568-578. https://doi.org/10.1177/0333102415610873
[62] Wickmann, F., Stephani, C., Czesnik, D., Klinker, F., Timäus, C., Chaieb, L., Paulus, W., Antal, A. (2015). Prophylactic treatment in menstrual migraine: A proof-of-concept study. Journal of The Neurological Sciences, 354(1-2): 103-109. https://doi.org/10.1016/j.jns.2015.05.009
[63] May, A., Schulte, L.H. (2016). Chronic migraine: Risk factors, mechanisms and treatment. Nature Reviews Neurology, 12(8): 455-464. https://doi.org/10.1038/nrneurol.2016.93
[64] Omland, P.M., Uglem, M., Engstrøm, M., Linde, M., Hagen, K., Sand, T. (2014). Modulation of visual evoked potentials by high-frequency repetitive transcranial magnetic stimulation in migraineurs. Clinical Neurophysiology, 125(10): 2090-2099. https://doi.org/10.1016/j.clinph.2014.01.028
[65] Coppola, G., De Pasqua, V., Pierelli, F., Schoenen, J. (2012). Effects of repetitive transcranial magnetic stimulation on somatosensory evoked potentials and high frequency oscillations in migraine. Cephalalgia, 32(9): 700-709. https://doi.org/10.1177/0333102412446313
[66] Liebetanz, D., Fregni, F., Monte-Silva, K.K., Oliveira, M.B., Amâncio-dos-Santos, Â., Nitsche, M.A., Guedes, R.C. (2006). After-effects of transcranial direct current stimulation (tDCS) on cortical spreading depression. Neuroscience Letters, 398(1-2): 85-90. https://doi.org/10.1016/j.neulet.2005.12.058
[67] DaSilva, A.F., Mendonca, M.E., Zaghi, S., Lopes, M., DosSantos, M.F., Spierings, E.L., Bajwa, Z., Datta, A., Bikson, M., Fregni, F. (2012). tDCS‐induced analgesia and electrical fields in pain‐related neural networks in chronic migraine. Headache: The Journal of Head and Face Pain, 52(8): 1283-1295. https://doi.org/10.1111/j.1526-4610.2012.02141.x
[68] Angelini, L., De Tommaso, M., Guido, M., Hu, K., Ivanov, P.C., Marinazzo, D., Nardulli, G., Nitti, L., Pellicoro, M., Pierro, C., Stramaglia, S. (2004). Steady-state visual evoked potentials and phase synchronization in migraine patients. Physical Review Letters, 93(3): 038103. https://doi.org/10.1103/PhysRevLett.93.038103