Varun Sapra![]() | Luxmi Sapra
| Luxmi Sapra![]() | Akashdeep Bhardwaj
| Akashdeep Bhardwaj![]() | Ahmad Almogren | Salil Bharany*
| Ahmad Almogren | Salil Bharany*![]() | Ateeq Ur Rehman | Khmaies Ouahada
| Ateeq Ur Rehman | Khmaies Ouahada
© 2024 The authors. This article is published by IIETA and is licensed under the CC BY 4.0 license (http://creativecommons.org/licenses/by/4.0/).
OPEN ACCESS
According to the International Diabetes Federation, there are 463 million diabetics worldwide. Due to alterations in lifestyle, the disease has had a significant negative influence on the quality of life for many people and is now seen as a global threat. Diabetic retinopathy (DR) is a leading cause of blindness among diabetic patients, emphasizing the need for early detection and intervention to prevent irreversible vision loss. It is caused by uncontrolled blood sugar and results in damage to blood vessels in the retina. Uncontrolled Type-1 diabetes and Type-2 diabetes both contribute to diabetic retinopathy. People with diabetes are more vulnerable to the severe effects of COVID-19. To prevent adverse consequences, early detection of the disease is essential. Therefore, automatic detection of diabetic retinopathy diseases is performed only by using computational techniques is a great solution. In this study, a deep learning model with an enhanced feature selection method has been constructed for the goal of early disease diagnosis. Also, the performance of the optimized dataset is evaluated using different machine learning methods such as Random Forest, FURIA, and decision tree. The proposed deep learning model achieved the highest accuracy of 93.5% with an optimized feature subset whereas random forest achieved a maximum accuracy of 92.26% with the optimized dataset and 91.2% and 89.4% with CFS-PSO and Information Gain.
diabetic retinopathy, machine learning, random forest, artificial neural network, feature selection, deep learning
Diabetic retinopathy (DR) has been emerging as a significant non-communicable disease leading to visual morbidity. It is caused by uncontrolled blood sugar levels which result in damage to the retina [1, 2]. It is also a primary reason for vision loss worldwide. Blurred vision, spots, vision fluctuation, color vision impairment, and vision loss are some of the symptoms of DR. Uncontrolled Type-1 diabetes and Type-2 diabetes both contribute to DR. In Type-1 diabetes the body is unable to manufacture insulin. The immune system destroys the cells that are responsible for producing insulin in the pancreas which leads to imbalanced glucose levels. In Type-2 diabetes, the human body doesn’t respond to insulin. Although the body produces insulin but not able to use it effectively and gradually with time it stops producing enough insulin which leads to high blood glucose levels [3]. Diabetes mellitus results in high blood glucose levels, a metabolic condition. Diabetes is the foremost reason for retinopathy especially when the patient has diabetes and is unaware of the symptoms for a longer timeframe. The ignorance and late detection of the disease can result in diabetic retinopathy from diabetes [4].
Manual detection of diabetic retinopathy is solely based on the experience of the ophthalmologist and does not require computer assistance. The manual process is time-consuming, expensive and also requires an experienced ophthalmologist. Usually, the symptoms of DR at the initial stages are not catchy and even it can be missed by ophthalmologists. Optical coherence tomography and fluorescein angiography are two common methods for DR detection. A dye is injected into the vein of the patient's arm during fluorescein angiography, it then streams to the eyes detecting any type of blockage or leakage. Although this technique provides more valuable information as compared to the clinical examination it has some complications. It has a risk of nausea and anaphylaxis as it needs venepuncture and intravenous injection for inoculating dye and during the process patient is exposed to very bright light causing discomfort to the patient [5]. In optical coherence tomography, cross-sectional images of the retina are used to check any fluid leakage or damage in the retinal tissue. This method is effective but has its disadvantages [6-8].
Some other limitations can also be associated with current approaches for the early and successful detection of retinopathy such as these methods require manual evaluation and expertise which is a time-consuming method and needs significant expertise [9]. It also can lead to inter-observer variability, which can further lead to inconsistency in the diagnosis. Also, retinal screening, especially in rural areas, requires specialized equipment and trained medicos, which is again a challenge [10]. Based on these limitations there can be chances that some early-stage retinopathy cases might be missed by current detection methods.
Accurate diagnosis of DR is of crucial importance for prevention and care interventions. Diabetic retinopathy (DR) is still a leading cause of visual loss worldwide. In recent times diabetes patients are increasing very fast. So diabetic retinopathy has become a big challenge because it affects the eyesight of the patient and leads to blindness. In the early stages of diabetic retinopathy, there are more treatment options available that can effectively manage the condition and prevent further damage. Early diagnosis can prevent severe complications such as macular edema (swelling of the central part of the retina) and proliferative retinopathy (growth of abnormal blood vessels), both of which can lead to irreversible vision loss if not managed promptly.
In recent years many researchers have focused on automatic detection methods using computationally intelligent techniques powered with Artificial Intelligence. The merits and effectiveness of computer-aided systems are reliable, efficient, and faster. Deep neural network is an artificial neural network based on machine learning concepts. It has successfully contributed to the detection and identification of speech recognition, image processing, computer vision, and many others [11-15]. The aim of this study is to introduce a novel technique for feature optimization with its implementation using a deep neural network. This paper explores a multifaceted approach to tackling a critical healthcare challenge and embarks on a distinctive journey by merging the prowess of deep learning with a judiciously optimized feature selection strategy, striving to enhance the accuracy and efficiency of diabetic retinopathy detection. In the last decade many researchers have proposed automated methods for the detection of retinopathy and used different feature selection methods for improving the effectiveness of the model, but in this paper to get the most promising set of features that contributes maximum to the output, a union of the two-feature selection method is performed. The proposed approach performed better when compared to other techniques implemented on non-optimized and optimized data subsets discussed in the results section.
This research article is broken up into five sections. The first section gives a general overview of the many types of diabetic retinopathy and the issues with existing methods. Pertinent research on retinopathy disease detection is included in the second section. The procedures and techniques used for disease detection are provided in section three of the research methodology. The findings of numerous machine learning methods applied to whole and condensed datasets are discussed in section four followed by a discussion and conclusion in sections five and six.
Many researchers have developed numerous automated methods for early identification of disease at initial stages but still have room for improvement in detection methods. Imani et al. in their study proposed a novel screening system for the detection of retinopathy. The author divided their work into three phases. The first phase deals with the pre-screening of the images to assess the quality of the images. The second step exploits the structural information of the images using the proposed algorithm and if the quality of the images is satisfactory then they are passed to the third phase for the detection of retinopathy. The authors implemented the MCA algorithm for the separation of retinal vessels and lesions and finally support vector machine classifier was implemented to find the normal and abnormal retinal images. For experimental purposes, the authors have used a public dataset Messidor which contains 1,200 retinal images. Their suggested system had a 92.01% sensitivity and a 95.45% specificity [16].
Gadekallu et al. [17] in their work discussed how diabetic retinopathy can be identified using a deep neural network. Feature selection was performed using principal component analysis, further author implemented the grey wolf optimization technique for optimal selection of the feature subset. They used a sigmoid activation function with an Adam optimizer for the creation of a deep neural network. The proposed network was implemented on the Debrecen dataset available at the UCI machine learning repository. The dataset has 1151 records with 20 attributes in which the last attribute shows the class label. The Messidor picture dataset served as the source for the features used in this dataset. The effectiveness of the model was evaluated in comparison to various machine learning techniques used, including decision trees, k-nearest neighbors, support vector machines, and naive Bayes. The proposed approach achieved the highest accuracy of 96%.
A novel approach using a Deep Neural network has been suggested by Wang and Yang [18]. The regression activation map was implemented by the pooling layer in the convolution neural network. The proposed model focused on the specific region of the retina image based on the severity level. Their model was able to achieve high performance as compared to most state-of-art models [18].
Forecasting the presence of Microaneurysms in the photos and detection of early-stage diabetic retinopathy is for decades still a big challenge. Prolonged elevated blood glucose, leading to microvascular problems and permanent vision loss, is inflexed upon diabetic retinopathy (DR). The retinal development of microaneurysms and macular-enema is the early symptom of retinopathy and the correct early diagnosis minimized the risk of non-proliferated DC. Quick improvements in deep learning enable effective methodology for a fascinating approach to problems of medical picture processing. Qiao et al. [19] suggested detection for the existence of Microaneurysm in fundus images by use of neural network algorithms, which integrate deep learning implemented with Graphics Processing Unit systems. A semantic segmentation algorithm was implemented on the dataset available at https://ieee-dataport.org for classifying the infected or normal fundus images. Based on their popular semanthropic, semantic segmentation divides pixels to distinguish the function of microaneurysm. This provided the medical staff with automated fundus imagery as early-moderate-extreme non-proliferated DC. The microaneurysm prognosis and early detection method for non-causal DC are recommended to effectively train the convolutional neural network for somaticizing backbone images that can improve performance and accuracy.
A learning system to classify DC grades of Fundus images has been proposed by Elswah et al. [20]. There are three phases in the current structure. Next, an amplitude normalization and raise are added to the fundus picture preprocessed. Second, to remove the compact grading function vector the pre-processed image has been entered into the ResNet Convolutionary Network (CNN) model. Finally, a stage in classification detects and decides the degree of DR, for example mild, moderate, extreme, or proliferate diabetic retinopathy (PDR). The proposed frameworks are trained on a demanding Image Dataset IDRiD. The dataset consists of 516 images which were categorized as images with DR signs and normal retinal images. To eradicate the bias of instruction, the data is calibrated such that during the exercise each DR class is shown with the same number of images. In comparison to the relevant techniques, the proposed method demonstrates an increased efficiency for the same data and with a maximum general precision of 86.67%.
In the process of the detailed field extraction from several color fundus photos, Kumar and Kumar [21] proposed an improved diabetic identification scheme for diabetic retinopathy. Diagnosis and treatment of diabetic retinopathy depend on routine eye examinations. Microaneurysms are small red retinal spots that are formed by the blood vessel's delicate inflated portion. The first step in inhibiting DR is the identification at the primary level. Various techniques for the identification and diagnosis of DR were suggested. This research proposed two characteristics, namely the number and region of MA. Pre-processing approaches such as the extraction of the green channel, histograms, and the morphological procedure were initially used. The average filtering has been used in the identification of microaneurysms, major parent review (PCA), and minimal contrasting histogram equality. Linear vector help machine classification of DR (SVM) 96% and 92% respectively observe the accuracy and precision of the DR detection system.
Alzami et al. [22] focused on stable subjects and patients with diabetic retinopathy but on extreme levels of patients with diabetic retinopathy and fractal components. By using MESSIDOR datasets and the classification of Random Forest, the author achieved the results where fractal measurements can discriminate between healthy patients and patients with diabetic retinopathy. They were not able to achieve satisfactory results in classifying the severity of diabetic retinopathy. Thus, they further explored statistical characteristics in a future direction. It must also be vigilant to spot red lesions to obtain more knowledge on the extent of diabetic retinopathy.
Deperlıoglu and Köse [23] presented a hands-on system, which included HSV, algorithm V, and histogram equalization for enhancement of retinal fundus images. The retinal fundus picture was eventually fitted with a Gaussian low-pass filter. The Convolutional Neural Network performed the classification after the image processing. In the Kaggle Diabetic Retinopathy database, a performance evaluation of the proposed procedure was carried out using 400 retinal fundus images. Every stage of image processing has been classified. After image analysis, classification research was conducted. For each point, 20 experiments were performed, and average values were established. In the experiment the precision was 97%, the sensitivity 96.67%, the specificity 93.33%, the consistency 97.78%, the reminder 93.33%, with the F-score 93.33%. The result shows that the procedure suggested is extremely effective and good at diagnosing retinal fundus images with diabetic retinopathy.
Gautam et al. [24] proposed a software-based algorithm methodology for early detection of DC, which promised to pre-detect DR without the intervention of any expert, saving expense and time. MATLAB-based image analysis is used to classify white wool lesions, cotton stains, and rough exudates associated with DR using analytical science and biomedical engineering expertise. Depending on the pixel computation counts, the eye image under investigation was categorized as a non-diabetic or diabetes retinopathy eye.
Manjramkar [25] surveyed various methods to diagnose macular enema, thus raising the value of automated macular enema evaluation. Diabetic retinopathy consists of a common community that has been observed for several years in the retina of one who has diabetes. Early visibility can be prevented by the identification of exudates.
Herliana et al. [26] presented a model for detecting diabetic retinopathy using Wide-X architecture implemented on the EyePACS dataset consisting of 5220 images. The chosen function is then further categorized using a neural network classification process. The findings of the analysis revealed the particle swarm optimization increased to 76.11%. This also validated the classification outcome improvement using 4.35 percent of the previous findings using a neural network system by just 71.76 percent.
Deperlioğlu and Köse [27] demonstrated the use of image recognition and preparation for DC using retinal fundus images. A hands-on system including HSV, algorithm V, and histogram equalization was used for the enhancement of retinal fundus images. The retinal fundus picture was eventually fitted with a Gaussian low-pass filter. The performance of the said model was assessed using the Diabetic Retinopathy dataset available publicly on Kaggle. The dataset contains 400 retinal fundus images.
Wu and Hu [28] presented a novel system for understanding transferal retinopathy. First, import dataset DIARETDB1 from the official Kaggle website, and then boost data, including data amplification, tossing, folding, and adjustment of comparison. Using pre-trained patterns like VGG19, InceptionV3, and Resnet50 etc. Finally, by the extreme stage of diabetic retinopathy, the pictures are classified into five groups. The experimental results show that the proposed approach can achieve a classification precision of 0.60, which is greater and more stable than the standard direct training method.
Chetoui et al. [29] suggest a modern, convolutional neural system named EfficientNet focused on a deeper learning architecture to diagnose re-readable diabetic retinopathy (RDRs) and vision affecting DRs. Tests have been done in EyePACS and APTOS 2019, two public datasets. The findings obtained indicate that the planned network contributes to higher speeds, hitting 0,984 RDR Area under Curve (AUC) and 0,990 EyePACS data set for vision-threatening DR. The APTOS 2019 data sets Receiver Operating Characteristics are equal to 0.966 and 0.998 respectively for a refractive and vision-proof DR. An algorithm of explain ability has already been developed and illustrates the utility of the proposal to identify DR signals.
Ekatpure and Jain [30] proposed automatic DC diagnosis by utilizing an eye fundus graphic. For the identification of red lesions, a Gaussian filter is used to suppress blood Vessels. Supporting vector machine (SVM) for red accident identification is a classifier. Red lesion characteristics for SVM training are discovered and used.
Dhivya et al. [31] detected the DR and displayed the retinal blood vessels but did not discern early stages and could not treat distinguishing features using numerous computer-based technology. The computer-based vision findings have limited precision. This research is used in the characterization of different phases of diabetic retinopathy by artificial neural networks. The findings indicate greater precision and efficiency.
Diabetic retinopathy is an impaired retinal microvasculature complication of diabetes. As retinopathy has diabetic side effects that do not induce any signs or just minor visions, Esmail and Alzain [32] have recommended the concept of an optical device with cell phone cameras and a Web-based remote medicine system for scanning diabetic retinopathy, and is very innovative in the way retinopathy has been taken to obtain retinal imaging. The web-based interface for the database management system was designed in PHP programming language and My SQL. The outcome of the retinal picture is obtained with the proposed system, and the ophthalmic specialist sends this website for further study. The suggested method provides patients with monitoring and reduces their costs by using a tracking technology.
The automatic framework for detecting and categorizing DC through the implementation of the ImageNet Model, by Jayakumari et al. [33], has been proposed. The 'Kaggle' dataset of the retinal images is available publicly for comparison and review of the algorithm's results. The ImageNet model achieved the highest accuracy in the identification of retinopathy. The model was able to achieve 98.6% of accuracy. The model has achieved noDR precision of 86.6%, modest of 62.5%, mild of 66.6%, extreme of 57.1% with PositiveDR of 42.8%. The accuracy increased by training the network in each classification with more data.
Most people with diabetic retinal disorder known as diabetic retinopathy have a medical problem. High blood sugar levels in the retina called Diabetes Mellitus in the long term are the primary cause of diabetic retinopathy. The focus of Chakrabarty [34] was on automated classification in the High-resolution Fundus picture of the Retina of patients with diabetic retinopathy and not having the same. For this reason, the images were initially processed, and mostly colored images (RGB) were translated into ideal grayscales and transformed into sizing. The processed images are then incorporated in a Deep Learning Approach, which makes a predictor about whether the patient is diabetic or not. A new technique is developed. This approach is used on a dataset of 30 high-resolution fundus retina images. The findings obtained are 100% statistical precision and 100% sensitivity. Such an Automatic Device is convenient for diabetic and stable patients to identify retina images, thereby minimizing the number of doctor feedback.
Diabetic retinopathy is a condition caused by the missing mechanism of insulin. Blood retinal arteries weakened by haemorrhage and diabetic retinopathy, exudate, and neo-vascularization are present, so vision loss or disease is observed. Two stages are studied for the improvement of the disease: proliferation and non-proliferation. For treatment, early-stage identification (NPRD) is important. Difficult exudates are the signs of early diagnosis of diabetic retinopathy. The latest approach for detecting diabetic retinopathy has been suggested by Yasar et al. [35], focused on the identification of exudates using the Kirsch protocol in retinal funds, edge detection, threshold, filters, elimination of noise, histogram equalization, optical disc removal, and morphological classification processes. This is used for precision in multiple pictures. Therefore, early diabetic retinopathy is observed in a particular manner that is based on hard exudates and hard exudates.
Nguyen et al. [36] suggested another novel approach using a deep neural network. They have implemented a regression activation map after the pooling layer in the convolution neural network. The proposed model can focus on the specific region of the retina image based on the severity level. Their model was able to achieve high performance as compared to the state-of-the-art models. Gargeya and Leng [37] in the study presented an algorithm based on a data-driven deep-learning method. For experimental purposes, the author considered 75137 fundus images which are publicly available, and got those images verified by retinal specialists for the quality of images. They further tested their model on Messidor-2 and e-optha databases. Their model achieved 94% sensitivity and 98% specificity when implemented on a local database. Another novel approach to bimodal learning was proposed by Hua et al. [38]. They implemented the bimodal learning approach for the early detection of DR that involves both baseline and follow-up information of retinal fundus images. They further implemented a deep network based on skip connection for combining different modality features. Their model achieved an accuracy of 90.6%. Gowda and Viswanatha [39] in their study suggested the use of the fuzzy c-means clustering method. They implemented the method on a dataset with 100 images for the identification of the exact region of DR. Their method was able to achieve a 99.01% accuracy rate, a 98.38% sensitivity rate, and a 96.36% specificity rate.
Vijayan et al. [40] in their study compared different ML algorithms for the early identification of the disease. For the experimental purpose, they used a retinal image dataset available at Kaggle. Feature extraction was carried out using a Gabor filter and models were constructed using random forest, k-nearest neighbor, J48, and one rule. Random forest achieved the best accuracy of 70.15% among all the methods. Another novel method with two types of ensemble classifiers was adapted by Salamat et al. [41]. They make use of fuzzy random forest and dominance-based rough set methods to detect the possibilities of a patient for diabetic retinopathy. The proposed approach achieved over 80% sensitivity and specificity.
A hybrid approach of convolutional neural network with support vector machine was suggested by Katada et al. [42]. They implemented their model on open-source American clinical fundus images and obtained a sensitivity of 81.5% and specificity of 71.9% and further evaluated the performance of their model with another dataset obtained from Keio University. The proposed model achieved a sensitivity of 90.8% and specificity of 80.0%.
For testing purposes, the benchmark dataset for diabetic retinopathy that is accessible on the UCI Machine Repository [43] was employed. The dataset contains 20 attributes including class. The details of all the attributes are shown in Table 1.
Table 1. Description of attributes of DR dataset
|
S No. |
Feature Number |
Description |
|
1 |
1 |
Binary attribute for assessment of quality. 0=bad and 1 = sufficient |
|
2 |
2 |
Binary attribute for pre-screening result 1= retinal abnormality 0 = None |
|
3 |
3-8 |
Signifies Microaneurysms (MA) detection |
|
4 |
9-16 |
Shows the values of Microaneurysms detection for exudates. |
|
5 |
17 |
Denotes Euclidean distance between the centers of the optic disc and macula. |
|
6 |
18 |
Diameter of the optic disc |
|
7 |
19 |
Binary attribute of AM/FM based classification |
|
8 |
20 |
Class Label 1 = positive DR 0 = negative DR |
3.1 Proposed model
The framework is developed for detection of diabetic retinopathy. The framework consists of Data collection and preprocessing, construction of model and evaluation. In the first phase data on diabetic retinopathy is collected from the UCI Repository with 20 attributes where the last attribute represents the class. In the next phase collected data is standardized using a standard scalar. After scaling the data dimensionality of the collected data is reduced using two different feature engineering methods. To get the most promising set of features that contributes maximum to the output, a union of the two-feature selection method is performed. The crux of innovation, however, emerges from the incorporation of optimized feature selection. Rather than indiscriminately utilizing all available features, this paper endeavours to employ a systematic approach that identifies and selects the most discriminative and relevant features for diabetic retinopathy detection. This thoughtful curation not only expedites the computation process but also mitigates the risk of overfitting, thereby culminating in a more robust and effective diagnostic model.
Classification models are constructed using a Fuzzy Unordered Rule Induction Algorithm, Decision tree, Random Forest and Artificial Neural Network. A 10-fold cross-validation method has been implemented for the training and testing of the models. The models have been trained and tested using a 10-fold cross-validation method. In this method, the data is divided into 10 equal parts at random, nine of which are used for training and one of which is preserved as a testing dataset. The deep learning model is assessed using performance indicators like recall, recall accuracy, precision, and f-Score. The proposed framework is presented in Figure 1.
Data preprocessing is an essential step to improve the performance of the methods and to attain the desired using machine learning. Data preprocessing includes handling noise, imputing missing values, data transformation, and removing outliers. Normalization ensures that all the features have an equal numeric contribution to the learning process [44]. We applied z-score normalization for standardization of data. In this normalization method mean and standard deviation measures are used to normalize the data [45].
$x i=(y i-\mu) / s t d$ (1)
where, $x i$ is the standardized value, $y i=$ observed value, $\mu$ =mean of the sample, and std is the standard deviation of the sample. Not every feature needs to be significant. There can be some redundant and irrelevant features that do not contribute to the learning process. So feature reduction algorithms help in choosing the relevant features by illuminating the irrelevant and redundant features [46].
Figure 1. Proposed DNN model for detection of diabetic retinopathy
3.1.1 Feature engineering
In the suggested model, the data dimensionality of the collected data is reduced using feature engineering methods where feature reduction is carried out using the method of filtering out the low-ranking attributes with the help of the Information gain filter method [47, 48] as well as correlation-based feature subset selection (CFS) method with Particle swam optimization search. The CFS method is based on a correlation-based heuristic. It computes the correlation between attribute and class as well as a correlation between attributes. It works on the hypothesis that the quality variables always show a superior correlation with the class and a low correlation with the rest of the variables [49]. A population-based stochastic optimization technique known as PSO, draws inspiration from group behaviors like fish schooling and bird flocking. A population of particles is maintained where each of the particles denotes a possible solution for an optimization problem [48]. Table 2 shows the reduced features after implementing CFS + PSO and Table 3 shows the reduced dataset based on Information gain.
Table 2. Reduced features with correlation-based feature subset + particle swarm optimization (A)
|
S. No. |
Feature No. |
Description |
|
1 |
1 |
Indicates quality of image for acceptance |
|
2 |
2 |
Prescreening result |
|
3 |
3-4 |
Signifies MA detection |
|
4 |
14,15,16 |
MA detection for exudates |
Table 3. Reduced features with information gain filter method (B)
|
S. No. |
Feature No. |
|
1 |
F16 |
|
2 |
F15 |
|
3 |
F14 |
|
4 |
F13 |
|
5 |
F3 |
|
6 |
F4 |
|
7 |
F12 |
|
8 |
F5 |
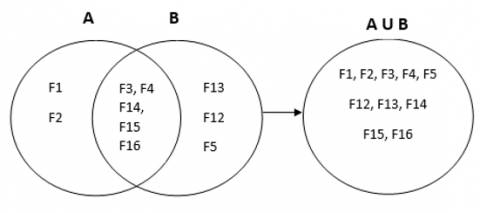
Figure 2. Union of two extracted feature subsets
In order to extract the most prominent dataset which will have a significant contribution towards the identification of the disease, a union operation is performed on the reduced feature sets A and B to generate an optimized dataset i.e. A U B as shown in Figure 2.
3.1.2 Model construction
Fuzzy Unordered Rule Induction Algorithm (FURIA). It is an accretion of the Rule-based learner method. The algorithm produces fuzzy rules to display decision boundaries. Crisp rules are replaced by fuzzy rules by using fuzzy membership functions [49-51].
Random Forest comes in the category of ensemble learner used to solve classification problems. That comprises of amalgamation of q learning models, j_1,j_2….,j_q to obtain an improved learning model q. Random forest is the tree predictor where every tree depends on the random vector values that are independently sampled and with identical distribution for all trees in the forest. All the individual decision trees are generated by selecting random attributes at each node for determining the split.
A Decision Tree is a hierarchical tree structure in which the leaf node denotes the outcome or class labels and branches of the tree denote test conditions on an. The top node is always known as the root node in a tree. C4.5 is the advancement of the ID3 method developed by Quinlan works on the strategy of divide and conquer and uses gain ratio as a splitting criterion.
Deep Neural Network (DNN): These model shows the complex association between dependent and independent variables. It is inspired by the human brain and consists of a large number of interconnected elements arranged into layers. In the proposed model, a sequential deep learning model with 5 layers has been implemented with 400 epochs. The relu activation function is used with Adam Optimizer.
This section presents the result of the experiment for identification of diabetes. Table 4 shows the result of different machine learning techniques implemented on the extracted dataset using CFS+PSO. The performance parameters are accuracy, mean absolute error (MAE), root mean squared error (RMSE), relative absolute error, AUC - ROC and F-measure.
Results obtained with CFS and PSO
Random forest achieves an accuracy of 90.4% which is the highest as compared to FRUIA and decision tree. The decision tree has the lowest accuracy i.e., 89.13. Table 5 shows the value of Precision and recall using a reduced dataset with CFS + PSO.
Table 4. Performance parameters accuracy/MAE/ RMSE/ RAE/AUC-ROC/F-measure using a reduced dataset with PSO
|
Model |
Accuracy (%) |
MAE |
RMSE |
RAE (%) |
AUC-ROC |
F-Measure |
|
Random Forest |
90.44 |
0.1229 |
0.2568 |
24.68 |
0.973 |
0.898 |
|
FURIA |
89.83 |
0.1084 |
0.2975 |
21.74 |
0.925 |
0.894 |
|
Decision Tree |
89.13 |
0.1319 |
0.2786 |
26.48 |
0.950 |
0.891 |
Table 5. Precision and recall using a reduced dataset with PSO
|
Model |
Recall |
Precision |
||
|
No |
Yes |
No |
Yes |
|
|
Random Forest |
0.894 |
0.913 |
0.901 |
0.907 |
|
FURIA |
0.913 |
0.885 |
0.876 |
0.920 |
|
Decision Tree |
0.933 |
0.854 |
0.850 |
0.935 |
Results obtained with information gain
In the quest to find the optimal feature subset information gain method is applied and then the models are constructed and tested using 10-fold cross-validation. The results of the Random Forest, FURIA, and decision tree are shown in Table 6. The result of information gain is better than the previous dimensionality reduction method. Here FURIA outperforms the other two algorithms in the context of accuracy. Table 7 shows the value of precision and recall using a reduced dataset with information gain.
Results obtained by the proposed method.
Table 8 shows the results (performance measures) of hybridization and Table 9 shows the precision and recall of the hybrid feature set. Hybridization has improved the performance of classification algorithms. By combining the global exploration capabilities of PSO with the informative power of Information Gain, this hybrid approach can potentially find a better feature subset compared to using either method individually. In the case of Random Forest, there is an improvement of 1.82% as compared to feature subset A and 1.06% as compared to feature subset B.
Table 6. Performance parameters accuracy/MAE /RMSE /RAE/AUC-ROC/F-measure with a reduced dataset with information gain
|
Model |
Accuracy (%) |
MAE |
RMSE |
RAE (%) |
AUC-ROC |
F-Measure |
|
Random Forest |
91.2 |
0.120 |
0.2475 |
24.27 |
0.977 |
0.912 |
|
FURIA |
91.3 |
0.095 |
0.2743 |
19.214 |
0.936 |
0.913 |
|
Decision Tree |
90.4 |
0.115 |
0.282 |
23.17 |
0.990 |
0.904 |
Table 7. Precision and recall using reduced dataset with information gain
|
Model |
Recall |
Precision |
||
|
No |
Yes |
No |
Yes |
|
|
Random Forest |
0.917 |
0.908 |
0.898 |
0.925 |
|
FURIA |
0.919 |
0.908 |
0.899 |
0.927 |
|
Decision Tree |
0.907 |
0.902 |
0.891 |
0.917 |
Table 8. Performance parameters accuracy/MAE/RMSE /RAE/AUC-ROC/F-measure using an optimized dataset
|
Model |
Accuracy (%) |
MAE |
RMSE |
RAE (%) |
AUC-ROC |
F-Measure |
|
Random Forest |
92.26 |
0.11 |
0.239 |
23.14 |
0.980 |
0.923 |
|
FURIA |
90.73 |
0.092 |
0.267 |
18.50 |
0.995 |
0.907 |
|
Decision Tree |
91.13 |
0.112 |
0.266 |
22.67 |
0.958 |
0.911 |
Table 9. Precision and recall using a reduced dataset using an optimized dataset
|
Model |
Recall |
Precision |
||
|
No |
Yes |
No |
Yes |
|
|
Random Forest |
0.920 |
0.925 |
0.915 |
0.929 |
|
FURIA |
0.913 |
0.902 |
0.892 |
0.921 |
|
Decision Tree |
0.902 |
0.920 |
0.909 |
0.914 |
The hybridization also improved the performance of FURIA as well as the decision tree as compared to reduced feature subset A. An improvement of 0.9% accuracy is reported in the case of FURIA and 2% in the case of decision tree. An improvement of 1.06% accuracy is reported in the case of random forest with hybridization as compared with feature subset B. A 0.57% reduction in accuracy is reported in the case of FURIA as compared to Feature subset B and a 0.27% increase in accuracy is reported in the case of decision tree as compared to Feature subset B.
Figure 3. MAE/RMSE/ROC/F-measure on optimized data
Deep Learning Model on Optimized Dataset
We implemented a deep learning-based model on an Optimized dataset.
Table 10. Performance of deep learning-based model using an optimized dataset
|
Model |
Accuracy |
F1-Score |
Recall |
Precision |
||
|
No |
Yes |
No |
Yes |
|||
|
Deep Learning Model |
0.935 |
0.94 |
0.94 |
0.93 |
0.92 |
0.95 |
The accuracy achieved by the Deep learning-based model on an optimized dataset is 93.5%, the error rate is 6.5% and the value of F1-Score is 0.94%. Figure 3 shows the comparison of MAE, RMSE, ROC and F-Measure on optimized data with deep learning model.
Figure 4 demonstrates that the Deep Learning method was able to attain the highest accuracy (93.5%) and the lowest error rate (6.5%) utilizing an optimized data set. The FURIA recorded the highest error rate of 9.27% and the lowest accuracy of 90.73%. Table 10 shows the performance of the deep learning method on an optimized dataset.
Figure 4. Accuracy and error rate of classifiers using the optimized dataset
Diabetic retinopathy is one of the major causes of vision loss worldwide. It is necessary to identify it in its early stages. For this purpose, a machine learning-based framework is proposed. A deep learning-based model is constructed for early detection of diabetic retinopathy. The deep learning-based model outperformed as compared to other machine learning models namely Random Forest, FURIA, and Decision Tree. The performance of the model is improved by optimizing the features. Two feature selection methods, namely particle swam optimization and information gain have been explored. With CFS and PSO random forest achieved a maximum accuracy of 90.44% and decision tree with the lowest of 89.13%. The same ML techniques were applied to the dataset obtained using Information Gain and FURIA achieved the highest accuracy of 91.3%. Then the dataset was optimized, and ML techniques were implemented where random forest achieved 92.26% accuracy and outperformed all the other methods. The optimized dataset is then implemented on a deep learning model where the proposed model achieves a detection accuracy of 93.5% which is highest as compared to other methods. Implementing such a method for extracting significant features definitely help the clinical practitioners to identify the disease in its early stage and helps them in taking early informed decision.
In this article, a unique deep-learning method with an optimized feature selection for detecting diabetic retinopathy is proposed. Diabetic retinopathy, a prevalent complication of diabetes, stands as a significant cause of preventable blindness globally. The uniqueness of this research lies in its fusion of cutting-edge deep learning techniques with an astutely devised feature selection methodology. By assimilating the power of neural networks (NNs) and other deep learning architectures, the study aims to harness the inherent ability of these models to automatically learn relevant hierarchies of features from medical data. By selecting the most pertinent and instructive features from the initial dataset, the main goal was to increase the precision and effectiveness of diabetic retinopathy diagnosis. The proposed study was able to condense the feature space while retaining the most important features by combining deep learning with feature selection based on information gain. The study showed encouraging outcomes in the identification of diabetic retinopathy by utilizing deep learning models and including optimized feature selection strategies. We acknowledge that there is still an opportunity for development, though. Future studies could analyze the efficacy of various feature selection techniques and look at the effects of various deep learning architectures.
This work was supported by King Saud University, Riyadh, Saudi Arabia, through Researchers Supporting Project number RSP2023R184.
[1] Zhao, Y., Singh, R.P. (2018). The role of anti-vascular endothelial growth factor (anti-VEGF) in the management of proliferative diabetic retinopathy. Drugs in Context, 7: 212532. https://doi.org/10.7573/dic.212532
[2] Wang, W., Lo, A.C. (2018). Diabetic retinopathy: Pathophysiology and treatments. International Journal of Molecular Sciences, 19(6): 1816. https://doi.org/10.3390/ijms19061816
[3] Mayer-Davis, E.J., Lawrence, J.M., Dabelea, D., Divers, J., Isom, S., Dolan, L., Wagenknecht, L. (2017). Incidence trends of type 1 and type 2 diabetes among youths, 2002–2012. New England Journal of Medicine, 376(15): 1419-1429. https://doi.org/10.1056/NEJMoa1610187
[4] Stitt, A.W., Curtis, T.M., Chen, M., Medina, R.J., McKay, G.J., Jenkins, A., Gardiner, T.A., Lyons, T.J., Hammes, H., Simó, R., Lois, N. (2016). The progress in understanding and treatment of diabetic retinopathy. Progress in Retinal and Eye Research, 51: 156-186. https://doi.org/10.1016/j.preteyeres.2015.08.001
[5] Soares, M., Neves, C., Marques, I.P., Pires, I., Schwartz, C., Costa, M.Â., Santos, T., Durbin, M., Cunha-Vaz, J. (2017). Comparison of diabetic retinopathy classification using fluorescein angiography and optical coherence tomography angiography. British Journal of Ophthalmology, 101(1): 62-68. https://doi.org/10.1136/bjophthalmol-2016-309424
[6] Turgut, B. (2016). Optical coherence tomography angiography–A general view. Journal-Optical Coherence Tomography Angiography–A General View, 39-42. http://doi.org/10.17925/EOR.2016.10.01.39
[7] Minvielle, W., Caillaux, V., Cohen, S.Y., Chasset, F., Zambrowski, O., Miere, A., Souied, E.H. (2016). Macular microangiopathy in sickle cell disease using optical coherence tomography angiography. American Journal of Ophthalmology, 164: 137-144. https://doi.org/10.1016/j.ajo.2015.12.023
[8] Spaide, R.F., Klancnik, J.M., Cooney, M.J. (2015). Retinal vascular layers imaged by fluorescein angiography and optical coherence tomography angiography. JAMA Ophthalmology, 133(1): 45-50. https://doi.org/10.1001/jamaophthalmol.2014.3616
[9] Gupta, E., Gupta, V., Chopra, M., Chhipa, P.C., Liwicki, M. (2023). Learning self-supervised representations for label efficient cross-domain knowledge transfer on diabetic retinopathy fundus images. arXiv preprint arXiv:2304.11168. https://doi.org/10.48550/arXiv.2304.11168
[10] Dolar-Szczasny, J., Barańska, A., Rejdak, R. (2023). Evaluating the efficacy of teleophthalmology in delivering ophthalmic care to underserved populations: A literature review. Journal of Clinical Medicine, 12(9): 3161. https://doi.org/10.3390/jcm12093161
[11] Abdel-Hamid, O., Mohamed, A.R., Jiang, H., Deng, L., Penn, G., Yu, D. (2014). Convolutional neural networks for speech recognition. IEEE/ACM Transactions on Audio, Speech, and Language Processing, 22(10): 1533-1545. https://doi.org/10.1109/TASLP.2014.2339736
[12] Sapra, V., Saini, M.L., Verma, L. (2021). Identification of coronary artery disease using artificial neural network and case-based reasoning. Recent Advances in Computer Science and Communications (Formerly: Recent Patents on Computer Science), 14(8): 2651-2661. https://doi.org/10.2174/2666255813999200613225404
[13] Balderas, D., Ponce, P., Molina, A. (2019). Convolutional long short term memory deep neural networks for image sequence prediction. Expert Systems with Applications, 122: 152-162. https://doi.org/10.1016/j.eswa.2018.12.055
[14] Khan, S., Rahmani, H., Shah, S.A.A., Bennamoun, M. (2018). A guide to convolutional neural networks for computer vision. Synthesis Lectures on Computer Vision, pp. 1-207. https://doi.org/10.1007/978-3-031-01821-3
[15] Sapra, V., Sapra, L., Bhardwaj, A., Bharany, S., Saxena, A., Karim, F.K., Ghorashi, S., Mohamed, A.W. (2023). Integrated approach using deep neural network and CBR for detecting severity of coronary artery disease. Alexandria Engineering Journal, 68: 709-720. https://doi.org/10.1016/j.aej.2023.01.029
[16] Imani, E., Pourreza, H.R., Banaee, T. (2015). Fully automated diabetic retinopathy screening using morphological component analysis. Computerized Medical Imaging and Graphics, 43: 78-88. https://doi.org/10.1016/j.compmedimag.2015.03.004
[17] Gadekallu, T.R., Khare, N., Bhattacharya, S., Singh, S., Maddikunta, P.K.R., Srivastava, G. (2020). Deep neural networks to predict diabetic retinopathy. Journal of Ambient Intelligence and Humanized Computing, 14: 5407-5420. https://doi.org/10.1007/s12652-020-01963-7
[18] Wang, Z., Yang, J. (2017). Diabetic retinopathy detection via deep convolutional networks for discriminative localization and visual explanation. ArXiv preprint arXiv: 1703.10757. https://doi.org/10.48550/arXiv.1703.10757
[19] Qiao, L., Zhu, Y., Zhou, H. (2020). Diabetic retinopathy detection using prognosis of microaneurysm and early diagnosis system for non-proliferative diabetic retinopathy based on deep learning algorithms. IEEE Access, 8: 104292-104302. https://doi.org/10.1109/ACCESS.2020.2993937
[20] Elswah, D.K., Elnakib, A.A., Moustafa, H.E.D. (2020). Automated diabetic retinopathy grading using Resnet. In 2020 37th National Radio Science Conference (NRSC), Cairo, Egypt, pp. 248-254. https://doi.org/10.1109/NRSC49500.2020.9235098
[21] Kumar, S., Kumar, B. (2018). Diabetic retinopathy detection by extracting area and number of microaneurysm from colour fundus image. In 2018 5th International Conference on Signal Processing and Integrated Networks (SPIN), Noida, India, pp. 359-364. https://doi.org/10.1109/SPIN.2018.8474264
[22] Alzami, F., Megantara, R.A., Fanani, A.Z. (2019). Diabetic retinopathy grade classification based on fractal analysis and random forest. In 2019 International Seminar on Application for Technology of Information and Communication (iSemantic), Semarang, Indonesia, pp. 272-276. https://doi.org/10.1109/ISEMANTIC.2019.8884217
[23] Deperlıoğlu, Ö., Köse, U. (2018). Diagnosis of diabetic retinopathy by using image processing and convolutional neural network. In 2018 2nd International Symposium on Multidisciplinary Studies and Innovative Technologies (ISMSIT), Ankara, Turkey, pp. 1-5. https://doi.org/10.1109/ISMSIT.2018.8567055
[24] Gautam, A.S., Jana, S.K., Dutta, M.P. (2019). Automated diagnosis of diabetic retinopathy using image processing for non-invasive biomedical application. In 2019 International Conference on Intelligent Computing and Control Systems (ICCS), Madurai, India, pp. 809-812. https://doi.org/10.1109/ICCS45141.2019.9065446
[25] Manjramkar, M. (2018). Survey of diabetic retinopathy screening methods. In 2018 2nd International Conference on Trends in Electronics and Informatics (ICOEI), Tirunelveli, India, pp. 1-6. https://doi.org/10.1109/ICOEI.2018.8553843
[26] Herliana, A., Arifin, T., Susanti, S., Hikmah, A.B. (2018). Feature selection of diabetic retinopathy disease using particle swarm optimization and neural network. In 2018 6th International Conference on Cyber and IT Service Management (CITSM), Parapat, Indonesia, pp. 1-4. https://doi.org/10.1109/CITSM.2018.8674295
[27] Deperlioğlu, Ö., Köse, U. (2018). Diagnogsis of diabetic retinopathy using image processing and convolutional neural network. 2018 Medical Technologies National Congress (TIPTEKNO), Magusa, Cyprus, pp. 1-4. https://doi.org/10.1109/TIPTEKNO.2018.8596894
[28] Wu, Y., Hu, Z. (2019). Recognition of diabetic retinopathy basedon transfer learning. In 2019 IEEE 4th International Conference on Cloud Computing and Big Data Analysis (ICCCBDA), Chengdu, China, pp. 398-401. https://doi.org/10.1109/ICCCBDA.2019.8725801
[29] Chetoui, M., Akhloufi, M.A. (2020). Explainable diabetic retinopathy using EfficientNET. In 2020 42nd annual international conference of the IEEE engineering in Medicine & Biology Society (EMBC), Montreal, QC, Canada, pp. 1966-1969. https://doi.org/10.1109/EMBC44109.2020.9175664
[30] Ekatpure, S., Jain, R. (2018). Red lesion detection in digital fundus image affected by diabetic retinopathy. In 2018 Fourth International Conference on Computing Communication Control and Automation (ICCUBEA), Pune, India, pp. 1-4. https://doi.org/10.1109/ICCUBEA.2018.8697387
[31] Dhivya, K., Premalatha, G., Kayathri, M. (2020). Automated identification of diabetic retinopathy using artificial neutral network. In 2020 International Conference on System, Computation, Automation and Networking (ICSCAN), Pondicherry, India, pp. 1-4. https://doi.org/10.1109/ICSCAN49426.2020.9262359
[32] Esmail, M.Y., Alzain, M.A. (2018). Mobile based tele-medicine diabetic retinopathy screening. In 2018 International Conference on Computer, Control, Electrical, and Electronics Engineering (ICCCEEE), Khartoum, Sudan, pp. 1-6. https://doi.org/10.1109/ICCCEEE.2018.8515840
[33] Jayakumari, C., Lavanya, V., Sumesh, E.P. (2020). Automated diabetic retinopathy detection and classification using ImageNet convolution neural network using fundus images. In 2020 International Conference on Smart Electronics and Communication (ICOSEC), Trichy, India, pp. 577-582. https://doi.org/10.1109/ICOSEC49089.2020.9215270
[34] Chakrabarty, N. (2018). A deep learning method for the detection of diabetic retinopathy. In 2018 5th IEEE Uttar Pradesh Section International Conference on Electrical, Electronics and Computer Engineering (UPCON), Gorakhpur, India, pp. 1-5. https://doi.org/10.1109/UPCON.2018.8596839
[35] Yaşar, B., Yeşilkaya, B., Cura, Ö.K., Akan, A. (2018). A new method to detect diabetic retinopathy. In 2018 Medical Technologies National Congress (TIPTEKNO), Magusa, Cyprus, pp. 1-4. https://doi.org/10.1109/TIPTEKNO.2018.8596776
[36] Nguyen, Q.H., Muthuraman, R., Singh, L., Sen, G., Tran, A.C., Nguyen, B.P., Chua, M. (2020). Diabetic retinopathy detection using deep learning. In ICMLSC '20: Proceedings of the 4th International Conference on Machine Learning and Soft Computing, pp. 103-107. https://doi.org/10.1145/3380688.3380709
[37] Gargeya, R., Leng, T. (2017). Automated identification of diabetic retinopathy using deep learning. Ophthalmology, 124(7): 962-969. https://doi.org/10.1016/j.ophtha.2017.02.008
[38] Hua, C.H., Huynh-The, T., Kim, K., Yu, S.Y., Le-Tien, T., Park, G.H., Bang, J., Khan, W.A., Bae, S., Lee, S. (2019). Bimodal learning via trilogy of skip-connection deep networks for diabetic retinopathy risk progression identification. International Journal of Medical Informatics, 132: 103926. https://doi.org/10.1016/j.ijmedinf.2019.07.005
[39] Gowda, L., Viswanatha, K.V. (2018). Automatic diabetic retinopathy detection using FCM. International Journal of Engineering Science Invention (IJESI), 7(4): 19-24.
[40] Vijayan, T., Sangeetha, M., Kumaravel, A., Karthik, B. (2020). Gabor filter and machine learning based diabetic retinopathy analysis and detection. Microprocessors and Microsystems, 103353. https://doi.org/10.1016/j.micpro.2020.103353
[41] Salamat, N., Missen, M.M.S., Rashid, A. (2019). Diabetic retinopathy techniques in retinal images: A review. Artificial Intelligence in Medicine, 97: 168-188. https://doi.org/10.1016/j.artmed.2018.10.009
[42] Katada, Y., Ozawa, N., Masayoshi, K., Ofuji, Y., Tsubota, K., Kurihara, T. (2020). Automatic screening for diabetic retinopathy in interracial fundus images using artificial intelligence. Intelligence-Based Medicine, 3-4: 100024. https://doi.org/10.1016/j.ibmed.2020.100024
[43] Antal, B., Hajdu, A. (2014). Diabetic retinopathy Debrecen. UCI Machine Learning Repository. https://doi.org/10.24432/C5XP4P
[44] Singh, D., Singh, B. (2020). Investigating the impact of data normalization on classification performance. Applied Soft Computing, 97: 105524. https://doi.org/10.1016/j.asoc.2019.105524
[45] Jain, S., Shukla, S., Wadhvani, R. (2018). Dynamic selection of normalization techniques using data complexity measures. Expert Systems with Applications, 106: 252-262. https://doi.org/10.1016/j.eswa.2018.04.008
[46] Zheng, A., Casari, A. (2018). Feature Engineering for Machine Learning: Principles and Techniques for Data Scientists. O'Reilly Media, Inc.
[47] Pratiwi, A.I. (2018). On the feature selection and classification based on information gain for document sentiment analysis. Applied Computational Intelligence and Soft Computing, 2018: 1407817. https://doi.org/10.1155/2018/1407817
[48] Stiawan, D., Idris, M.Y.B., Bamhdi, A.M., Budiarto, R. (2020). CICIDS-2017 dataset feature analysis with information gain for anomaly detection. IEEE Access, 8: 132911-132921. https://doi.org/10.1109/ACCESS.2020.3009843
[49] Jain, I., Jain, V.K., Jain, R. (2018). Correlation feature selection based improved-binary particle swarm optimization for gene selection and cancer classification. Applied Soft Computing, 62: 203-215. https://doi.org/10.1016/j.asoc.2017.09.038
[50] Zhou, Y., Lin, J., Guo, H. (2021). Feature subset selection via an improved discretization-based particle swarm optimization. Applied Soft Computing, 98: 106794. https://doi.org/10.1016/j.asoc.2020.106794
[51] Hühn, J.C., Hüllermeier, E. (2010). An analysis of the FURIA algorithm for fuzzy rule induction. In: Koronacki, J., Raś, Z.W., Wierzchoń, S.T., Kacprzyk, J. (eds) Advances in Machine Learning I. Studies in Computational Intelligence, vol 262. Springer, Berlin, Heidelberg. https://doi.org/10.1007/978-3-642-05177-7_16