Yanming Hao![]() | Yuan Wang
| Yuan Wang![]() | Xiang Wang
| Xiang Wang![]() | Yuan He
| Yuan He![]() | Houli Fu*
| Houli Fu*![]()
© 2024 The authors. This article is published by IIETA and is licensed under the CC BY 4.0 license (http://creativecommons.org/licenses/by/4.0/).
OPEN ACCESS
Predicting the mechanical properties of rocks is a critical technical issue in the fields of geological engineering design, disaster prevention, and resource exploration. Traditional macroscopic physical experimental methods face many limitations in analyzing rock mechanical properties, struggling to meet the current demands for efficiency, low cost, and microscopic level analysis. This study is based on image processing technology, aiming to improve the accuracy and efficiency of predicting rock mechanical properties through the quantitative analysis of high-resolution microscopic images of rocks. Although the application of image processing technology in the field of rock mechanics has made some progress, existing methods still face challenges in accuracy and automation when segmenting microscopic images of rocks. Considering these shortcomings, this paper proposes a novel rock microscopic image segmentation strategy that combines the minimum threshold method, Laplacian histogram method, and maximum interclass variance method. Additionally, this study explores methods for extracting microscopic structural parameters of rocks and analyzes the relationship between these parameters and rock mechanical properties. The results indicate that the proposed methods effectively improve the accuracy of identifying microscopic structures of rocks, thereby enhancing the understanding of rock mechanical behavior, which has substantial significance for scientific decision-making in geological engineering.
rock mechanical properties, image processing, microscopic structure analysis, image segmentation, minimum threshold method, Laplacian histogram method, maximum interclass variance method, structural parameter extraction
The accurate prediction of rock mechanical properties is of great importance for the design of geological engineering, disaster prevention, petroleum exploration, and other fields [1-3]. Traditional analyses of rock mechanical properties rely on macroscopic physical experiments, which are often time-consuming, costly, and unable to reveal details at the microscopic level [4-7]. The microstructure of rocks, such as the size, distribution, and shape of grains and pores, directly affects their macroscopic mechanical behavior. Therefore, studying the microstructure of rocks through image processing technology has become a new research trend [8, 9].
In recent years, with the rapid development of image processing technology, quantitative analysis of rock microstructures using high-resolution images has become feasible [10]. This method can provide more detailed microscopic information than traditional experiments, and predict the mechanical properties of rocks at a lower cost and faster speed [11-15]. The application of rock microscopic image processing technology has improved the accuracy of analysis, providing a more scientific basis for decision-making in geological engineering, which is of great significance for ensuring engineering safety and improving resource development efficiency.
However, existing image processing methods still have shortcomings in the accuracy and efficiency of rock microscopic image segmentation. Many traditional methods struggle with the fuzzy boundaries and complex backgrounds in rock microscopic images, leading to inaccurate segmentation results that may affect subsequent predictions of mechanical properties [16-19]. Furthermore, the extraction of parameters of rock microstructures often lacks effective automation tools, limiting the capability for large-scale data processing and analysis, thereby affecting the construction and optimization of prediction models [20-24].
The main research content of this paper revolves around two aspects. Firstly, to more accurately segment rock microscopic images, this paper introduces the minimum threshold method and the Laplacian histogram method to preliminarily segment the basic structure of the rock, and further utilizes the maximum interclass variance method to refine the segmentation of the rock's internal microstructure. Secondly, this paper studies in-depth the extraction of rock microscopic structure parameters, such as particle size, total particle area, and dimensions, and explores the relationship between these structural parameters and rock mechanical properties. Through these two parts of research, this paper not only improves the accuracy and efficiency of rock microscopic image analysis but also provides new theoretical bases and technical means for understanding and predicting rock mechanical behavior, demonstrating significant innovation and practical value.
Figure 1 shows the technical roadmap of this research. This paper first studies the segmentation of rock microscopic images for predicting mechanical properties. The minimum threshold method, commonly used for image segmentation, is based on selecting a threshold value to divide the image pixels into target and background, which is simple and requires low computational effort. Due to the complexity of rock microstructures, the minimum threshold method can serve as a preliminary segmentation means to quickly delineate general areas, providing a basis for subsequent finer analysis. The maximum interclass variance method (also known as the Otsu method) is an adaptive image segmentation method that automatically calculates the optimal threshold by a statistical method to maximize the variance between the two categories (target and background) after segmentation. In the processing of rock microscopic images, the maximum interclass variance method can precisely separate different components of the rock, especially when the boundaries of rock particles are not very clear.
Figure 1. Technical roadmap of this research
2.1 Basic structure segmentation of rocks
For the implementation of the minimum threshold method in rock microscopic image segmentation, the first step is to convert the rock microscopic images to grayscale, extract the grayscale histogram, and analyze its distribution. Then, using the minimum threshold method to process the grayscale histogram, and calculate the optimal threshold. This value should maximally differentiate the rock microstructure from the non-structural background. To enhance the segmentation effect of microstructures, the Laplacian histogram method can be further applied to intensify details. This method uses the Laplace operator to highlight the edges of the image, making the micro-fine structures within the rock, such as cracks and pores, more apparent. Assume the threshold is $\varphi$, the average gray level distribution of the object is represented by $\alpha$, the background average gray level is represented by x, and the standard deviation of the normal distribution probability density w(c) is represented by e. Calculate α and x, then calculate e. Compare e with the threshold $\varphi$, and if $\varphi$ ≤ e, then increase the value. Repeat the operation until $\varphi$ > e. The probability distribution functions are represented by O(e) and o(e), with a schematic diagram shown in Figure 2, and the derivation formula is as follows:
$o(e)=\frac{d o(e)}{d e}$ (1)
$O(e)=\int_0^e o(e) d e$ (2)
Figure 2. Schematic diagram of the probability density function
The Laplacian histogram method enhances the parts with sharp grayscale changes through the second derivative of the image, which usually corresponds to the edges or cracks in the rock structure. The result of the second derivative is to reduce the grayscale values in smoother areas, while producing high values in high-frequency details, such as edges and textures. After taking the absolute value, the constructed grayscale histogram exhibits a distinct bimodal characteristic in edge areas, making the possibly inconspicuous details of rock structures prominent. Combined with the minimum threshold method, effective segmentation of rock edge features can be achieved. By analyzing the bimodal distribution of the Laplacian histogram and calculating the optimal threshold, the minimum threshold method can automatically differentiate the basic structure of the rock from the background. When the image contrast is high, traditional global threshold methods may not effectively segment all key features, whereas the combination of local feature enhancement with the Laplacian histogram and global analysis with the minimum threshold method can achieve more accurate and robust segmentation results.
In digital image processing, an image is essentially a discrete data structure composed of a finite set of pixel points, rather than a continuous entity. Each pixel point has one or more corresponding numerical values that represent different colors or grayscale levels. Therefore, unlike traditional continuous functions, digital images cannot directly apply calculus operations from the continuous domain, such as differentiation and integration. When segmenting the basic structure of rocks, the Laplacian histogram method involves the second derivative of the image, which is clearly defined in continuous mathematics. However, in discrete image processing, it is necessary to introduce discrete forms of differential operators to approximate the effects of continuous differentiation.
Specifically, let the image grayscale levels be 1 to l, and the number of pixels with grayscale value e be v, the total number of pixels can be calculated by the following formula:
$V=\sum_{e=1}^l v_e$ (3)
The following formula calculates the probability of each grayscale level:
$o_e=\frac{v_e}{V}$ (4)
Then, the image is divided into foreground and background, corresponding to $X_1=\{1 \sim j\}$ and $X_2=\{j+1 \sim l\}$. Assuming the entire image's average grayscale value is represented by $i=\sum_{e=1}^l O_e$, the following formulas calculate the probabilities of the two parts:
The Probability of $X_1 \quad X_1 q_1=\sum_{e=1}^j o_e=q(j)$ (5)
The Probability of $X_2 \quad q_2=\sum_{e=j+1}^l o_e=1-q(j)$ (6)
The Average Value of $X_1 \quad \beta=\sum_{e=1}^j \frac{e o_e}{q_1}=\frac{i(j)}{q(j)}$ (7)
The Average Value of $X_2 \quad \alpha=\sum_{e=j+1}^l \frac{e o_e}{q_2}=\frac{i-i(j)}{1-q(j)}$ (8)
The average of the sums of the two groups of average grayscale values can be calculated by the following formula:
$\varepsilon=\frac{x+\alpha}{2}$ (9)
If $e \leq \varepsilon 1$, then continue the above calculations until $e>\varepsilon$, at which point $e$ equals the sought threshold $\varphi$.
2.2 Microstructure segmentation within rocks
The maximum interclass variance method (also known as the Otsu method) is used in image processing for automatic threshold selection. Its main advantage is the effective differentiation between the foreground and background in an image, making it particularly suitable for distinguishing microstructures within rocks. This method determines the optimal threshold by maximizing the variance between the foreground and background, thereby achieving precise segmentation of rock structures. Specifically, first, the color rock image is converted to a grayscale image for easier processing. Then, all possible thresholds are calculated for the entire image and the interclass variance is computed for each threshold, and the threshold that maximizes the interclass variance is selected as the final segmentation threshold. Finally, apply this threshold to binarize the grayscale image, thus obtaining the segmented microstructure image of the rock.
Firstly, to measure the distinction between foreground and background under different thresholds, it is necessary to calculate the average grayscale value for each area in the image. In rock image processing, this paper divides the areas into foreground (the microstructures of the rock) and background. For each possible threshold, the image is divided into two parts, and the sum of the pixel values for each part is divided by the number of pixels to obtain the average grayscale values for the foreground and background under that threshold. Assume the number of pixels with grayscale value u is represented by v, the range of grayscale levels by $D=(0,1,2, \ldots, M-1)$, and the total number of pixels by $V=\sum^{M-1}{ }_{u=0} v_u$, with the grayscale threshold represented by S, and the probability of each grayscale occurring represented by $O_u$, where $O_u=v_u / V$. The image is divided into two regions, X and Y, with the probabilities of occurrence being $O_X=\sum^S{ }_{u=0} O_u, O_Y=\sum^{M-1}{ }_{u=S+1} O_u$. The following formulas calculate the average grayscale values $\gamma_X$ and $\gamma_Y$ of regions $X$ and $Y$:
$\gamma_X=\sum_{u=0}^S \frac{uo_U}{O_X}$ (10)
$\gamma_Y=\sum_{\mathrm{u}=\mathrm{S}+1}^{M-1} \frac{\mathrm{u} o_{\mathrm{u}}}{\mathrm{o}_{\mathrm{Y}}}$ (11)
Then, to provide a measure of the dispersion of pixel grayscale values within each area, further understanding how different thresholds will affect the separation effect of rock microstructure from the background, variance for each area is calculated, that is, the average of the squares of the differences between each pixel's grayscale value and the average grayscale value of that area. The following formulas calculate the variances $\delta^2{ }_X$ and $\delta^2{ }_Y$ of regions $X$ and $Y$:
$\delta_X^2=\sum_{u=0}^S \frac{\left(u-\gamma_X\right)^2 o_u}{o_X}$ (12)
$\delta_Y^2=\sum_{u=0}^S \frac{\left(u-\gamma_Y\right)^2 o_u}{o_Y}$ (13)
The calculation of the overall average grayscale involves calculating the average grayscale value for the entire image. This is done by summing all pixel grayscale values and dividing by the total number of pixels. The following formula gives the calculation for the overall average grayscale:
$\gamma=\sum_{X=0}^{M-1} u O_u=\gamma_X O_X+\gamma_Y O_Y$ (14)
Interclass variance refers to the size of the difference between the average grayscale values of the foreground and background. For each possible threshold, calculate the average grayscale values of the foreground and background, then square the difference between these two averages. The larger this value, the more distinct the separation between foreground and background. Thus, the threshold point with the maximum interclass variance is considered the ideal segmentation point. The interclass variance for regions X and Y can be calculated by the following formula:
$\delta_j^2=O_X\left(\gamma_X-\gamma\right)^2-O_Y\left(\gamma_Y-\gamma\right)^2$ (15)
Intraclass variance refers to the average of the squares of the differences between each pixel's grayscale value and the average grayscale value of that area within the same region. The calculation of intraclass variance indicates the similarity among pixels within the same area (foreground or background). The smaller the intraclass variance, the more consistent the pixel grayscale values within the same area, indicating higher homogeneity of that area. The intraclass variance for regions X and Y can be calculated by the following formula:
$\begin{aligned} & \delta_q^2=O_X \delta_X^2+O_Y \delta_Y^2 \\ & =\sum_{u=0}^S \frac{\left(u-\gamma_X\right)^2 o_u}{O_X}+\sum_{u=S+1}^{M-1} \frac{\left(u-\gamma_Y\right)^2 o_u}{O_Y}\end{aligned}$ (16)
After calculating the intraclass and interclass variances for all possible thresholds, the total variance of the image can be computed, which measures the dispersion of all pixel grayscale values across the entire image. The total variance is a fixed value, not changing with the threshold. In the maximum interclass variance method, the interclass variance is maximized while keeping the total variance constant. Therefore, when the interclass variance is maximized, it means the differentiation between the foreground and background is maximized, and the consistency within each area is also ensured. The interclass variance coefficient is represented by $\sigma \delta_j^2$, with the corresponding optimal value represented by SMAX, the following formula gives the calculation for the total variance:
$\sigma_T^2=\sigma_k^2+\sigma_w^2$ (17)
Once the basic structure and microstructure of the rock are successfully segmented using the maximum interclass variance method, these segmentation results are further used to predict the mechanical properties of the rock. This usually involves quantifying the segmentation results and extracting key features, such as porosity, crack density, particle size distribution, and shape parameters. These features are closely related to the mechanical behavior of the rock, thus establishing the relationship between microstructural features and macroscopic mechanical properties.
3.1 Parameters of rock microstructural feature particles
The area calculation of rock microstructural particles is based on the pixel counting method in image processing technology. In the segmented binary image, particles are identified as the foreground, while the matrix or background constitutes the other parts. By counting the number of foreground pixels representing particles and combining this with the image resolution, i.e., the actual area represented by each pixel, the actual area of each particle can be obtained.
This paper defines the area ratio as the percentage of the area occupied by a specific particle or group of particles in the entire rock cross-section or analysis area. This can be calculated by comparing the area of individual particles with the total area of the rock cross-section. The area ratio is very important for characterizing the uniformity of the rock microstructure and the distribution of particles. For example, particles with a high area ratio may indicate that they play a more significant supporting role in the rock, which could affect the rock's fracture strength and deformation behavior. Assuming the total area occupied by the region of interest in the image is represented by $T_{V u}$, and the total area of the image by TS, the formula for calculating the area ratio is as follows:
$T_X=\frac{T_{V u}}{T_S}$ (18)
Particle size refers to the size of individual particles in the rock microstructure, which can be calculated by directly measuring the maximum span of particles in two-dimensional images or based on the method of equivalent circle diameter. The equivalent circle diameter is the diameter of a circle with the same area as the particle, and this parameter is commonly used in rock mechanics to describe the particle size distribution. Particle size distribution is a key parameter because it affects the contact relationship between particles, the pore structure, and the overall mechanical performance of the rock. Statistical analysis of particle size distribution can predict the strength and deformation characteristics of the rock. Assuming the particle area and perimeter are represented by T and M, respectively, the formula for calculating particle size is as follows:
$f=\frac{4 T}{M}$ (19)
3.2 Rock micro-image connected domain labeling and feature parameter calculation
In the study of extracting rock microstructural feature parameters, the first step is to batch read the rock's microscopic image dataset through automated scripts and apply the image segmentation method proposed in this paper to differentiate the various feature areas of the rock. Subsequently, binarization processing is performed, which converts the segmented image into an image containing only two colors, typically representing the area of interest, the rock particles, in white, and the background or non-analyzed areas in black. Afterward, connected region labeling is implemented via image processing software, assigning a unique identifier to each independent rock particle area for ease of subsequent analysis. Finally, these connected regions are quantified using image analysis tools, calculating their total area, size, and other morphological parameters.
In predicting and analyzing rock mechanical properties, particle size is one of the key parameters affecting rock behavior. The size, shape, and distribution of rock particles directly influence its macroscopic mechanical performance, such as strength, deformation, and fracture characteristics. Therefore, accurately identifying and measuring the particle size of each rock particle is crucial for understanding and predicting rock behavior. This paper uses an 8-connected region sequential labeling method to precisely segment each independent rock particle in the image and analyze them individually.
The first step involves the algorithm traversing every pixel in the image, checking if each pixel point A already has a label number. This is part of the initialization process, ensuring each particle can be identified and tracked.
In the second step, if pixel point A is not labeled, its neighborhood pixels are checked. In an 8-connected domain, a pixel's neighborhood includes its surrounding 8 pixels. The algorithm decides A's label number based on the labels of neighboring pixels. If there are no labeled surrounding pixels, A is assigned a new label number and records this label in the equivalence table; if there is one label number in the neighborhood, A is assigned this same label number; if there are multiple different label numbers, these labels are recorded in the equivalence table for subsequent processing, and A is assigned any one of these labels. This step is crucial for the identification of rock particles, as it ensures that every particle in the image is correctly labeled and its particle size accurately measured.
The third step requires the algorithm to re-traverse the image to correct the preliminary labeling results. In this step, based on the records in the equivalence table, labels with equivalent relationships are uniformly replaced with the smallest label number, ensuring all pixels in the same connected region have the same label number. Finally, displaying the label number at the centroid of each connected region provides an intuitive identification and location of rock particles for subsequent analysis, allowing for precise measurement and analysis of each particle's size.
By separating rock particle areas from other areas through binary image processing technology, the pixel value of rock particle areas is set to 1, while that of other areas is set to 0. This processing highlights rock particle areas in white in the image, with other areas in black. To calculate the total area of rock particles, the algorithm traverses the entire image, counting the number of pixels in the white areas. Each pixel represents a specific area unit in the image; therefore, by summing the number of white pixels, the total area of rock particles can be calculated, with the formula as follows:
$X=\sum_{a, b \in \Psi} d(a, b)$ (20)
The perimeter of the connected region is calculated using an 8-connected chain code method, with the steps as follows:
The first step requires the algorithm to start scanning from the top left corner of the binary image row by row to find the first boundary pixel of the rock particle area, denoted as t(0). This point marks the beginning of the contour tracking around the particle. At this point, initialize the number of horizontal boundary pixels VA, vertical boundary pixels VB, and the total boundary pixels V to 0, which will be used for calculating the particle's perimeter later.
In the second step, starting from t(0), the algorithm determines the second boundary pixel t(1) following the order of the 8-connected neighborhood (i.e., right, right-down, down, left-down direction counterclockwise). Once t(1) is found, V, VA, and VB are updated based on its direction. If t(1) is in the horizontal direction of t(0), VA increases by 1; if in the vertical direction, VB increases by 1. At this point, the total boundary pixels V increase by 1.
The third step involves starting from t(1) and continuing to search for the next boundary pixel t(2) in a counterclockwise direction. This step is an iterative process of boundary tracking, with V increasing by 1 with each found boundary pixel, accumulating the total number of boundary pixels. Meanwhile, record the current boundary pixel's index s for subsequent determination of whether a full contour trace has been completed.
The fourth step requires the algorithm to determine whether the newly found boundary pixel t(s) is a horizontal or vertical boundary pixel each time a new boundary pixel t(s) is found. If it's in the horizontal direction, Va increases by 1; if in the vertical direction, Vb increases by 1. This step is necessary for later calculations of the particle's perimeter, as it distinguishes the distribution of boundary pixels in different directions.
The fifth step repeats the above steps until the boundary tracking returns to the starting point t(0), indicating that a full contour trace of the particle has been completed. At this point, the number of odd connected codes VF, which is the total boundary pixels V minus the sum of the numbers of horizontal and vertical boundary pixels (VA + VB), can be calculated.
The sixth step utilizes the available data to calculate the perimeter of the rock particle. The calculation formula is provided below. For non-circular irregular particles, the perimeter of the rock particle can be converted into an equivalent diameter, a measure of particle size, calculated using the particle size calculation formula. Assuming the number of even chain codes in the horizontal and vertical directions is represented by VA and VB, and the number of odd chain codes by VF, the calculation formula is as follows:
$M=V_A+V_B+\sqrt{2 V_F}$ (21)
In this study, the results of connected region labeling can be used to differentiate and identify different particle areas in rock samples, while the calculated area and perimeter data of particle areas provide quantitative morphological characteristics of particles. By analyzing geometric parameters based on area and perimeter, such as shape factor, roundness, and smoothness, it's possible to infer the fragmentation and contact area of particles. These geometric parameters have a direct correlation with rock mechanical properties like compressive strength and elastic modulus. For example, smoother and more regularly shaped particles generally indicate better compressive capacity and higher overall stability. Through correlational analysis of these morphological characteristics with rock mechanical parameters, mathematical models can be established to predict and analyze the mechanical behavior of untested rock samples, enabling effective prediction of rock mechanical properties. This method enhances analysis efficiency, reduces costs, and provides important information for understanding rock behavior in different engineering environments.
From Tables 1, 2, and 3, we can observe the performance of various rock micro-image segmentation methods under different standard deviations. The standard deviation represents the level of noise in the image, simulating different degrees of image quality variations encountered in actual situations. Across all three tables, the segmentation method proposed in this paper demonstrates significant superiority in three metrics measuring segmentation quality (MCR, PSNR, EPM). A lower MCR (Misclassification Rate) indicates a smaller proportion of misclassified pixels, a higher PSNR (Peak Signal-to-Noise Ratio) indicates better image quality, and a lower EPM (Error Pixel Mapping) indicates a smaller proportion of incorrectly segmented pixels. The values for MCR and EPM with the proposed method are significantly lower than those for CycleGAN and GrabCut, and its PSNR values are substantially higher than the other two methods. This indicates that the proposed method provides more accurate segmentation, maintaining robust performance even at higher noise levels. Analyzing the above experimental results, we can conclude that the rock micro-image segmentation method proposed in this paper significantly outperforms the CycleGAN and GrabCut methods in terms of noise resistance and segmentation accuracy. By combining the minimum threshold method and the Laplacian histogram method to preliminarily process the basic structure of the rock, and then using the maximum interclass variance method to refine the segmentation of the microstructure, the proposed method effectively enhances segmentation accuracy. Even under gradually increasing noise levels, the proposed method still maintains a lower misclassification rate and error pixel mapping, as well as a higher peak signal-to-noise ratio, emphasizing its effectiveness and practicality in rock micro-image processing.
Table 1. Comparison of MCR among different rock micro-image segmentation methods
|
Standard Deviation |
10 |
11 |
12 |
13 |
14 |
15 |
|
CycleGAN |
12.3256 |
13.2356 |
13.6895 |
13.2458 |
12.3698 |
12.5485 |
|
GrabCut |
0.5124 |
0.8215 |
1.2658 |
1.6789 |
2.1325 |
2.6985 |
|
Proposed Segmentation Method |
0.0512 |
0.0721 |
0.0879 |
0.1236 |
0.1569 |
0.2215 |
Table 2. Comparison of PSNR among different rock micro-image segmentation methods
|
Standard Deviation |
10 |
11 |
12 |
13 |
14 |
15 |
|
CycleGAN |
13.2658 |
13.5689 |
13.5684 |
13.2647 |
13.2658 |
13.1457 |
|
GrabCut |
28.2154 |
25.6987 |
24.5123 |
23.5689 |
21.4578 |
22.2369 |
|
Proposed Segmentation Method |
37.8995 |
36.1245 |
36.5248 |
34.2658 |
32.4178 |
31.2658 |
Table 3. Comparison of EPM among different rock micro-image segmentation methods
|
Standard Deviation |
10 |
11 |
12 |
13 |
14 |
15 |
|
CycleGAN |
0.6235 |
0.6147 |
0.6258 |
0.6125 |
0.6235 |
0.5895 |
|
GrabCut |
0.9147 |
0.8795 |
0.8326 |
0.8145 |
0.7458 |
0.7156 |
|
Proposed Segmentation Method |
37.9854 |
36.1245 |
35.6985 |
33.1245 |
32.5689 |
31.2547 |
Table 4. Data comparison of porosity calculations for rock samples by different methods
|
Rock Sample Number |
Morphological Analysis Method |
The Proposed Method |
Rock Sample Number |
Morphological Analysis Method |
The Proposed Method |
|
1 |
1.85 |
6.63 |
18 |
2.15 |
11.23 |
|
2 |
1.69 |
7.12 |
19 |
2.23 |
12.15 |
|
3 |
1.73 |
6.89 |
20 |
2.35 |
6.78 |
|
4 |
1.82 |
6.89 |
21 |
4.56 |
8.23 |
|
5 |
1.63 |
6.87 |
22 |
4.62 |
8.21 |
|
6 |
1.67 |
6.78 |
23 |
1.57 |
7.78 |
|
7 |
1.59 |
6.89 |
24 |
4.88 |
9.21 |
|
8 |
1.71 |
6.45 |
25 |
2.12 |
8.12 |
|
9 |
1.82 |
6.89 |
26 |
1.39 |
8.62 |
|
10 |
1.71 |
6.32 |
27 |
2.14 |
6.78 |
|
11 |
1.12 |
4.89 |
28 |
2.23 |
6.69 |
|
12 |
0.94 |
4.32 |
29 |
1.65 |
8.69 |
|
13 |
0.82 |
3.79 |
30 |
2.18 |
8.89 |
|
14 |
0.81 |
3.76 |
|
|
|
|
15 |
1.12 |
4.23 |
|
|
|
|
16 |
1.23 |
5.23 |
|
|
|
|
17 |
1.69 |
6.35 |
|
|
|
Table 4 presents a comparison of porosity data for rock samples calculated by two different methods, covering 35 rock samples with different numbers. Comparing the porosity data obtained by the morphological analysis method and the proposed method, it is evident that the porosity calculated by the proposed method is generally higher than that obtained by the morphological analysis method. The porosity data calculated by the proposed method show larger values, meaning that the proposed method is more sensitive and precise in identifying and calculating pore spaces. Especially in samples with high porosity, the difference between the proposed method and the morphological analysis method is more pronounced, indicating that the proposed method has better resolution in rock samples with higher porosity.
From the comprehensive analysis of these data, we can conclude that the porosity calculation method proposed in this paper is more effective in extracting microstructural parameters, especially when dealing with samples with complex pore structures. The proposed method employs more advanced image analysis technology or introduces more detailed parameter considerations, thus providing more comprehensive and accurate porosity measurements.
Table 5. Analysis results of rock porosity, maximum particle area, and particle size variance regression analysis
|
|
df |
SS |
MS |
F |
Significance F |
|
Regression Analysis |
3 |
221.235 |
71.23458 |
31.15489 |
7.25468E-06 |
|
Residuals |
12 |
27.65415 |
2.356248 |
|
|
|
Total |
14 |
235.2356 |
|
|
|
|
|
Coeffcients |
Standard Deviation |
tStat |
P-value |
Lower95% |
|
Intercept |
6.78546245 |
3.526345 |
1.887951 |
0.081457 |
-1.123257485 |
|
Maximum Void Diameter |
-0.0087956 |
0.01526 |
-0.51264 |
0.612358 |
-0.044512568 |
|
Particle Area |
0.03624589 |
0.00658 |
5.523154 |
0.000124 |
0.021458579 |
|
Particle Size |
-0.001236 |
0.000514 |
-2.64259 |
0.017895 |
-0.002315487 |
Table 6. Regression statistical results of rock porosity with maximum particle area and particle size
|
Regression Statistics |
|
|
Multiple R |
0.92358795 |
|
R Square |
0.87451263 |
|
Adjusted R Square |
0.84521685 |
|
Standard Error |
1.53264859 |
|
Observations |
15 |
From the variance analysis results in Table 5, it can be seen that the significance F value of the regression model is 7.25468E-06, far less than the commonly used significance level of 0.05, indicating that the model's regression effect is significant, meaning at least one predictive variable in the model is effective for predicting rock porosity. Specifically, the P value for the maximum particle area is 0.000124, far less than 0.05, indicating a significant positive impact on porosity, while the P value for particle size is 0.017895, also less than 0.05, indicating a significant negative impact on porosity. The P value for the maximum void diameter is higher, indicating its impact on porosity is not significant. Table 6 further reveals the regression statistical results, where the R Square value is 0.8745, indicating that about 87.45% of the variation in porosity can be explained by the predictive variables in the model, showing strong explanatory power of the model.
Integrating these analysis results, we can conclude that the rock microstructural parameter extraction method and porosity prediction model proposed in this paper are effective. The maximum particle area, as a positive influencing factor, has a significant correlation with rock porosity, and particle size, as a negative influencing factor, also has a significant correlation with porosity. These findings validate the complex relationship between microstructural parameters and rock mechanical properties, and emphasize the importance of these parameters in predicting and understanding rock porosity.
Further, this paper analyzes the fractal characteristics of porosity using core samples and explores the relationship between the pore fractal dimension and rock mechanical properties. Comparing rock samples under core classification with their fractal dimensions in Figure 3, a consistency between them is found, indicating that fractal dimension can serve as an indicator to identify and differentiate the pore structure characteristics of different rock samples. However, the content of rock samples and fractal dimension do not show a simple positive correlation, indicating that rock sample content is not the sole factor controlling pore distribution. The development of pores in rocks is affected by multiple factors, such as mineral composition, rock genesis, stress conditions, etc. Moreover, when ignoring the precondition of rock sample classification, the relationship between rock sample content and fractal dimension has a low degree of linear fit, indicating no apparent correlation without considering specific rock sample conditions. From these experimental results, it can be concluded that the complexity of rock microstructure leads to the relationship between porosity and rock mechanical properties not being fully described by linearity or a single variable. Fractal dimension, as a quantitative indicator of pore structure complexity, shows a certain degree of correlation with rock mechanical properties under the context of rock samples, but this correlation is influenced by the combined effects of rock type, composition, and other factors affecting pore development.
Figure 3. Relationship between different rock samples and fractal dimension
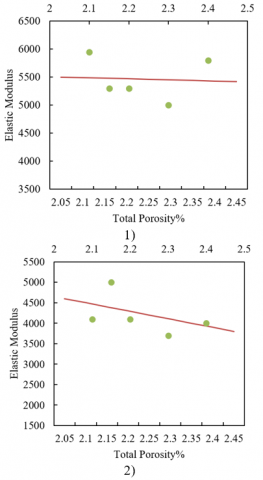
Figure 4. Relationship between rock sample porosity and elastic modulus
In the experimental research of this paper, by meticulously extracting rock microstructural parameters such as particle size, particle size distribution, and total area, a discussion on the relationship between rock mechanical properties and microstructure was conducted. The experimental data in Figure 4 shows that there is a certain relationship between total porosity and the rock's elastic modulus. Specifically, before the experiment, the correlation coefficient R2 between total porosity and elastic modulus was only 0.0047, indicating almost no correlation. However, after the experiment, the correlation coefficient significantly increased to R2=0.455, suggesting the experimental process affected the rock microstructure, thereby altering its elastic modulus. This lower but significant correlation coefficient hints that although there is a correlation between porosity and elastic modulus, the total porosity of the rock is not the sole factor affecting the elastic modulus, and the rock's macroscopic stratification structure and other characteristics also contribute.
Further analysis shows that rock porosity has a negative correlation with its elastic modulus: as porosity increases, the elastic modulus gradually decreases, which is reflected in the linear relationship in Figure 4-2. This negative correlation reveals an important mechanical behavior, that rocks with higher porosity exhibit more plastic characteristics under stress, reflecting a decrease in the rock's elastic capabilities. This finding is significant for predicting and analyzing the mechanical response of rock materials in engineering applications, emphasizing the need to comprehensively consider microstructural characteristics, especially porosity, when assessing the structural integrity and long-term stability of rock materials.
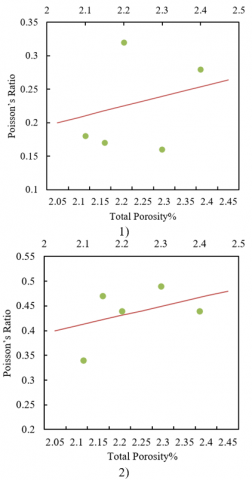
Figure 5. Relationship between rock sample porosity and Poisson's ratio
In this study, an in-depth analysis of rock microstructure, including particle size, total area, and dimensions, was performed, further exploring the relationship between these microstructural parameters and rock mechanical properties, particularly Poisson's ratio. By comparing changes in Poisson's ratio before and after the experiment, a significant impact of total porosity on Poisson's ratio was observed. The correlation coefficient for Poisson's ratio increased from R2=0.1079 to R2=0.2811 before and after the experiment, showing a clear upward trend. This indicates that, although the correlation coefficient is not high, the impact of total porosity on Poisson's ratio is significant during the experimental process. Importantly, it is recognized that porosity is just one of many influencing factors; rock's strain characteristics are not only affected by the internal pore structure but also closely related to the content and distribution of mineral components.
Continuing to analyze the relationship between Poisson's ratio and porosity, experimental results revealed a key indicator of rock plastic characteristics: as porosity increases, Poisson's ratio also tends to rise, clearly demonstrated in Figure 5-2. A higher Poisson's ratio means the rock's lateral expansion capability under vertical compression is enhanced, indicating stronger plasticity of the rock. This trend is crucial for understanding the deformation behavior of rocks under stress. Therefore, it can be concluded that an increase in porosity leads to a rise in Poisson's ratio, thereby affecting the rock's plastic response. In predicting and analyzing rock mechanical properties, considering microstructural parameters like porosity is indispensable for accurately predicting the behavior of rock in engineering applications.
This paper has made significant progress in exploring the relationship between rock microstructure analysis and rock mechanical properties. Firstly, the research successfully preliminarily segmented the basic structure of rocks using the minimum threshold method and Laplacian histogram method, followed by a more refined subdivision of the rock's internal microstructure using the maximum interclass variance method, greatly improving the accuracy of rock micro-image segmentation. The effective combination of these methods not only enhanced the identification of rock microstructure but also laid a solid foundation for subsequent structural parameter extraction.
In terms of extracting rock microstructural parameters, this paper conducted a quantitative analysis of key parameters such as rock particle size, total particle area, and dimensions, systematically comparing these parameters with rock mechanical properties. The experimental results showed that there is a complex but identifiable correlation between rock sample porosity, maximum particle area, and particle size variance with mechanical properties of the rock such as elastic modulus and Poisson's ratio. Especially, the study revealed how changes in porosity affect the plastic and elastic response of rocks, providing a new perspective for understanding the deformation behavior of rocks under stress.
Overall, this paper confirmed the feasibility of using detailed microstructural parameters to predict rock mechanical properties and provided an effective set of image segmentation and data analysis methods for such research. These findings are significant for the design and prediction of rock engineering, helping engineers better understand and address the behavior of rock materials in practical applications.
Future research could further explore the relationship between the microstructure and mechanical properties of different types of rocks, especially their performance under various environmental conditions. Moreover, by integrating modern image processing technology and machine learning algorithms, the automation and accuracy of rock microstructural segmentation and parameter extraction can be further enhanced, thereby providing a more powerful tool for predicting rock mechanical properties. Simultaneously, a deeper understanding of multi-physics problems, such as complex fracture networks, pore structures, fluid flow, and stress-strain relationships within rocks, is also expected to be achieved through the research methods discussed in this paper.
[1] Chai, C., Zhang, G., Wu, X. (2019). Analysis of structural characteristics and geological mechanics of rock mass in Jinshajiang extra large bridge. Journal of Railway Engineering Society, 36(2): 27-32.
[2] Li, C., Shi, Z., Li, J., Xiang, Y. (2022). Numerical analysis of mechanical response characteristics of jointed tunnel surrounding rock under dynamic loading. Journal of Physics, 2242(1): 012029. https://doi.org/10.1088/1742-6596/2242/1/012029
[3] Luo, T., Huang, Q., Chen, Y., Xu, J., Chen, S. (2023). Mechanical response characteristics analysis of tunnel surrounding rock during near-fault construction. Journal of Engineering Science and Technology Review, 16(1): 145-151. https://doi.org/10.25103/jestr.161.19
[4] Bao, H., Chang, J., Wu, F., Liang, N., Xu, J. (2015). Analysis of strength characteristics of rock mass based on statistical mechanics of rock mass. Yantu Lixue/Rock and Soil Mechanics, 36(8): 2361-2369. https://doi.org/10.6052/j.issn.1000-4750.2015.03.0229
[5] Carbillet, L., Wadsworth, F.B., Heap, M.J., Baud, P. (2023). Microstructural controls on the uniaxial compressive strength of porous rocks through the granular to non-granular transition. Geophysical Research Letters, 50(21): e2023GL104678. https://doi.org/10.1029/2023GL104678
[6] Fu, J., Wang, M., Chen, B., Wang, J., Xiao, D., Luo, M., Evans, B. (2023). A data-driven framework for permeability prediction of natural porous rocks via microstructural characterization and pore-scale simulation. Engineering with Computers, 39(6): 3895-3926. https://doi.org/10.1007/s00366-023-01841-8
[7] Bai, Q., Zhang, C., Konietzky, H., Young, R.P. (2022). Simulation of seismic velocity changes in brittle rocks subjected to triaxial stresses using 3-D microstructural models. Geophysical Journal International, 231(1): 552-566. https://doi.org/10.1093/gji/ggac203
[8] Bandura, L., Pałka, K., Leśniak, M., Franus, W. (2024). Microstructural characterization and the influence of the chemical composition of the raw material mix on the physicochemical characteristics of waste-derived ceramic aggregates. Journal of Building Engineering, 84: 108376. https://doi.org/10.1016/j.jobe.2023.108376
[9] Qin, Z., Zhang, Y., Zhang, S., Zhao, J., Wang, T., Shen, K. (2019). Identification of microscopic damage law of rocks through digital image processing of computed tomography images. Traitement du Signal, 36(4): 345-352. https://doi.org/10.18280/ts.360407
[10] Peng, L., Li, M., Wang, Z., Zuo, J., Liu, D. (2023). Study of the damage and cracking of heterogeneous rocks based on the FFT method-A comparison of computer generation and image reconstruction models. Engineering Geology, 325: 107284. https://doi.org/10.1016/j.enggeo.2023.107284
[11] Zhao, Z., Shou, Y., Zhou, X. (2023). Microscopic cracking behaviors of rocks under uniaxial compression with microscopic multiphase heterogeneity by deep learning. International Journal of Mining Science and Technology, 33(4): 411-422. https://doi.org/10.1016/j.ijmst.2022.12.008
[12] Yan, W., Chi, P., Golsanami, N., Sun, J., Xing, H., Li, S., Dong, H. (2023). Analysis of reconstructed multisource and multiscale 3-D digital rocks based on the cycle-consistent generative adversarial network method. Geophysical Journal International, 235(1): 736-749. https://doi.org/10.1093/gji/ggad271
[13] Visalli, R., Giuffrida, M., Viccaro, M. (2023). Unraveling textural and chemical features in volcanic rocks through advanced image processing: A case study from the 2019 paroxysmal eruptions of Stromboli. Geochemistry, Geophysics, Geosystems, 24(3): e2022GC010774. https://doi.org/10.1029/2022GC010774
[14] Wang, S., Tan, M., Wu, H., Li, Y., Xie, G., Zhang, L. (2022). A digital rock physics-based multiscale multicomponent model construction of hot-dry rocks and microscopic analysis of acoustic properties under high-temperature conditions. SPE Journal, 27(5): 3119-3135. https://doi.org/10.2118/209785-PA
[15] Yarmohammadi, S., Wood, D.A., Kadkhodaie, A. (2020). Reservoir microfacies analysis exploiting microscopic image processing and classification algorithms applied to carbonate and sandstone reservoirs. Marine and Petroleum Geology, 121: 104609. https://doi.org/10.1016/j.marpetgeo.2020.104609
[16] Roslin, A., Lebedev, M., Mitchell, T.R., Onederra, I.A., Leonardi, C.R. (2023). Processing of micro-CT images of granodiorite rock samples using convolutional neural networks (CNN). Part III: Enhancement of Scanco micro-CT images of granodiorite rocks using a 3D convolutional neural network super-resolution algorithm. Minerals Engineering, 195: 108028. https://doi.org/10.1016/j.mineng.2023.108028
[17] Li, L., Wang, W., Wang, M., Chen J., Khatoon, A. (2023). Rock aperture image acquisition and processing based on Mehanics moment, Steger theory and Fractal analysis. Geoenergy Science and Engineering, 230: 212236. https://doi.org/10.1016/j.geoen.2023.212236
[18] Liu, G., Chen, Y., Du, X., Wang, S., Fernández-Steeger, T.M. (2022). Evolutionary analysis of heterogeneous granite microcracks based on digital image processing in grain-block model. Materials, 15(5): 1941. https://doi.org/10.3390/ma15051941
[19] Liang, F., Zhang, J., Liu, H.H., Zhang, S. (2020). Microscopic scale experimental investigation into fracturing fluid uptake pathways for tight carbonate source rocks. In International Petroleum Technology Conference 2020, Kingdom of Saudi Arabia. https://doi.org/10.2523/IPTC-20093-MS
[20] Guibert, R., Nazarova, M., Voltolini, M., Beretta, T., Debenest, G., Creux, P. (2022). Influence of standard image of 3D X-ray microscopy on morphology, topology and effective properties. Energies, 15(20): 7796. https://doi.org/10.3390/en15207796
[21] Zhang, C., Li, D., Ma, J., Zhu, Q., Luo, P., Chen, Y., Han, M. (2023). Dynamic shear fracture behavior of rocks: Insights from three-dimensional digital image correlation technique. Engineering Fracture Mechanics, 277: 109010. https://doi.org/10.1016/j.engfracmech.2022.109010
[22] Peesu, R.R., Voleti, D.K., Dutta, A., Vanam, P.R., Reddicharla, N. (2022). Automated image processing of petrographic thin sections for digital reservoir description: A bridge to correlate with core and NMR data. In Abu Dhabi International Petroleum Exhibition and Conference, Abu Dhabi, UAE, pp. D012S145R004. https://doi.org/10.2118/211691-MS
[23] Sui, W., Wang, Y., Li, J. (2023). Microscopic study of shale anisotropy with SEM in situ compression and three-point bending experiments. Energies, 16(5): 2440. https://doi.org/10.3390/en16052440
[24] Al-Mukainah, H.S., Hussaini, S.R., Dvorkin, J.P. (2022). Electrical formation factor versus porosity coarse-scale transforms from microscopic digital images: Example-based study. Journal of Petroleum Science and Engineering, 210: 110054. https://doi.org/10.1016/j.petrol.2021.110054