Pralhad Gavali![]() | J. Saira Banu*
| J. Saira Banu*![]()
© 2024 The authors. This article is published by IIETA and is licensed under the CC BY 4.0 license (http://creativecommons.org/licenses/by/4.0/).
OPEN ACCESS
Birds significantly contribute to ecosystem maintenance, involving seed dispersion, air oxygenation, contaminant conversion into nutrients, and climate regulation. However, with over ten thousand bird species described globally, accurate identification based solely on their appearances poses a challenge, even for experienced bird watchers, leading to potential discrepancies in species classification. This difficulty highlights the challenges that both human intelligence and artificial intelligence encounter when accurately identifying bird species. To address this challenge, we propose an automatic bird species classification system using deep learning techniques. Our study leverages the power of deep learning in computer vision to assist novice bird enthusiasts in accurately identifying the plethora of bird species they encounter. We gathered and utilized a diverse dataset of bird images to train a convolutional neural network (CNN) model. Our classification system, developed through training and careful evaluation has shown accuracy, in identifying different bird species using images. This system serves as a tool in real world situations allowing bird enthusiasts to gain an appreciation for the diverse range of avian species and actively contribute to conservation efforts. Our classification system, which has been extensively trained and thoroughly evaluated has proven to be highly accurate, in identifying bird species based on images. It provides a tool for bird enthusiasts to truly appreciate the range of avian species and contribute to conservation efforts. Our research introduces an efficient approach, based on learning for automatically classifying bird species from images. This addresses the challenges faced by both experts and non experts in identifying birds. Our designed deep convolutional neural network (DCNN) achieved an accuracy rate of 92% ensuring precise recognition of various species. This system plays a role in preserving and comprehending bird ecosystems emphasizing their contribution, to maintaining global landscapes and climate stability.
deep learning, feature extraction, image classification, Birdnet architecture, Indian birds, bird species classification
Some species can be difficult to classify due to their rarity and elusiveness. From a human perspective, it is perfectly normal for birds to present themselves in a myriad of poses and display a wide range of shapes, sizes, colors and moods. Furthermore, images offer distinct variations that simplify bird species recognition compared to auditory classification. The ability for humans to identify birds from photographs is also more intuitive.
Bird species identification is a complex task that often results in ambiguous labels. Even experienced bird watchers occasionally dispute the species when presented with a bird image. This challenging problem stretches both human and computer visual capabilities. Despite possessing the same basic elements, different bird species can exhibit strikingly distinct shapes and appearances. The intra-class variation is notably high due to significant changes in lighting, background, and posture. Our study harnesses the power of machine learning to assist novice bird watchers in identifying diverse bird species from the images they capture.
Bird watching is gaining popularity worldwide as a hobby or extracurricular activity. It offers a low-cost way to connect with nature in the modern world and serves as an excellent stress reliever. Moreover, bird watching promotes environmental conservation by tracking the behavior, migration patterns, numbers, and ecological status of various bird species. To aid in data collection for sustainable bird research, it is crucial to encourage more people to engage in bird watching. Even for beginners, bird identification can sometimes be challenging. Bird species are generally regarded as valuable indicators of biodiversity. Behavioral changes at the population level are observable and quantifiable, responding to alterations in delicate ecosystems. Given the diversity of species, identifying a bird's subtype based solely on appearance can be difficult for non-experts. However, professional interpretation of each image is time-consuming. Thus, a system that actually classifies species is needed. This system will be useful in real-world situations. By automatically classifying and analyzing images, it eliminates the need for field researchers to rely on image catalogs. The general audience may find this strategy more appealing when it is paired with cultural products like poetry and folklore. It might encourage people to get interested in birds and contribute to their conservation. Species recognition, sometimes referred to as subgroup recognition, object recognition, or grain quality classification, is an intriguing field of study. Recent advances in grain classification have strayed beyond simple classification, posing fresh difficulties and piquing interest in computer vision and maybe opening up new application avenues. It is possible to recognize someone by their voice, appearance or video. In a similar vein, recording bird sounds can be used to develop an identification system. However, the variety of sounds in the environment—including sounds made by insects and other real-world objects—makes it harder to comprehend this information. People are usually more impacted by pictures than by words or films. For this reason, it is better to use a picture for bird classification than a video or aural input. For humans and even for automated computer systems, bird identification is a difficult undertaking.
2.1 Classification challenge of bird species
The Bird Species Classification Challenge is an ambitious effort to broaden a robust and accurate tool able to identifying and classifying bird species from excessive-decision images. The major aim of this challenge is to offer a valuable device for bird watchers, researchers and conservationists to enhance their knowledge of hen diversity and make contributions to environmental conservation efforts. However, the assignment of classifying bird species in pics provides many difficulties, including:
1. Differences in Intensity: Light and depth in pictures taken at different times of the day can vary significantly, making it difficult to identify distinctive species of birds.
2. Bird Pose: Birds can be visible soaring, perching, and sitting in a number of conditions. The categorization manner is made greater difficult through those position changes.
3. Numerous Birds in Images: Proper categorization calls for exactly figuring out and locating each bird in pix that contain numerous birds.
4. Photographs of birds: May have a wide variety of backgrounds that can reason distractions and wrong classifications.
5. Occlusion: Some bird species might be difficult to find out as it should be in images due to the truth, they'll be hidden by using foliage, tree branches, or specific subjects.
6. Size and Area Variations: The period and vicinity of the hen visible inside the images can vary, further complicating the class assignment.
7. Imbalanced Data: The dataset may additionally have fewer pattern images constant with elegance, ensuing in imbalanced class distributions which could affect the model's performance.
An advised technique involves training a deep mastery model with machine gaining knowledge of strategies, usually fantastic-grained type, to conquer these challenging scenarios. The model will be designed to extract significant capabilities from bird pictures and take care of versions in poses, backgrounds, and occlusions.
It is a complex process to categorize Indian bird species using set of audios. Moreover, the segmentation of audio manually is time-consuming and complex process, but some techniques has employed manual segmentation while other has employed automatic birdsong segmentation, which becomes complex to detect any acoustic tasks. Hence, the motive is to design a model for Indian bird species classification using set of images.
Recently, a number of attempts to automatically classify birds based on auditory information rather than visual information. Since that different species have various cries, sight distance is not required for detection thanks to feature extraction using audio data. There are several disadvantages, too, including the inability to accurately determine the total amount of birds and the likelihood that a certain bird can go for a lengthy period of time without making any sound. Because of these factors, there are more research using computer vision and image-based methods to solve this issue. A technique to leverage motion characteristics such curvature and wing beat frequency was put out there.
Alghamdi et al. [1] develops an accumulation of audio features namely Perceptual, Descriptive and Harmonic Features (PDHFs) for classification of bird species. In addition, the classification outcomes enhanced when different birds were categorized structure of bird vocalization. The technique did not to devise a classifier which classifies structures of vocalization.
Yang et al. [2] developed an enhanced transfer-learning bird classification model for attaining the accurate categorization of Protected Indonesia Birds (PIB) which has been detected as an endangered bird species. To detect the protected animals, it failed to detect the designed series of BNDFC layers.
Gómez-Gómez et al. [3] designed a comparative assessment of efficiency of three deep models for classifying the bird species using Western Mediterranean Wetland Birds dataset. The method attained elevated classification accuracy, but it did not enhance the categorization and lessen confusion amid bird species of similar genre.
Gupta et al. [4] design a deep model for analyzing the bird acoustics using various bird species. The method utilized spectrograms based on bird audio recordings using certain dataset. The method removed background noise and overlapped bird vocalizations. The method provided more precise outcomes, but was unable to discover different species of bird calls.
Chandra et al. [5] developed a deep model for analyzing the bird acoustics using 100 bird species. The method did not validate the bird breed whether it is contained in that specific forest region or not. Rai et al. [6] devised deep techniques with the notion of image processing which aids in determining the bird species. The technique did not execute any enhanced digital automation that aids in recreating image processing software.
Triveni et al. [7] utilized deep models for detecting the species of birds using birds images. The method trained all birds and produced a model and then applied deep model for predicting the bird species. However, it was complex without the help of utilizing the database and tensor flow of deep model.
Li et al. [8] and Fleet et al. [9] aimed to comprehend the alteration of species composition using Altai Mountains of China. The method utilized two climatic aspects that include Annual Precipitation (AP) and Annual Mean Temperature (AMT). The method used Liner Regression technique for exploring the correlation amid bird species richness and environmental attributes. It cannot able to enhance the outcomes of bird conservation.
To increase the model's capacity to concentrate on discriminative regions of bird images, articles [10-12] suggest CNN-based methods for identifying and classifying different bird species. These works exhibit encouraging outcomes on datasets of bird species, highlighting the potential of CNNs with attention mechanisms for detailed bird species identification tasks.
Audio-Based Methods:
An approach used in earlier research for the type of bird species involves audio-based overall techniques. Some authors of the study investigated the classification of bird species using audio recordings of bird songs. To capture distinct auditory styles for distinct bird species, spectrogram analysis, feature extraction, and other audio processing techniques were used [13]. Audio-based methods are capable of recognizing birds solely through their vocalizations, but they will face challenging circumstances in settings with background noise and competing bird calls.
Visual Attribute-Based Methods:
Another line of research focuses on visual attribute-based methods, which aim to identify distinctive visual characteristics of bird species. The author of the study investigated the classification of bird species using Pose Normalized Deep Convolutional Nets [14]. The authors used deep convolutional neural networks (CNNs) to recognize birds from images. The approach involved normalizing bird poses to improve classification accuracy [15]. Visual attribute-based methods offer valuable insights into bird species identification, but they may struggle with varying backgrounds, occlusions, and pose variations that hinder accurate classification.
Deep Learning-Based Methods:
With the usage of deep gaining knowledge of-based strategies, the categorization of chook species has made extensive development. The paper ‘A fine- grained recognition neural network’ used deep gaining knowledge of the strategies of a fine-grained bird recognition method based on a graph attention pyramid to solve the fine-grained problem with bird image recognition [16]. The use of deep gaining knowledge of for problems requiring fine-grained categorization, consisting of bird species class, is validated in this approach. Deep CNNs had been utilized for massive-scale photograph popularity duties, together with figuring out fowl species, inside the Large-Scale Visual Recognition Challenge 2014 (ILSVRC2014) via Russakovsky and colleagues [17].
The Indian Bird Species dataset was incorporated into this newsletter.
To ensure complete and accurate adaptation, pre-processing is essential. To perform pre-processing, the Kalman filter is utilized.
The training dataset includes 158 images and the testing dataset contains 158 images. The dataset's snapshots have varying sizes, ranging from 800×600 pixels to 4000×6000 pixels, guaranteeing a wide range of photo resolutions.
As cited, the dataset has an uneven distribution of species, with a few species having best five images while others have as many as 20 pics. The model's overall performance may be impacted by using the commonplace task of sophistication imbalance in system mastering responsibilities. To deal with this, records augmentation strategies suggested through Kumar and Das [18] had been implemented to boom the dataset length and stability the elegance distribution.
Data augmentation involves growing new samples from present records by means of applying various changes, which include rotation, flipping, zooming, and moving. These ameliorations assist in diversifying the dataset and decreasing overfitting, in particular while there are confined samples in keeping with elegance.
6.1 Data augmentation
To increase the amount of sample training per class and decrease the effects of class imbalance, data augmentation is performed. Each class of bird has a different kind; hence we perform transformations in the geometric and color spaces chosen for that class. for that class Sharpening, adding values to each pixel's channel, multiplying the values added to each channel, flipping, contrast, hue, and Gaussian blurring are some of these techniques. Generative adversarial networks (GANs) created using the small dataset over fit the information and did not generalize effectively to the 150 images. After data augmentation, the training dataset increased from 150 photographs to 1330 photos.
6.2 Bird ROI detection
Pre-trained Object Recognition deep nets are used to filter out background components or areas and also capture features solely from the bodies of the birds. Each picture from the training and test datasets was localized for bird using CNN in this model [19]. After receiving the features for the image being processed from CNN, the region proposal network (RPN) layer can be used to generate region proposals (Anchors/Bounding Box). In order to classify the picture within the proposed region and forecast the offset values with R-CNN for the bounding boxes, the projected regions suggested are then reconfigured using a Region of Interest Pooling (RoIP) layer. Future study will also take into account CNN's increasing significance for object identification and recognition. This strategy is feasible, as evidenced by preliminary findings from the Pyfaster object detection and recognition using the COCO dataset (http://mscoco.org). Small things that emerge in clusters are tricky to find has the challenge which encountered during the bird ROI detection process as the model develops the ability to forecast bounding boxes from the input itself, it struggles to generalize objects in novel or unusual aspect ratios. Finally, we employed the pre-trained weights of the CNN [20].
6.3 Adaptive learning
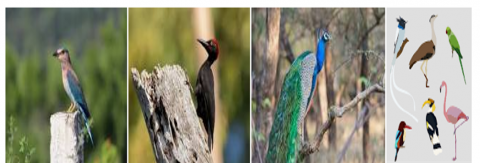
In this example, we have applied a transfer learning-based technique to understand both micro and macro level attributes extracted from bird photographs for classification. The sample CNN based cropped bird images are shown in the Figure 1.
Figure 1. CNN cropped birds images
To set up our Deep net model for training, we used ImageNet [10] pre-trained weights. With ImageNet, 1.2 million images are organized into 1000 categories. By using pre-trained ImageNet weights during model training, we may learn in advance the more particular & discriminative qualities of deepnet for each bird species, as well as the fine-grained as well as public level features [13].
6.4 Combinatorial model architecture
With the help of the deep net architectures InceptionResNetV2 and InceptionV3, we created a hybrid model as our classification model. The prediction vector for each picture is constructed during testing using the InceptionResNet V2 [11] and Inception V3 [12, 13] weights. CNN gives two examples:
(1) Birds Identification:
If a Mask R-CNN identifies birds in the image, it generates a sequence of clipped bird pictures [21]. The whole batch is analyzed for that specific image using the two distinct network weights. The species of bird is eventually identified through comparison of both prediction vectors, with the largest weight also referred to as predictions confidence value.
(2) Bird Misidentification:
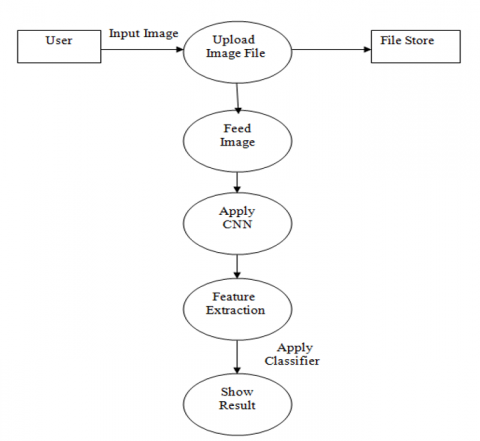
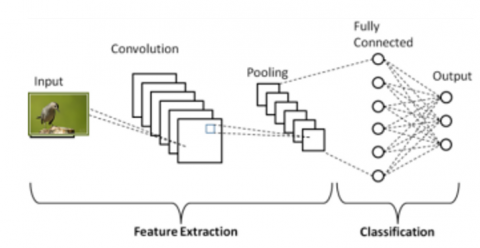
The whole picture is given for such bird species utilizing both architectural weights [22]. Yet, there aren't many examples of this. The predicted vector includes the species with the highest predicted value. The procedure of detecting birds with CNN and categorizing species using ImageNet models is depicted in Figure 2.
(a) Bird species workflow for proposed system
(b) DCNN model process
Figure 2. Birdnet architecture modules of proposed system
For the purpose of increasing the model's accuracy, we performed multi-stage training. This hybrid model combines the strengths of two deep learning architectures: InceptionResNetV2 and InceptionV3. The goal is to improve the classification performance for bird species identification from images.
(3) Multi-Stage Training Process:
Each step or stage of the multi-stage training process has a distinct function within the training pipeline. Using the InceptionResNetV2 architecture and a sizable dataset of tagged bird photos, the basic model is initially trained. Because of its strong feature extraction capabilities and efficiency in image recognition tasks, the InceptionResNetV2 model was selected.
The second stage involves further fine-tuning and transfer learning using the pre-trained InceptionV3 model [23]. The training pipeline incorporates the InceptionV3 architecture to take use of its distinct features and extract more discriminative information from the bird photos.
The purpose of the multi-stage training procedure is to first enable the vast dataset to teach the InceptionResNetV2 model generic features. Next, by adjusting the InceptionV3, the network becomes better at what it does and adjusts its knowledge to the unique traits of each bird species. The hybrid version performs better overall while reviewing records since it uses a multi-stage strategy to guarantee generalization and classification accuracy.
(4) Use of InceptionResNetV2 and InceptionV3 Architectures:
Using each InceptionResNetV2 and InceptionV3 enables a deeper know-how of the structures for photograph class duties. The hybrid version advantages from those two designs' complimentary traits with the aid of merging them [11].
While InceptionV3 is made to deal with an extensive variety of picture circumstances and postures, InceptionResNetV2 is famed for its ability to successfully extract complicated abilities and styles from photos). The hybrid version is capable of deal with difficult variances in hen snap pictures, which include occlusions, distinctive backdrops, and position discrepancies, via utilizing both structures to report precise observable capabilities.
The mixture of InceptionResNetV2 and InceptionV3 uses each different blessings to enhance the version's potential to differentiate among minute visual versions throughout fowl species. Combining those designs, produces a classification system this is extra dependable and correct, thereby resolving the difficulties concerned with classifying exclusive cook species.
(5) Consistent Terminology:
In order to ensure consistency and clarity, we can deal with deep learning architectures such as Convolutional Neural Networks (CNNs) in the examination [24]. CNNs are a type of deep network designed specifically for photo identification requirements. They are widely used in computer vision programs, one of which is the classification of hen species.
The combinatorial model structure can be more fully appreciated for its contributions to the effectiveness of bird species classifications by offering a clear justification for the multi-phase training methodology, elucidating the rationale behind the application of both the InceptionResNetV2 and InceptionV3 architectures, and employing commonly used terminology.
In order to extract features and reduce training parameter sizes, CNN's key components are the receptive field, shared weights, and time - based or space-based sub sampling. The advantage of a CNN algorithm is the fact that it automatically learns from training examples rather than manually extracting features [25]. The very same neuron weights reside just on top of the feature mapping, allowing the network to learn concurrently and reduce in complexity, adopting a sub sampling structure based on deformation displacement, size, and time resilience. Network topology and input data may go well together. It offers special benefits for picture processing. These actions are part of the Convolution Neural Network.
The main causes of those misclassifications include small training samples per class, high volatility, and class imbalance. Other factors include small bird ROIs, color similarities between bird body parts and backgrounds, and differences in lighting conditions between training and testing datasets. Deep neural networks cannot learn those discriminative characteristics under certain circumstances. Different lighting situations had the biggest impact on our model because of how many minute details of the bird, including color, texture, and gradients, are lost in low background light. Although it is made up for by the micro level properties of the bird, different bird positions also decreased the accuracy of our model. In the section that follows, potential solutions to those issues are further examined.
Let X represent an image with the dimensions (W, H, C), where W stands for width, H for height, and C for the number of channels, which is commonly three for RGB images.
To extract local features, perform a convolution operation on X using filters or kernels of size (Kw, Kh, C). The following can be used to compute the output feature maps:
Conv1 = Conv2D(X, filters = F1,
kernel size = (Kw, Kh),
activation = "relu," padding = "same"
where, 'relu' stands for the Rectified Linear Unit activation function, F1 refers to the number of filters.
Apply a pooling technique (such as max pooling or average pooling) to the feature maps to decrease their spatial dimensions and capture the most significant characteristics. The following can be used to compute the output feature maps:
Pool1=MaxPooling2D(Conv1,pool_size=(Pw,Ph),
strides=(Sw, Sh), padding='same').
where, the pooling window and stride sizes are Pw and Ph, respectively, and Sw and Sh.
To add more convolutional and pooling layers and to learn more complicated characteristics from the input image, repeat Steps above.
Flatten: To feed the fully connected layers, flatten the feature maps into a 1D vector.
Flatten(Pool1) = Flatten(1)
Fully Connected Layers: Add fully connected layers (also known as dense layers) to learn the global patterns and make final predictions. The output can be computed as follows:
Dense1=Dense(units=D1, activation='relu')(Flatten1)
where, D1 is the number of units in the dense layer.
Output Layer: For multi-class classification, add the output layer with softmax activation. The predicted class probabilities for each species of bird can be calculated as follows:
output = dense (units = number of classes, activation = softmax)(Dense1)
Loss Function: Create a suitable loss function (such as cross-entropy) to quantify the difference between the anticipated class probabilities and the actual labels.
Select an optimizer to update the model weights during training in order to reduce the loss function (e.g., Adam, SGD).
During training, backpropagation and gradient descent are used to train the CNN model on a labeled dataset of pictures of various bird species. To improve the performance of the model, adjust hyperparameters like learning rate, batch size, and number of epochs.
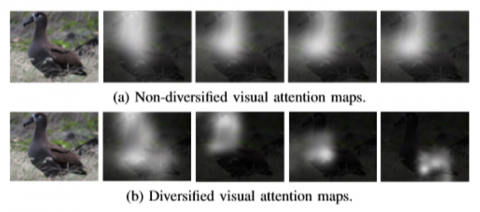
It has been shown that the visual attention model discussed above is capable of autonomously localizing discriminative areas for decreasing classification error in a comprehensive manner. However, we see that when the input picture is the identical at each time step, the attention maps created at many time phases may be surprisingly comparable. As a result, attention over time steps does not acquire more knowledge to complete classification tasks more effectively. Figure 3 displays the produced attention maps for a bird picture at various time steps to more clearly show this issue.
Figure 3. The generated attention maps by visual attention diversified model vs. diversified textual base attention on a bird image
8.1 Proposed model: Diversified attention model
8.1.1 Context and background
The Diversified Attention Model is a novel approach developed to address the limitations of the standard visual attention model in the field of image recognition and classification. The standard visual attention model aims to mimic human visual attention by selectively focusing on informative regions of an image, enhancing the model's ability to recognize important features However, the two most important drawbacks of traditional visual attention models are frequently their incapacity to address complicated and congested visuals and their loss of version in attending areas.
8.1.2 Motivation for the model
The motivation in the back of the Diversified Attention Model stems from the preference to conquer the shortcomings of trendy visible interest mechanisms. While traditional attention fashions can improve the version's overall performance by means of emphasizing applicable regions, they tend to consistently attend to the identical areas, leading to a loss of diversity within the attended regions. This hassle hinders the model's capability to capture numerous and elaborate visible patterns, especially in cluttered or exceedingly variable pix. Additionally, trendy attention mechanisms can also battle when coping with occlusions, historical past noise, or multiple gadgets in an image, as they fail to allocate interest effectively to the maximum informative areas.
8.1.3 Improvements over existing approaches
The Diversified Attention Model introduces a novel attention mechanism that addresses the constraints of preferred interest fashions. It leverages current advances in deep mastering and combinatorial optimization to dynamically select multiple various regions of interest in a photograph. By encouraging the version to take care of exceptional informative regions, the proposed version overcomes the dearth of diversity problem and captures an extra complete set of visual cues for accurate category.
Additionally, the various attention mechanism permits the model to successfully manage complex and cluttered images. Instead of focusing entirely on one or some regions, the model learns to take care of a couple of regions, allowing it to conform better to various image conditions, occlusions, and overlapping objects.
8.1.4 How the model works
The Diversified Attention Model employs a combination of deep neural networks and attention-based mechanisms. During the education process, the version learns to assign attention weights to special image areas. The goal is to maximize the variety of attended areas at the same time as minimizing the overlap and redundancy among them.
This is executed through combinatorial optimization strategies that encourage the version to select diverse sets of regions in a picture. By optimizing for range, the version effectively captures a much broader variety of visible patterns, leading to improved classification overall performance.
Additionally, the different interest mechanism enables the version to effectively deal with complicated and cluttered pics. Instead of focusing completely on one or some regions, the model learns to take care of a couple of areas, allowing it to adapt higher to diverse photograph conditions, occlusions, and overlapping objects.
8.1.5 Potential drawbacks and limitations
Although the Diversified Attention Model gives encouraging gains over well-known interest models, it has a personal set of capability flaws and guidelines. Due of the requirement for combinatorial optimization within the training path, one useful difficulty is the superior computational complexity. This may additionally moreover account for lengthier instructional studies and greater goals for treasured belongings. Furthermore, the numerous interest mechanisms might not be as effects understood as common interest developments. Knowing why a model focuses on specific regions in a picture is probably greater hard, which makes it tough to provide insights into the choice-making way. Modern regular hobby patterns, however, lower beauty mistakes in the eye region even as ignoring the records benefit underneath the eye. It's described as:
$L c=-\sum_{i=1}^c y_{t, i} \log \hat{y}_i$
where, Yi denotes whether or not the image is a member of class i. C is the total number of classes, and $\hat{y}_i$ is the likelihood that class I exists. Such a method is effective for categorizing items with notable differences. However, when the distinction between the two becomes rather subtle for the classification of fine-grained objects, it is important to gather enough data from several tiny locations in order to make an accurate classification choice, which calls for a diversified attention process. This study introduces a unique diversified focus strategy to capture different and discriminative regions in order to gather appropriate information for exact object classification.
The following diversity measure is advised to compute the relationship among spatially specific attention mapping and to diversify the attention regions.
$L_{d i v}=\frac{1}{T-1} \sum_{t=2}^T \sum_{i=2}^{K^2} l_{t-1, i} \cdot l_{t, i}$
where, after performing softmax on K2 locations at time step t, lt, i is the i-th attention value of the attention map. In general, if two nearby attention maps are comparable, Ldiv will receive a high value. However, our actual observations show that attention maps are not always sufficiently diverse when the correlation measurement is minimized.
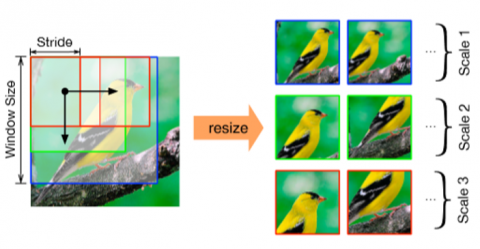
Figure 4 shows the derived attention canvases which are created using various window sizes and strides which requires the overlapped proportion of temporal neighbouring attention regions to be smaller than a threshold, so that the attention regions can be shifted to different locations in neighbouring time steps.
In order to further increase the diversity of attention, we force the visual attention models to look at diverse portions of the image in the subsequent time step. A "hard" limitation on the spatial support sites of the attention maps allows the attention areas to be relocated to other places in neighboring time steps. The overlapping fraction of the temporal nearby attention areas must be less than a threshold in order to satisfy this restriction.
Figure 4. An example of how attention canvases are created using various window sizes and strides
As follows is how the constraint is defined:
s.t. $\frac{\operatorname{Supp}\left[l_{t-1}\right] \cap \operatorname{Supp}\left[l_t\right]}{N}<\beta, \quad \forall t=2, \ldots, T$.
where, Supp[lt] is the localization reference for the focus region on the original image. N is the number of pixels in the original picture. It is a set threshold. The relevant loss function is created by combining the classification loss, the diversity measure, and the hard limit here on attention canvas:
$\begin{gathered}L=-\sum_{t=1}^T \sum_{i=1}^C y_{t, i} \log \hat{y}_{t, i}+\lambda L_{d i v} \\ \text { s.t. } \frac{\operatorname{Supp}\left[l_{t-1}\right] \cap \operatorname{Supp}\left[l_t\right]}{N}<\beta, \forall t=2, \ldots, T .\end{gathered}$
where, T is the total number of time steps, yt,Iis a one-hot labels vector of class probabilities at time step t, and is a coefficient to restrict the severity of the penalty if the class probabilities at two neighboring attention sites do not differ much.
8.2 Experimental setup
8.2.1 Dataset
In our experimental setup, we used the Indian Bird Species dataset, which comprises excessive-resolution photos of numerous bird species found in India. The dataset consists of sixteen exceptional bird classes, and every magnificence has a variable range of pics. The photos in the dataset range in length from 800×600 pixels to 4000×6000 pixels, capturing diverse visible attributes of the fowl species.
8.2.2 Model training process
We followed a multi-degree training procedure for our proposed Diversified Attention Model. In the primary degree, we pre-educated the version using the InceptionResNetV2 structure on a large dataset of categorized bird pix [17, 18]. The model became trained to learn popular features and representations from the large dataset.
In the second stage, we exceptional-tuned the pre-trained InceptionV3 model using the Indian Bird Species dataset. During this best-tuning technique, the model learned to awareness on precise visible attributes and discriminates among special hen species successfully. The diversified attention mechanism turned into carried out at some point of quality-tuning to inspire the model to take care of a couple of informative areas in each picture.
8.2.3 Evaluation metrics
To compare the overall performance of our proposed Diversified Attention Model, we employed general assessment metrics typically utilized in image classification duties. The number one assessment metrics covered accuracy, precision, remember, and F1 score. Accuracy measures the general correctness of the version's predictions, at the same time as precision and keep in mind determine the version's capacity to effectively perceive superb and negative samples, respectively. The F1 rating presents a balanced degree of the version's overall performance, considering both precision and recollect.
8.2.4 Primary models
In our experimental format, we hired two baseline models for assessment: a conventional visible hobby version and a traditional deep convolutional neural network (CNN). The traditional CNN served as a benchmark for evaluating the performance of our proposed Diversified Attention Model. The standard visual attention model implemented the traditional attention mechanism, where the model was trained to focus on a single region of interest in each image.
We used the same training dataset for all models to ensure fair comparisons. Each model underwent the same training process and was evaluated on the same testing dataset, comprising 158 images of the 16 bird species.
The neurons in the totally linked layer are fully connected to all activations in the layer below. This method is comparable to the CNN model in that the max pooling result is converted to a one-dimensional array that should be used as the input layer. In developing this suggested approach, we considered the following species:
When we run the program, the dataset is partitioned into testing and training sections. It first trains the system, then checks its correctness, and then requests user feedback. It returns the label as a consequence of an input image. The stages of execution are as follows: Table 1 shows the total number of bird species samples taken for this work which is named as sample 1 and Table 2 shows the tested results of this sample 1 with their accuracy percentage.
Table 1. Birds species samples for work
|
Sr. No. |
Birds Species |
Sample |
|
1 |
Bulbul |
150 |
|
2 |
Kingfisher |
125 |
|
3 |
Parrot |
120 |
|
4 |
Peacock |
140 |
|
5 |
Sparrow |
135 |
|
6 |
Pigeon |
130 |
Table 2. Accuracy analysis from sample 1
|
Sr. No. |
Birds Name |
Tested Result |
Accuracy (%) |
|
1 |
Bulbul |
150/150 |
100 |
|
2 |
Kingfisher |
120/125 |
96 |
|
3 |
Parrot |
120/120 |
100 |
|
4 |
peacock |
130/140 |
93 |
|
5 |
Sparrow |
121/135 |
90 |
|
6 |
Pigeon |
130/130 |
100 |
8.2.5 Birds Species prevalence, test sensitivity, and test specificity
This computation determines the chance of identification of the pre-test probability and test features (sensitivity, specificity, likelihood ratios). Confidence intervals are calculated based on sample sizes.
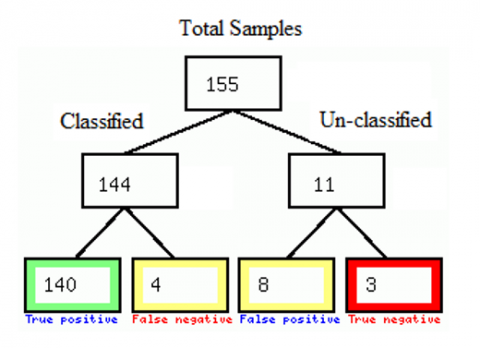
One might use a variety of criteria to assess the effectiveness of their classification model. We discussed confusion matrices in this paper, as well as how to manually and automatically calculate the four standard performance metrics accuracy, specificity, recall, and F1 score using four potential outcomes here: True Positive (TP), True Negative (TN), False Positive (FP), False Negative (FN) which is shown in Table 3.
Table 3. Samples taken for proposed work
|
Samples |
TP |
TN |
FP |
FN |
|
155 |
140 |
4 |
8 |
3 |
|
155 |
129 |
9 |
10 |
7 |
|
155 |
137 |
7 |
6 |
5 |
|
155 |
129 |
8 |
9 |
9 |
|
155 |
120 |
5 |
20 |
10 |
In Figure 5a) there are numbers of bird’s samples with and without the species present and absent that is positive and negative ratio in term of accuracy analysis. In Figure 5b) positive likelihood ratio, and negative likelihood ratio of Sample is calculated.
a) Tree illustration for sample
b) Positive likelihood ratio, and negative likelihood ratio of sample
Figure 5. Chosen bird sample set for experiment
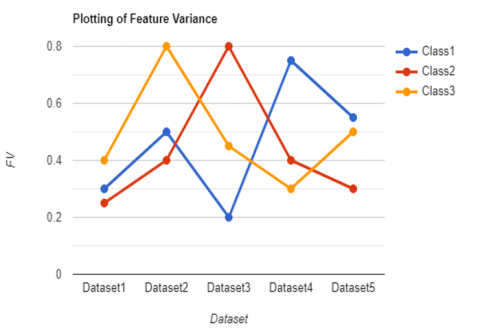
The nomogram in the Figure 6 will display the probability that a Bird has classified after a positive or negative test. Table 4 shows the predicated accuracy of tested datasets where the no of birds are derived in classes and their future variance plotting graph is shown in Figure 7. Table 5 shows the calculated values of the prevalence, sensitivity, specificity, +LR, -LR and F1 score on the experimental samples and their accuracy graph is plotted in the Figure 8.
The test's sensitivity and specificity are the numbers used to produce an LR, which is represented as 'LR+' and 'LR-' for both the positive and negative test findings. The following formulae are used in the calculations:
LR+ = sensitivity / 1- specificity
LR- = 1- sensitivity / specificity
Figure 6. Probability nomogram
Table 4. Dataset classification result
|
|
Class1 |
Class 2 |
Class 3 |
|
Set 1 |
0.3 |
0.25 |
0.4 |
|
Set 2 |
0.5 |
0.4 |
0.8 |
|
Set 3 |
0.2 |
0.8 |
0.45 |
|
Set 4 |
0.75 |
0.4 |
0.3 |
|
Set 5 |
0.55 |
0.3 |
0.5 |
Figure 7. Dataset classification
Table 5. Samples taken for proposed work
|
|
Prevalence |
Sensitivity |
Specificity |
+LR |
-LR |
F1-Score |
|
Sample 1 |
0.929 |
0.972 |
0.273 |
1.34 |
0.1 |
0.93 |
|
Sample 2 |
0.89 |
0.935 |
0.412 |
1.59 |
0.16 |
0.89 |
|
Sample 3 |
0.929 |
0.951 |
0.455 |
1.74 |
0.11 |
0.93 |
|
Sample 4 |
0.883 |
0.942 |
0.5 |
1.88 |
0.12 |
0.88 |
|
Sample 5 |
0.806 |
0.96 |
0.333 |
1.44 |
0.12 |
0.81 |
Figure 8. Accuracy graph for various samples
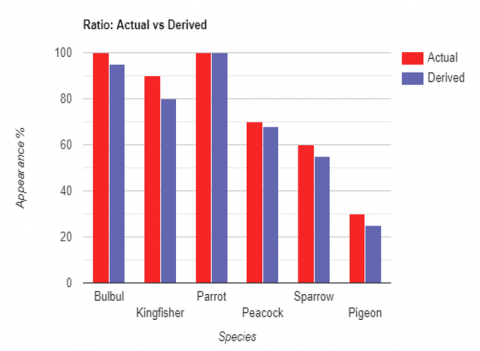
Table 6. Samples_2 result for accuracy
|
|
Actual |
Derived |
|
Bulbul |
100 |
95 |
|
Kingfisher |
90 |
80 |
|
Parrot |
100 |
100 |
|
Peacock |
70 |
68 |
|
Sparrow |
60 |
55 |
|
Pigeon |
30 |
25 |
Figure 9. Sample 2 result analysis for accuracy
When the code is executed, the dataset is divided into training and testing. After training the algorithm and testing its correctness. With the provided image, it returns the label as actual and derived as shown Table 6 and their variation graph is plotted which is shown in the Figure 9.
To compare the accuracy of the different models, it is intended to employ numerous models that were built with the identical training dataset and verified using it. Table 7 gives the comparison of different model with our DCNN model and it is clearly indicating that our model gives the better accuracy than others.
Table 7. Accuracy comparison with different models
|
Sr. No. |
Method |
# of Samples |
# of Species |
Result (%) |
|
1 |
DCNN |
155 |
16 |
ACC=92.30 |
|
2 |
CNN + Random Forest |
117 |
20 |
ACC=78 |
|
3 |
Softmax + ANN |
117 |
20 |
ACC=89.97 |
|
4 |
Random forest +SVM |
150 |
16 |
ACC = 66.58 |
|
5 |
CNN + Ensemble Model |
166 |
15 |
ACC=81 |
9.1 Improved classification performance
The proposed Diversified Attention Model demonstrated superior classification performance compared to both the traditional deep CNN and the standard visual attention model. The model's multi-stage training process, coupled with the diversified attention mechanism, enabled it to capture diverse and informative visual patterns, leading to higher accuracy and F1 scores.
9.2 Enhanced generalization
The Diversified Attention Model exhibited enhanced generalization capabilities, effectively handling complex and cluttered images with multiple objects or occlusions. By attending to multiple diverse regions, the model improved its ability to recognize fine-grained visual differences among bird species, contributing to more robust classification results.
9.3 Addressing limitations
The Diversified Attention Model addressed the restrictions of fashionable visible interest models, which includes the dearth of variety in attended areas and difficulty in dealing with complex pictures. By leveraging combinatorial optimization strategies, the version dynamically selected more than one informative region, promoting range and improving the model's ability to evolve to diverse photograph conditions.
9.4 Implications for future research
The success software of the Diversified Attention Model opens up several avenues for future studies within the field of picture recognition and deep gaining knowledge of:
9.4.1 Hybrid models for complicated tasks
The effectiveness of the hybrid method, combining InceptionResNetV2 and InceptionV3 architectures, suggests the capability for exploring other hybrid fashions for complicated duties. Future research ought to check out the mixing of various deep getting to know architectures to leverage their complementary strengths in diverse image popularity tasks.
9.4.2 Interpretability of diverse interest
As the Diversified Attention Model might also pose demanding situations in interpretability due to its consciousness on multiple areas, destiny studies ought to discover techniques to decorate the interpretability of diversified attention mechanisms. Explainable AI strategies can be included to provide insights into the model's decision-making system.
9.4.3 Attention mechanisms in different domain names
The varied attention mechanism confirmed promise in improving class performance. Future research should investigate the applicability of various interest mechanisms in different domains beyond hen species type, inclusive of item detection, scientific imaging, and natural language processing.
9.4.4 Scalability and efficiency
Future research should prioritize enhancing the scalability and overall performance of the multiple interest versions, especially when dealing with large datasets and real-time packages. Exploring optimization and model compression techniques could prove valuable in this regard. The Diversified Attention Model, which surpassed baseline models and addressed the limitations of traditional visual interest mechanisms, showcased its effectiveness in enhancing species identification in forest environments. The proof of concept and its implications for future research highlight the potential of various interest approaches to advance deep learning and image recognition tasks in diverse domains. The model enables advanced solutions in biodiversity research, environmental protection, and various photo-related industries. The level of accuracy we achieved varied between 90% to 93%. Based on its objective, we believe that the scope of this initiative is rather broad. This idea has potential in the field of wildlife research and can be employed to track and observe the behaviors and movements of different bird species in specific geographical areas.
[1] Alghamdi, A., Mehtab, T., Iqbal, R., Leeza, M., Islam, N., Hamdi, M., Shaikh, A. (2021). Automatic classification of monosyllabic and multisyllabic birds using PDHF. Electronics, 10(5): 624. https://doi.org/10.3390/electronics10050624
[2] Yang, C.L., Harjoseputro, Y., Hu, Y.C., Chen, Y.Y. (2022). An improved transfer-learning for image-based species classification of protected Indonesians birds. Computers, Materials & Continua, 73(3): 4577-4593.
[3] Gómez-Gómez, J., Vidaña-Vila, E., Sevillano, X. (2022). Western mediterranean wetlands bird species classification: evaluating small-footprint deep learning approaches on a new annotated dataset. arXiv preprint arXiv:2207.05393. https://arxiv.org/abs/2207.05393
[4] Gupta, G., Kshirsagar, M., Zhong, M., Gholami, S., Ferres, J.L. (2021). Comparing recurrent convolutional neural networks for large scale bird species classification. Scientific Reports, 11(1): 17085. https://doi.org/10.1038/s41598-021-96446-w
[5] Chandra, B., Raja, S.K.S., Gujjar, R.V., Varunkumar, J., Sudharsan, A. (2021). Automated bird species recognition system based on image processing and SVM classifier. Turkish Journal of Computer and Mathematics Education, 12(2): 351-356. https://doi.org/10.17762/turcomat.v12i2.813
[6] Rai, B.K., Sharma, S., Kumar, G., Kishor, K. (2022). Recognition of Different Bird Category Using Image Processing. International Journal of Online & Biomedical Engineering, 18(7).
[7] Triveni, G., Malleswari, G.N., Sree, K.N.S., Ramya, M. (2020). Bird species identification using deep fuzzy neural network. International Journal for Research in Applied Science and Engineering Technology (IJRASET), 8: 1214-1219.
[8] Li, N., Sun, Y., Chu, H., et al. (2019). Bird species diversity in Altai riparian landscapes: Wood cover plays a key role for avian abundance. Ecology and Evolution, 9(17): 9634-9643. https://doi.org/10.1002/ece3.5493
[9] Fleet, D., Pajdla, T., Schiele, B., Tuytelaars, T. (2014). Microsoft coco: Common objects in context. In Proceedings of the European Conference on Computer Vision, Zurich, Switzerland.
[10] Krizhevsky, A., Sutskever, I., Hinton, G. E. (2012). Imagenet classification with deep convolutional neural networks. Advances in Neural Information Processing Systems, 25.
[11] Szegedy, C., Ioffe, S., Vanhoucke, V., Alemi, A. (2016). Inception-ResNet and the impact of residual connections on learning. arXiv preprint arXiv:1602.07261.
[12] Szegedy, C., Vanhoucke, V., Ioffe, S., Shlens, J., Wojna, Z. (2016). Rethinking the inception architecture for computer vision. In Proceedings of the IEEE conference on computer vision and pattern recognition, pp. 2818-2826. https://doi.org/10.1109/CVPR.2016.308
[13] Das, S.D., Kumar, A. (2018). Bird species classification using transfer learning with multistage training. arXiv preprint arXiv:1810.04250. https://arxiv.org/abs/1810.04250
[14] Dyrmann, M., Karstoft, H., Midtiby, H. S. (2016). Plant species classification using deep convolutional neural network. Biosystems Engineering, 151: 72-80. https://doi.org/10.1016/j.biosystemseng.2016.08.024
[15] Ge, Z., McCool, C., Sanderson, C., Bewley, A., Chen, Z., Corke, P. (2015). Fine-grained bird species recognition via hierarchical subset learning. In 2015 IEEE International Conference on Image Processing (ICIP), Quebec City, QC, Canada, pp. 561-565. https://doi.org/10.1109/ICIP.2015.7350861
[16] Xu, X., Yang, C.C., Xiao, Y., Kong, J.L. (2023). A fine-grained recognition neural network with high-order feature maps via graph-based embedding for natural bird diversity conservation. International Journal of Environmental Research and Public Health, 20(6): 4924. https://doi.org/10.3390/ijerph20064924
[17] Russakovsky, O., Deng, J., Su, H., Krause, J., Satheesh, S., Ma, S., Huang, Z., Karpathy, A., Khosla, A., Bernstein, M. and Berg, A.C., 2015. Imagenet large scale visual recognition challenge. International Journal of Computer Vision, 115: 211-252.https://doi.org/10.1007/s11263-015-0816-y
[18] Kumar, A., Das, S.D. (2019). Bird species classification using transfer learning with multistage training. In Computer Vision Applications: Third Workshop, WCVA 2018, Held in Conjunction with ICVGIP 2018, Hyderabad, India, pp. 28-38. https://doi.org/10.1007/978-981-15-1387-9_3
[19] Martinsson, J. (2017). Bird species identification using convolutional neural networks. Master’s thesis. https://schlieplab.org/Static/Publications/2017-JohnMartinsson-BirdSongs.pdf.
[20] Kim, P. (2017). Convolutional Neural Network. In: MATLAB Deep Learning. Apress, Berkeley, CA. https://doi.org/10.1007/978-1-4842-2845-6_6
[21] Gavali, P., Banu, J.S. (2020). Bird species identification using deep learning on GPU platform. In 2020 International Conference on Emerging Trends in Information Technology and Engineering (ic-ETITE), Vellore, India, pp. 1-6. http://doi.org/10.1109/ic-ETITE47903.2020.85
[22] Noumida, A., Rajan, R. (2021). Deep learning-based automatic bird species identification from isolated recordings. In 2021 8th International Conference on Smart Computing and Communications (ICSCC), Kochi, Kerala, India, pp. 252-256. https://doi.org/10.1109/ICSCC51209.2021.9528234
[23] Chakraborti, T., McCane, B., Mills, S., Pal, U. (2020). CoCoNet: A collaborative convolutional network applied to fine-grained bird species classification. In 2020 35th International Conference on Image and Vision Computing New Zealand (IVCNZ), pp. 1-6.
[24] Liu, J., Zhang, Y., Lv, D., Lu, J., Xie, S., Zi, J., Yin, Y., Xu, H. (2022). Birdsong classification based on ensemble multi-scale convolutional neural network. Scientific Reports, 12(1): 8636. https://doi.org/10.1038/s41598-022-12121-8
[25] Anusha, P., ManiSai, K. (2022). Bird species classification using deep learning. In 2022 International Conference on Intelligent Controller and Computing for Smart Power (ICICCSP), Hyderabad, India, pp. 1-5. https://doi.org/10.1109/ICICCSP53532.2022.9862344