Gökhan Uçar![]() | Emre Dandıl*
| Emre Dandıl*![]()
© 2024 The authors. This article is published by IIETA and is licensed under the CC BY 4.0 license (http://creativecommons.org/licenses/by/4.0/).
OPEN ACCESS
The segmentation of white matter abnormalities is crucial for the early diagnosis of cerebral diseases, which aids in minimizing the resultant physical and cognitive deficits. Automated segmentation methods are instrumental for the precise and early identification of white matter hyperintensities (WMH) from magnetic resonance (MR) images. In this investigation, datasets comprising ischemic stroke and WMH cases, imaged with the FLAIR (fluid-attenuated inversion recovery) MR sequence, were utilized due to their enhanced visibility of hyperintensities. For segmentation, the Mask R-CNN model, a sophisticated deep learning architecture, was finely adjusted to bolster its performance. Concurrently, the U-Net model, renowned for its efficacy in medical image segmentation, was employed. A comprehensive comparison of the two models' performance was conducted. Results demonstrate that the Mask R-CNN model achieved dice similarity coefficient (DSC) scores of 0.93 for the stroke dataset and 0.83 for the WMH dataset. The U-Net model yielded DSC scores of 0.92 and 0.82 for the respective datasets. These findings indicate an improvement over preceding studies in WMH segmentation accuracy utilizing the Mask R-CNN approach. It is concluded that automated WMH segmentation on MR images serves as a robust decision-support tool for clinicians during preliminary evaluations, although it should be noted that definitive disease detection necessitates the corroboration of clinical findings.
white matter hyperintensities (WMH), computer-aided detection, hyper-parameter optimization, deep learning, Mask R-CNN, U-Net, automatic segmentation
While numerous diseases impact human health, those affecting the brain—our central command and controller of the nervous system—are notably challenging to detect, diagnose, and treat. Research estimates that approximately one-third of the global population may experience neurological and mental disorders at some point in their lives, with hundreds of specialized diagnostic criteria developed to navigate their complex nature [1-3]. The identification of neurodegenerative diseases, particularly in early stages, remains a daunting task [4].
The brain, the central nervous system's pivotal structure, is integral to bodily function. Consequently, brain pathologies can have widespread effects on the body or individual organs. A comprehensive study by the World Health Organization (WHO) in 2019, leveraging data from various sources including United Nations member countries, WHO-associated institutions, the Global Burden of Disease scientific study, and other scholarly works, offered insights into global mortality causes. Cardiovascular diseases (CVDs) emerged as the leading cause of death, with strokes being the second most common cause, accounting for 11% of all deaths and approximately six million fatalities annually. Alzheimer’s disease and other dementias ranked as the seventh leading cause of death, responsible for around 1.6 million deaths, or 3% of the total, with the mortality rate from these conditions in women tripling over the past two decades. In the same WHO report, stroke was identified as the third leading cause of mental and physical disability [5].
A Europe-centric study highlighted that such illnesses represent 35% of Europe's total disease cost burden, amounting to an annual expenditure of €800 billion; 60% of this cost is attributed to healthcare and non-medical expenses [6]. Therefore, the early diagnosis and appropriate treatment of brain-related diseases are paramount [7]. While computed tomography (CT) scans were historically prevalent in diagnosing neurodegenerative diseases, magnetic resonance imaging (MRI) has now taken precedence as the most widely utilized initial examination technique. The preference for MRI stems from its capacity for three-dimensional imaging and its ability to more readily discern contrast differences in the brain's soft tissues, without the associated risks of X-rays found in CT scans [8].
Technological advancements have facilitated the detection of early-stage tumors and other neurodegenerative conditions through MR scanners, leading to higher-quality images and reduced acquisition times. MR images can be captured in various sequences, with T1-weighted (T1-w) and T2-weighted (T2-w) sequences being the most prevalent. T1-w sequences are primarily employed in anatomical assessments, while T2-w sequences assist in evaluating signal intensity variations critical for identifying pathological states [9, 10]. Pathologies in MR scans are often evidenced by alterations in white matter hyperintensities (WMH) or white matter disease—areas indicative of abnormal development within the regions housing axonal extensions of nerve cells [11].
Abnormal developments in brain white matter (WM) manifest as hypointense on T1-weighted (T1-w) images and hyperintense on T2-weighted (T2-w) images. While T2-w sequences are typically employed to detect pathological changes, T1-w sequences are also useful in revealing the anatomical structures of such changes [12]. On T2-w images, brain fats and fluids may appear hyperintense, similar to lesions, posing a challenge in distinguishing between the two. Therefore, T2 Fluid Attenuated Inversion Recovery (FLAIR) scans are often preferred, as they allow for more accurate detection of hyperintense developments by significantly suppressing fluid signals, thus enabling clearer identification of pathologies.
White matter hyperintensities (WMHs) can be indicative of severe health issues, such as Parkinson’s disease, Alzheimer's disease, multiple sclerosis (MS), vasculitis, dementia, migraine, and stroke [13-18]. However, not all WMHs are harbingers of disease; they can also arise from benign processes like aging or lifestyle factors such as smoking, high blood pressure, high cholesterol, and diabetes [19-24]. Hyperintense lesions can even be observed in individuals considered healthy, as evidenced by MRIs obtained for unrelated medical evaluations. Consequently, it is crucial to promptly discern the characteristics—such as location, number, and size—of these hyperintense developments. Such differentiation is essential for the early diagnosis of serious conditions, to avoid misdiagnosis and unnecessary treatment, and to reduce uncertainty in clinical settings.
Diagnosing diseases based on hyperintense lesions can vary in complexity among individuals, with some cases being straightforward and others difficult to interpret [25, 26]. The fact that there are over 50 disease categories associated with hyperintense lesions further complicates the diagnostic process for physicians [27]. Moreover, constraints such as the voluminous nature of MR series, the high daily workload of radiologists, limited time, lack of around-the-clock availability, and reduced access to radiologists in remote areas compound these challenges. Radiologists under such pressure may not scrutinize images with the necessary detail, sometimes leading to error rates as high as 30% due to factors like fatigue and decreased concentration [28].
To alleviate these issues, the development of computer-aided automatic decision-support systems is imperative. Such systems can lessen the burden on physicians and bolster their diagnostic accuracy. However, detection of hyperintense developments is not definitive for disease diagnosis. Clinical evaluations by physicians and patient symptoms are equally critical. Hence, efforts to identify hyperintense lesions should be viewed as a supportive tool, augmenting the diagnostic acumen of medical professionals. Timely and accurate assessment of these lesions can streamline the diagnostic and therapeutic process, thereby enhancing the likelihood of successful treatment outcomes. For example, research on Alzheimer's disease, a type of dementia, has revealed an increase in WMH burden that can precede clinical diagnosis by approximately 6-10 years [14, 29]. Similarly, dementia, characterized by elevated WMHs, and stroke, a major cause of mortality and lasting brain damage, show a significant correlation with increased WMHs [30]. The prevalence of dementia, amplified by modern living conditions, is projected to rise to 65.7 million by 2030 and 115.4 million by 2050 [31, 32].
Previous research has established the feasibility of employing deep learning techniques for the detection and segmentation of WMHs. Despite these advancements, current methodologies exhibit certain limitations, such as suboptimal segmentation performance on smaller WMH lesions, an absence of hyperparameter optimization, particularly in Mask R-CNN models, and a dearth of comprehensive comparative studies across various datasets. Furthermore, prior segmentation performance levels have not sufficiently streamlined the workload for physicians and experts. Additionally, most existing applications of Mask R-CNN have been tested on datasets comprising predominantly large lesions, like tumors, while datasets with smaller-sized pathologies, such as WMH, strokes, and multiple sclerosis (MS), have not been as extensively researched.
Our study posits that deep learning networks can be adeptly employed to enhance segmentation performance for minuscule lesions, as small as 1-2 pixels. This application aims to support decision-making processes, thereby reducing the potential for preliminary diagnostic errors by radiologists and contributing to the alleviation of rising public health costs.
In our research, the Mask R-CNN deep learning model, renowned for its segmentation prowess, has been adapted to improve the automated segmentation performance of WMH. We also conduct a comparative performance analysis with the U-Net model, which is extensively utilized in medical image segmentation and is noted for its effective results.
The contributions of this study are manifold:
This research not only furthers the development of deep learning networks and high-performance decision support systems but also presents promising findings for the medical imaging field.
Hyperintense developments in the brain have been recognized as precursors and biomarkers for various diseases, prompting a multitude of studies aimed at their detection, delineation, and classification. Initially, these studies often relied on manual or semi-automatic segmentation by experts. However, with the advancement of computer technologies and the increased capabilities of hardware, automatic segmentation methods have largely supplanted manual and semi-automatic approaches. The advent of high-performance CPUs and GPUs has significantly expedited this transition.
In their comprehensive study, Admiraal-Behloul et al. [33] conducted experiments on an extensive elderly population, providing fully automated segmentation of datasets comprising proton density-weighted (PD), T2-w, and FLAIR MR images using a fuzzy inference artificial intelligence technique. They categorized WMH lesions into three sizes—small, medium, and large—and assigned voxels into three fuzzy classes: bright, medium bright, and dark. The lesion segmentation performance, evaluated using the Dice Similarity Coefficient (DSC), yielded 0.70 for small lesions, 0.75 for medium-sized lesions, 0.82 for large lesions, with an average of 0.75. A notable limitation identified was the time-consuming nature of the decision process for images input into the system.
Machine learning methods have been predominantly utilized in recent studies for the fully automatic detection and segmentation of WMH, with various approaches compared for their effectiveness. Anbeek et al. [34] presented a method involving the k-nearest neighbors (k-NN) classification technique on T1-w and FLAIR MR images. Their approach differentiated between periventricular white matter hyperintensities and deep WMH using manual segmentation, with lesions classified by size. The k-NN-based method, coupled with pre-processing, achieved a DSC average of 0.80, with 0.50 for small lesions, 0.75 for medium lesions, and 0.85 for large lesions. However, the segmentation performance was found to be dependent on the chosen threshold value for the dataset.
Lao et al. [35] improved upon Anbeek’s method [34] by developing a classification model using a support vector machine (SVM), with a focus on feature vector selection. Yet, this did not overcome the limitations associated with manual classification and thresholding. Dyrby et al. [36] employed an artificial neural network technique to segment age-related changes in the white matter region of MR images from 362 non-dementia patients across 11 centers. The DSC mean values for lesion segmentation performance were 0.45 for small lesions, 0.62 for medium, and 0.65 for large lesions, with the approach limited in terms of performance and training duration.
Kawata et al. [37] aimed to elucidate the correlation between the severity of subcortical vascular dementia and the area ratio of WMH. They found DSC average performance values of 0.72 using a threshold leveling technique, 0.76 with region growing, and 0.78 with an automatic selection method. Klöppel et al. [38] compared machine learning methods like k-NN and SVM for the automatic detection of WMH in a dataset created with T1-w and FLAIR images, also applying threshold-based approaches for gray matter delineation.
Leite et al. [39] explored texture-based classifiers for WMH classification using MR images, concluding that the SVM classifier successfully distinguished normal white matter from WMH. Griffanti et al. [40] detected hyperintense occurrences in two datasets totaling 583 MR images in T1-w and FLAIR sequences. They differentiated two classes—WMH and non-WMH—using a k-NN-based fully automatic algorithm with binary masks. Dadar et al. [41] compared ten different classification techniques for identifying WMH using diverse datasets containing MR images of patients with small vessel disease and Alzheimer’s disease. They found that while Naive Bayes yielded the lowest classification performance, k-NN and random forest (RF) algorithms achieved the best results.
Lastly, Park et al. [42] proposed a framework named DEWS for the segmentation of WMH and deep WMH, which are observed to increase rapidly in migraine patients. Their pipeline involved three stages: extraction of WMH from MR images, detection, and false positive reduction. Jiang et al. [43] used a cluster-based method called the unidentified bright objects detector for fully automatic extraction of WMH regions and sizing. They then utilized the k-NN algorithm to confirm whether the extracted clusters were WMH.
The rapid advancement of deep learning networks has significantly enhanced the use and efficacy of automatic segmentation methods. Guerrero et al. [44] introduced a convolutional neural network (CNN) for the detection of WMHs and stroke lesions, finding that the DeepMedic method surpassed both the lesion prediction and lesion growth algorithms in terms of performance. In a different study, Diniz et al. [28] combined CNNs with SLIC0 clustering methods for WMH detection and proposed a four-step process utilizing magnetic resonance (MR) images: image acquisition, pre-processing, segmentation, and classification. Li et al. [45] employed a deep fully convolutional network (Deep-FCN) to automatically segment the WMH Segmentation Challenge dataset, which included WMHs and FLAIR MR images. Their Deep-FCN model achieved top-ranking results in the WMH Segmentation Challenge.
Further contributions to this field include Maier et al. [46], who developed an approach for segmenting ischemic stroke lesions, a prevalent cerebrovascular condition. They evaluated various methods from 16 research groups on the Ischemic Stroke Lesion Segmentation (ISLES) 2015 dataset—comprising MR images in different sequences—at the MICCAI 2015 conference.
Studies have also explored Alzheimer’s disease detection as a means to diagnose WMH progression. Rachmadi et al. [47] utilized the Alzheimer's Disease Neuroimaging Initiative (ADNI) dataset, which includes FLAIR and T1-w MR images, to identify WMH developments commonly encountered in routine MR imaging, with or without a mild vascular origin. Hong et al. [48] implemented a segmentation method for WMH in migraine patients, focusing on T2-w and FLAIR MR scans of 148 non-elderly individuals to exclude age-related WMH effects. However, according to the dice similarity coefficient (DSC), the segmentation performance was relatively low at 0.56.
In an innovative approach, Oh et al. [49] introduced a generative adversarial network (GAN) model for WMH segmentation. This model, alongside the H-Dense U-Net, was used to segment positron emission tomography (PET)/CT scans of 50 patients. The DSC metric revealed a score of 0.75 for WMH lesions larger than 60 mL, but the values decreased significantly for smaller lesions. This indicated that PET/CT imaging for WMH segmentation may not yield optimal results. Liang et al. [50] highlighted the success of deep learning-based methods in WMH segmentation but noted a scarcity of research on the decision-making and lesion localization processes. To address this, they presented an anatomical-based U-Net method that incorporates anatomical information to aid the decision-making process by identifying the anatomical locations of lesions post-segmentation.
Umapathy et al. [51] proposed StackGen-Net, building upon the DeepUNET3D structure and utilizing 3D FLAIR images reformatted into 2.5D patches. They concluded that the method's performance was competitive when compared to other high-performing WMH segmentation techniques. Chen et al. [52] explored WMH detection using a U-Net with multimodal MRI across various public datasets and introduced a CNN baseline posterior conditional random fields architecture to extract complex input features beyond the encoder-decoder capabilities of U-Net. Their method achieved DSC scores of 0.61 and 0.79 on the ISLES 2015 SISS stroke dataset and the MICCAI 2017 WMH dataset, respectively.
Liu et al. [53] developed a CNN-based deep learning architecture for WMH detection on FLAIR and diffusion-weighted imaging (DWI) MR images in a cohort of 208 patients with acute ischemic stroke. They recorded the highest DSC score of 0.61 using three distinct U-Net models and suggested that their method could effectively assess WMH burden in stroke patients. Lastly, Mohammed et al. [54] combined deep learning and machine learning approaches for WMH detection and disease classification related to Dementia and Alzheimer's. They utilized AlexNet and ResNet50 for deep learning, followed by a SVM for the decision phase. While their method proved successful for diagnosis, segmentation performance was not the focus of their study.
In a recent inquiry, Bangyal et al. [55] employed a convolutional neural network (CNN) for the diagnosis of Alzheimer's disease and contrasted its efficacy with that of machine learning-based approaches. However, the segmentation capabilities of the method were not the focus of their investigation.
This section provides an overview of the methods proposed for the detection and segmentation of white matter hyperintensities (WMH). Initially, the application of deep learning techniques in WMH analysis was quite rudimentary. Predominantly traditional methods such as support vector machines (SVM), k-nearest neighbors (k-NN), random forests, naive Bayes, Statistical Parametric Mapping (SPM), decision trees, logistic regression, linear discriminant analysis (LDA), quadratic discriminant analysis (QDA), local and global thresholding, and morphological operations were employed in studies predating 2015. The proliferation of deep learning methods, particularly CNNs, for WMH segmentation and detection is attributable to advancements in computer technology.
A recurrent challenge identified in earlier studies is the need for highly accurate WMH lesion detection. To address this, the current study seeks to enhance WMH segmentation by utilizing deep learning techniques such as U-Net and Mask R-CNN. Leveraging transfer learning with pre-trained network architectures, our study mitigates the typically lengthy training durations. Through meticulous fine-tuning, we have optimized hyperparameters, notably 'Regions of Interest Per Image' (RoIs Per Image) and 'Region Proposal Network Anchor Per Image' (RPN_Anchor_Per_Image), which has expedited the network's training process. Furthermore, the training is stratified into two stages to bolster the detection of small-pixel lesions. The first stage achieves a broad learning scope, while the second stage refines the search areas to enhance the detection performance of smaller lesions.
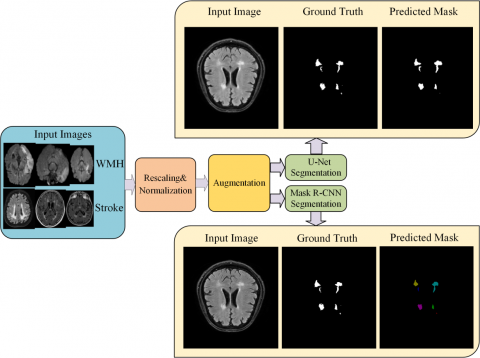
Figure 1. The overview of the proposed deep learning framework in this study for WMH segmentation
Since there are many diseases that cause hyperintense lesions, the classification of detected WMH regions is a very comprehensive study. In order to classify all diseases with a single dataset in WMH, a very large dataset, a computer with powerful hardware components such as GPU, and a deep learning model suitable for high-accuracy detection are needed. The overview of the proposed framework for WMH segmentation is shown in Figure 1. As can be seen from the framework, two different datasets were used for WMH detection and segmentation: the WMH Segmentation Challenge dataset and the ISLES 2015 dataset, which consists of MR images of ischemic stroke patients, which is a common brain disease that causes WMH. In this study, segmentation was achieved by labeling the slices in both datasets as WMH. In the first stage of the framework, images were obtained and rescaled at a certain size (256x256) as image preprocessing techniques. At this stage, the images were subjected to normalization and the pixel values were limited to a certain value range. After pre-processing and data augmentation procedures on the datasets, Mask R-CNN and U-Net deep learning networks were used for WMH segmentation using ground truth masks delineated by experts.
In the experimental studies, a computer with a GPU component was used as the hardware. The results obtained in the study were compared with the performances of deep learning networks in WMH segmentation. In the study, Mask R-CNN and U-Net were used as a technique for the automatic segmentation of WMH lesions. The most important feature of the Mask R-CNN network is that it does not evaluate the image as a whole, but makes object detection with convolutional operations after dividing it into sub-regions. Mask R-CNN also provides the classification of objects in the last layer and determines their boundaries independently from each other. On the other hand, U-Net performs the segmentation process using convolution operations with a two-stage model, encoder and decoder, based on typical CNN architectures.
3.1 Datasets
In studies with images containing WMH, obtaining and preparing datasets that accurately describe the lesion and give the correct class label about the lesion is a long process. In addition, the dataset should be large enough for generalization and should include all the WMH-related situations as much as possible. It is known that MRI is used commonly since it contains more data for lesion detection in soft tissues. In addition, since images in MRI can be obtained in different sequences such as T1-w, T2-w, FLAIR, and DWI, hyperintense development can be more clearly seen in some of these sequences. Hyperintense developments can be observed more clearly, especially in T2-w and FLAIR images [56]. In order to detect hyperintense lesions more easily, hyperintense images obtained from the fluid spaces of the brain, which are outside the brain tissue in MR images, make it difficult to detect the lesion. In this way, possible false detections are prevented by suppressing the liquid. Images labeled by experts were used to show the accuracy and validity of the training and test results conducted using the selected datasets. In this study, WMH Segmentation Challenge and ISLES 2015 Ischemic Stroke datasets were used for WMH detection and segmentation. The fact that both of these datasets are multi-center datasets and using MR images from MR imaging devices with different characteristics increases the generalization ability of the proposed method.
There are some of the difficulties on the protection of aging-related degenerative and vascular pathologies, which is important for generalizability in personal data. The collecting data has difficulties such as various degrees, types of the disease, the inconvenience of labeling of the data and the limited availability of publicly-available datasets. The most important reasons for preferring the datasets used in this study are that they are labeled with the consensus of 2 different experts, that they enable to minimize the expert labeling errors that can reach 30%, they were obtained with MR devices with different features in different health centers, and that they are open access. In addition, having the opportunity to compare with studies made with many different methods within the scope of challenges is an important factor that enables the selection of datasets.
ISLES 2015 Challenge dataset was used in the Ischemic Stroke Lesion Segmentation (ISLES) 2015 Challenge event held within the scope of MICCAI 2015 to improve the detection of ischemic stroke disease and enable new approaches [46, 57]. This dataset consists of two separate sub-datasets. The first one is the sub-acute ischemic stroke lesion segmentation (SISS) dataset, which was created for the automatic detection and volume segmentation of sub-acute ischemic stroke lesions from multispectral MR imaging sequences acquired in the sub-acute stroke development stage. The second one is the dataset consisting of penumbra images resulting from an acute ischemic stroke from multispectral MR imaging sequences.
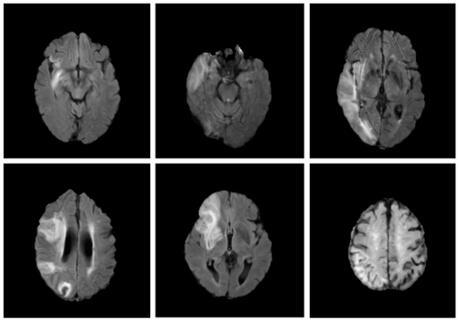
The situation where the electrical function has stopped, but permanent tissue damage has not yet occurred and the treatment is important is called ischemic penumbra [58]. In accordance with our study, the SISS dataset, which is based on the detection of hyperintense images and in which all teams achieved lower performance as a result of the ISLES 2015 Challenge, was used with FLAIR images. All MR sequences in the dataset were created in Neuroimaging Informatics Technology Initiative (NIfTI) file format. The ground truth was delineated by experienced experts on the FLAIR MR sequence and was saved in the same way in NIfTI format. In this study, only sub-acute ischemic stroke lesions data were used for WMH segmentation. In this study, only sub-acute ischemic stroke lesions were segmented for WMH segmentation. Dimensions of the images in the SISS dataset are 240 (width) × 240 (height) × 155(slice) × 4 (multimode). A total of 1030 images of 28 patients in the SISS dataset of the ISLES 2015 were used for experimental studies for WMH segmentation. Of these images, 802 (78%) were used for training, 168 (16%) were used for validation and 60 (6%) were used for testing. Sample images from the ISLES 2015 dataset with lesions are given in Figure 2.
Figure 2. Some sample images from the ISLES 2015 ischemic stroke dataset with lesion
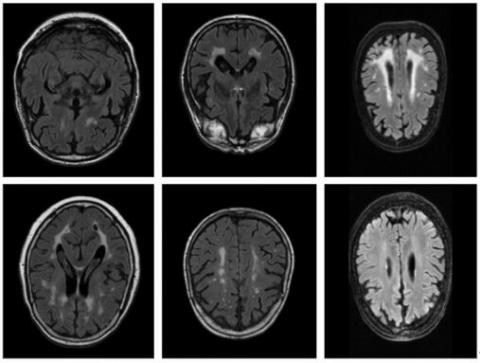
Figure 3. Sample images from the WMH segmentation challenge dataset
In 2017, the WMH Segmentation Challenge event was held within the scope of MICCAI 2017 in order to compare the performances of existing methods for the automatic segmentation of WMH of presumed vascular origin and to reveal new segmentation approaches. WMH Segmentation Challenge dataset was created for the event and made available to the participants [59, 60].
In the dataset, there are images obtained from 3 different hospitals and 5 different MR scanners. In the dataset, 3D T1-w and 2D FLAIR image sequences were acquired for each patient. Ground truth masks were created on FLAIR images through manual marking by the expert.
In this study, a total of 60 MR sequences from the WMH Challenge dataset were used in experimental studies. From a total of 735 images, 572 (78%) were used for training, 119 (6%) were used for validation and 44 (6%) were used for testing. Sample images from the WMH Segmentation Challenge dataset are given in Figure 3.
Summary information about the WMH Segmentation Challenge and ISLES 2015 Ischemic Stroke datasets used for WMH segmentation in this study is given in Table 1.
Table 1. Summary of the WMH segmentation challenge and ISLES 2015 ischemic stroke datasets
|
|
WMH Segmentation Challenge |
ISLES 2015 Ischemic Stroke (For SISS Dataset) |
|
Challenge |
MICCAI 2017 |
ISLES 2015 (MICCAI 2015) |
|
WMH type |
WMH |
Stroke |
|
MR Sequences |
3D T1-w and 2D FLAIR |
FLAIR, T2 TSE (Turbo Spin Echo), T1 TFE (Fast Spin Echo) /TSE, DWI |
|
Number of cases/images |
60 (training), 110 (test) images |
28 (training), 36 (test) cases |
|
Number of centers |
3 |
2 |
|
Number of scanners |
5 (1.5 T and 3 T) |
2 (3 T) |
|
Number of experts |
2 |
2 |
|
Number of images (slices) |
735 (training = 572, validation = 119, test = 44) |
1030 (training = 802, validation = 168, test = 60) |
3.2 Image pre-processing
Correct detection of lesions or lesion-like developments in WMH is of great importance for early diagnosis and determination of appropriate treatment methods. It is very important to get successful results that the labeling process is done correctly in the dataset. For this reason, labels have to be performed by one or more experienced experts. In this study, there are ground truth masks delineated by experts in both datasets. This validation data was generated by masking selected areas on the MR images. In both of the datasets, each of the MR image sequences is saved as a single file in NIfTI format. In the ISLES 2015 dataset, two classes such as background and stroke lesions were delineated by experts. In the WMH dataset, three classes were labeled such as background, WMH, and other pathology by experts. Since the main purpose here is WMH segmentation, other pathologies were roughly marked to mask [59]. Based on this, images labeled as “other pathology” reduce segmentation accuracy in experimental studies, both the marking is made roughly and the object labeled with other pathology is very few. For this reason, experimental studies were organized by considering only WMH labeling in the study.
In order to segment WMH by the Mask R-CNN and U-Net techniques, the masking data needs to be converted to a coordinate system. The coordinates of each WMH region in the masking images were extracted separately using edge detection algorithms. The coordinate data along with the image and lesion, the class name of the objects, and the area covered by the objects were saved in a special format (coco, xml, json, via_json) and the labeling process was completed. Sample images from the WMH Segmentation Challenge and ISLES 2015 datasets and the ground truth masks labeled by the expert are given in Figure 4. Figure 4 (b) and Figure 4 (f) show the ground truth masks of the images in Figure 4(a) and Figure 4(e) in the WMH Segmentation Challenge dataset, respectively. Likewise, Figure 4(d) and Figure 4(h) are presented for the ground truth masks of the images in Figure 4(c) and Figure 4(g), respectively, in the ISLES 2015 dataset.
Figure 4. Sample images from the WMH segmentation challenge (a and e) and ISLES 2015 (c and g) datasets and the ground truth masks (b, d, f and h)
The scans in both publicly-available datasets used in this study include MR slices from different MR scanners. Since the scanners are different, the distribution scale of the intensity values of the images formatted as NIfTI is also different (for example, between 0 and 2220). For this reason, the linear normalization denoted in Eq. (1). was used to set all the images used in this study to a certain intensity range. Thus, the pixel values of all images were normalized to the gray-level values in the 0-255 range. Here, X represents the value of a pixel in the image, Xmax denotes the pixel with the maximum intensity value in the image, Xmin indicates the value of the pixel with the minimum intensity value in the image, and Xnormalized shows the normalized pixel value.
$\mathrm{X}_{\text {normalized }}=\frac{\mathrm{X}-\mathrm{X}_{\min }}{\mathrm{X}_{\max }-\mathrm{X}_{\min }} * 255$ (1)
3.3 Data augmentation
In studies with deep learning algorithms, it is known that the large data set used for training and the high inclusiveness of the object types to be detected enable the network to show higher performance. Although the network learns when the number of images in the dataset is low, a situation called overfitting may occur. To get rid of this situation, the network needs to be trained with a lot of data. The minimum number of data required for high performance varies according to the difficulty level of the problem. For some simple problems, a data set of 400-500 images may be sufficient, while for more difficult problems, 10 times this data or much more may be required. In order to perform learning process for CNN the matrix containing the pixel properties of the input image is multiplied by another matrix called the convolution kernel. As a result of these multiplication operations, features of the image are extracted. As the number of images for the training of the network increases, the learned feature also increases, which increases the probability of the images to be recognized by the network. Since ISLES 2015 Stroke and WMH Segmentation Challenge datasets alone are not sufficient for performance, data augmentation for both is required. For this reason, data augmentation is necessary in order to get rid of the overfitting problem of the model obtained as a result of the training and to achieve high performance of the network. In our study, the library named “imgaug” was used for data augmentation [61]. In this study, rotation (rotate, flip left to right, flip up to down), contrast adjusting (linear contrast, gamma contrast), sharpening (Filtersharpen), smoothing (MedianBlur) processes were applied on the images for data augmentation, as seen in Table 2. The most appropriate one of the 17 data augmentation processes seen in Table 2 was applied for each image. Some of the applied data augmentation processes are given in Figure 5.
Table 2. The data augmentation functions and their parameters applied for images
|
|
Rotation |
Contrast Adjusting |
Smoothing |
Sharpening |
|||
|
Augmentation Number |
Flipud (Up to Down) |
Fliplr (Left to Right) |
Rotate (90, 180, 270) |
Linear Contrast (alpha=0.4, 1.6) |
Gamma Contrast (gamma=0.5, 2.0) |
Median Blur |
Filter Sharpen |
|
1 |
1.00 |
- |
- |
0.95 |
- |
- |
- |
|
2 |
- |
1.00 |
- |
1.30 |
- |
- |
- |
|
3 |
- |
- |
90.00 |
1.20 |
- |
- |
- |
|
4 |
- |
- |
180.00 |
1.05 |
- |
- |
- |
|
5 |
- |
- |
270.00 |
1.45 |
- |
- |
- |
|
6 |
- |
1.00 |
- |
1.25 |
- |
- |
- |
|
7 |
1.00 |
- |
- |
1.15 |
- |
- |
- |
|
8 |
- |
- |
- |
1.35 |
- |
- |
- |
|
9 |
- |
- |
270.00 |
1.35 |
- |
- |
- |
|
10 |
1.00 |
- |
- |
1.20 |
- |
- |
- |
|
11 |
1.00 |
- |
- |
1.10 |
- |
- |
- |
|
12 |
- |
- |
- |
1.35 |
- |
- |
- |
|
13 |
- |
1.00 |
180.00 |
- |
- |
1.00 |
- |
|
14 |
- |
- |
- |
- |
1.50 |
- |
- |
|
15 |
- |
- |
270.00 |
- |
0.70 |
- |
- |
|
16 |
- |
1.00 |
- |
0.80 |
- |
- |
1.00 |
|
17 |
- |
- |
90.00 |
- |
- |
1.00 |
1.00 |
Figure 5. The effect of several data augmentation functions for the MR images in datasets
3.4 Deep learning techniques
Deep learning techniques have paved the way for significant increases in WMH classification, accuracy, and segmentation performance. Moreover, new methods were added to the approach called regional convolutional neural networks (R-CNN), Fast R-CNN, Faster R-CNN, and most recently Mask R-CNN, which have made great progress in image segmentation. With Mask R-CNN and recently developed similar methods, a new stage has been passed in the field of image segmentation, and objects belonging to the same class on the image can be defined as separate objects by switching from the semantic segmentation method to the instance segmentation method. U-Net and Mask R-CNN are two important techniques that pave the way for the development of automatic methods for the segmentation of WMH. Since the U-Net network is easier to implement and the training time is shorter, it has started to be widely used in medical image analysis.
Mask R-CNN, on the other hand, is very successful in image segmentation, but has a multi-layered and complex structure. For this reason, it requires high computing capability and the difficulty of making changes in the network structure. Since the implementation of the Mask R-CNN network is relatively more complex and imposes higher experiment requirements on the hardware conditions, its application on medical images is negligible. However, it is predicted that the Mask R-CNN network may be used more frequently in the near future for the detection of objects in 3D from MR images due to its features such as determining the classes of objects on the MR images, marking their boundaries, and having a separate identifier for each object.
In this study, a comparative analysis of U-Net and Mask R-CNN deep learning models for automatic segmentation of WMH is performed. In the study, the WMH Segmentation Challenge dataset [59], created from FLAIR MR images obtained from three different MR devices and released in a challenge held in 2017, is used. In addition, the ISLES 2015 Challenge dataset [46], which consists of Ischemic Stroke disease images that contain hyperintense developments and can be diagnosed by WMH developments, is used in experimental studies.
Although there are images obtained in different sequences in both datasets, studies have been carried out on FLAIR MR images where hyperintense developments can be observed well. Each image in the datasets was marked by experts as ground truth, which is used as a reference to measure the accuracy of the designed detection system.
Two different deep-learning techniques are used for WMH detection and segmentation in this study. The first of these is the U-Net, which emerged in 2015 and has a CNN-based architecture [62]. U-Net has gained rapidly increasing popularity in the segmentation of biomedical images since it was developed for the segmentation of biomedical images. U-Net can also segment images efficiently with smaller dataset sizes and can provide fast training and experimental results. In image segmentation using U-Net, semantic segmentation is applied, unlike the classical object classification and localization methods. U-Net enables the detection of each object belonging to one or more different classes on the image as a separate cluster. Each cluster represents a different object class and object boundaries can be marked using masking by detecting the components of the objects on a pixel basis. The second one is the Mask Region-Based Convolutional Neural Networks (Mask R-CNN), which is one of the convolutional neural networks (CNN) that has emerged recently and has been increasing in popularity in recent years [63]. In experimental studies, the optimum values of hyperparameters for WMH segmentation were determined and different Mask R-CNN models were created with fine-tuning. Although Mask R-CNN consists of convolutional operations such as U-Net, it has a larger and more advanced network structure. Mask R-CNN network performs image segmentation with high accuracy and it requires larger datasets and more powerful hardware components compared to the U-Net network. However, Mask R-CNN provides a more improved detection than semantic segmentation. Mask R-CNN does not only provide the classification of the image objects as belonging to a particular class. In addition, each object is masked separately. The method called instance segmentation, where the boundaries of the object and localization are determined, is also used in Mask R-CNN.
3.4.1 Mask R-CNN
Mask R-CNN is a deep learning network based on convolutional neural networks and uses the instance segmentation method known as the ability to estimate the boundaries of each detected object separately. Instance segmentation does not classify all objects belonging to the same class with a single label as in the widely used semantic segmentation method, but assigns a separate label to each object. In order to cope with this, segmentation is performed on the basis of pixels, and this is the biggest difficulty in the implementation of the method. For instance, segmentation contains more information about lesions, and it can help physicians more in disease detection. In Mask R-CNN architecture, in the first layer, convolution processes that enable to extract the features of the input image, called as backbone architecture with feature pyramid network (FPN), are applied. In the second layer, the region proposal network (RPN), which enables the extraction of regions of interest (RoI) to perform detection in the input image, is performed. In the third and last layer, detection/localization/masking processes are performed and so, each object is detected and classified separately.
The basics of Mask R-CNN were laid in 2014 for the first time by adding the region proposal to the CNN architecture and obtaining the R-CNN method [64]. In 2015, this problem was solved thanks to the selective search (SS) structure, which caused the bottleneck in the R-CNN network and worked 2000 times for each image, only once. In this way, the Fast R-CNN model has emerged, in which a speed increase of 9 times in the training phase and 213 times in the test phase is achieved [65]. In 2016, the region proposal network (RPN) recommendation was used instead of selective search, which is another bottleneck construct. In this way, the Faster R-CNN model, in which the training speed is increased 10 times compared to the Fast R-CNN model, has emerged [66]. Finally, in 2018, the Mask R-CNN model, which allows segmentation on a pixel basis, was created thanks to the masking layer added to the output of the Faster R-CNN network [63].
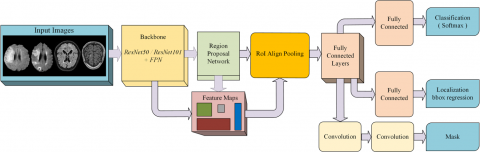
In our study, the architecture of Mask R-CNN network for WMH segmentation is shown in Figure 6. In this architecture, MR images and mask data of the slices were given to the network input for WMH detection and classification, as shown in Figure 6. Then edge and shape features are extracted first with convolutional operations in the ResNet101 layer. Thus, a feature map is created. In the next step, windows called anchors are produced with the RPN dimensions such as 128×128, 64×64, 32×32 and aspect ratios (0.5, 1.0, 2.0) determined in accordance with the dataset. The windows proposed by RPN are traversed over the entire feature map by sliding window method. Thus, the candidate regions to find the object to be detected are detected on the image. In the final stage, candidate images are convolutional processed through fully connected layers (FCL) and then sent to the multi-branched prediction layer, which makes classification, localization, and mask estimation. An FCL is applied for classification prediction, a regression layer for localization, and a connected FCL is applied to generate the target mask.
3.4.2 U-Net
The biggest challenge is the inability to obtain a sufficient number of training images in the proposed studies for WMH segmentation. Especially in CNN-based deep learning algorithms, the number of images needed for training has to be even more. However, the need for a high processor and RAM capacity also arises. To overcome these problems, the U-Net network, which is a simple but effective CNN compared to complex network structures, was developed [48]. Since U-Net has a simple network structure, it can perform image segmentation with less training images and faster than other CNN networks. The segmentation conducted in U-Net is semantic segmentation. The network architecture consists of two parts. The first part is the contraction path, also called as the encoder, which is used to capture the image context. In this part, the context features of the image are obtained. Each step in this layer uses 3×3 convolution kernels and an activation function, usually rectified linear unit (ReLu). In the next step, when 2×2 pooling is done, the image matrix size is divided by two and the number of features is doubled.
In addition, the output results from the convolution processes in each step is given to the input of the second part (decoder) of the parallel network, by copying and cropping, with a skip connection. However, at this stage, bottleneck may occur because some attributes are lost as a result of convolution operations and cannot be passed to the output. A simple but effective solution to the bottleneck problem is provided by transferring the attributes to the second layer, which is the decoder, thanks to the skip connection. In the second layer, the images with increased number of features but reduced size are processed again using 3x3 convolution kernel and activation function at each step, and multiplied by the up-convolution kernel. Due to the processes conducted in this layer called as decoder, both the size of the image is converted back to the size of the input, and precise localization is provided. U-Net is an end-to-end fully convolutional network (FCN) and can accept an image of any size at its input since it does not contain a dense layer, except for convolution layers. The architecture of the U-Net deep learning technique is presented in Figure 7.
Figure 6. The architecture of Mask R-CNN deep learning technique for WMH segmentation
Figure 7. Architecture of U-Net deep learning technique for WMH segmentation
In this study, a computer consisting of an Intel i7 2.2GHz 8+8 Core CPU, 48 GB RAM memory, and NVIDIA RTX2070 GPU components were used for all experimental studies. The RTX2070 is a 256-bit graphics card with a frequency of 1620 MHz and containing 8GB of GDDR6 RAM. The graphics card has 2304 CUDA cores to perform intensive calculations used in deep learning. A single GPU was used during the training. While the batch size can be selected as 32 for the U-Net network, 2 or 4 values can be selected for Mask R-CNN according to the depth of the network. The coding was done with python language and Tensorflow 2.5.0 and Keras 2.5.0rc0 libraries, which are high-level APIs, were used.
For automatic WMH segmentation, Mask R-CNN and U-Net deep learning techniques were used on datasets. For the Mask R-CNN, the basic matterport model [67] was used and improvements were built on it. The Mask R-CNN implementation used in the study was designed in a way to be used with ResNet50 or ResNet101 network models as a backbone structure. In order to shorten the training time and obtain more successful results, the weight coefficients obtained from the pre-trained networks (COCO) were used. The learning conducted by using the weight coefficients obtained from the pre-trained networks obtained as a result of the training of datasets consisting of hundreds of thousands of images such as common objects in context (COCO) and ImageNet is called transfer learning. As a result of the training, when the COCO weight coefficients were used, the learning was successful. First, the ResNet50 backbone structure was used for feature extraction and was successful. Then the larger ResNet101 backbone structure was used and better results were obtained than the ResNet50 backbone.
The Mask R-CNN structure contains many hyperparameters. Due to the unpredictability of the different effects of each of the many hyperparameters on training, the most appropriate values can only be determined by testing. This can make our work even more difficult, especially in solving difficult problems with limited hardware possibilities. For this reason, the carefully selection of hyperparameters has a very important place in the implementation of Mask R-CNN since it directly affects the success of training. With the datasets used in experimental studies, trainings were carried out with different hyperparameter values in order to achieve high segmentation performance. Hyperparameters in deep learning networks do not have a definite value and may vary according to criteria such as the size of the used dataset, the hardware capacity and the difficulty level of the problem. Optimum values for hyperparameters used in deep learning architectures are mostly determined empirically, but they can also be determined heuristically.
In this study, the most appropriate values for hyperparameters were determined empirically, taking into account previous studies. For example, the RPN_Anchor_Scales parameter used for the proposal of the region to be created per image has to be selected according to the image sizes and the object sizes to be detected. In addition, it is known that smaller RPN values have to be selected for the detection of smaller objects in the images [66]. For this reason, large RPN scales (16, 32, 64, 128, 256) were used for larger objects in the first stage of the training. In the second stage of the training, for the detection of smaller objects, 8x8 size RPN scales were added instead of 256×256, and smaller scaled tiles (8, 16, 32, 64, 128) were used and had a positive effect on the performance.
Another hyper-parameter, the Train_ROIs_Per_Image hyper-parameter, which determines the number of regions of interest per image, has a quadratic effect on the computational load in the convolution phase. As a result of training using 64×64 and 128×128 values for Train_ROIs_Per_Image, it has been seen that the positive effect on training is low compared to the processing load caused by choosing this value as too large if there are not many objects on the image, and it has been concluded that reducing this value significantly reduces the training time. Another hyper-parameter that affects training time and object segmentation performance is the number of tile suggestions per image, RPN_Train_Anchors_Per_Image. This value was chosen as 512 in the Mask R-CNN article. While the duration of the trainings made by choosing 64 or 128 in experimental studies was shortened, there was no significant decrease in performance. In addition, studies [63, 65, 66] were taken as reference when determining weight decay, batch size, learning rate and momentum parameters.
The other critical hyperparameter is the learning rate (LR) coefficient, which determines how much learning can be done as a result of the operations performed in each layer. If LR is chosen too high, it causes the weight coefficients to explode, and if it is chosen too small, it causes under-fitting, which is the case where learning does not occur. During the training, the LR value was decreased from 0.001 to 0.0001, and therefore early learning was prevented, training continued for an extended period of time, and more successful results were obtained. For the detection of large-sized objects on the image, the size of the anchor used for the region of interest has to be larger, and the anchor size has to be chosen smaller for small objects. Since there were both large and small sized objects in the WMH images in our study, first large-scaled anchors (16, 32, 64, 128, 256) were used and then in fine-tuning process, small-scaled anchors (8, 16, 32, 64, 128) were used to increase performance. In addition, the ROIs hyperparameter, which determines the number of regions of interest (RoIs) per image, has a quadratic effect on the computational load in the convolution phase. If there are not many objects on the image, the positive effect on training is much lower compared to the processing load caused by selecting this value. For this reason, the training time was significantly reduced by using 64×64 and 128×128 values for Train ROIs Per Image. Another hyperparameter affecting the training time and object detection performance is the RPN Train Anchors Per Image value, which is the number of tile proposals per image. Because this value was chosen 64 or 128 values, training time was reduced and successful results were obtained.
The backbone, which consists of network layers where convolution operations are conducted from these hyperparameters, can be selected according to the difficulty of the problem and hardware features. If a small backbone is selected for complex problems or a large backbone with many layers is selected for simple problems, our network will not achieve the expected training performance result. In our study, ResNet50 backbone structure and ResNet101 consisting of more layers were used for both datasets, and WMH segmentation was performed by successfully extracting the features of the images using both backbones.
Since U-Net, is the other technique used for WMH segmentation in this study, the technique is simpler than the Mask R-CNN technique, and it is easier to implement. While Mask R-CNN has about 44.662.942 training parameters with ResNet50 and 63.733.406 training parameters with ResNet101, only 2.140.065 parameters are trained in the U-Net network. However, with U-Net, segmentation can only be done by classifying the pixels and background of the objects on the image. As in the Mask R-CNN technique, instance segmentation cannot be performed in U-Net. While feature extraction in U-Net is conducted using convolution operations, localization is also provided by transpose convolution operations.
In the experimental studies, 802 images from ISLES 2015 Ischemic Stroke dataset and 572 images from the WMH Segmentation Challenge dataset were selected. These created datasets are not large enough for Mask R-CNN training and when training was done in this way, the network encountered an overfitting problem. Adding a Dropout layer to the network and increasing the number of images with data augmentation can be widely used to overcome the overfitting problem. In this study, the overfitting problem was overcome with data augmentation. With data augmentation, ISLES 2015 Ischemic Stroke dataset was increased approximately 6 times and the WMH Segmentation Challenge dataset was approximately 10 times. Thus, the overfitting problem was substantially resolved. In addition, Adam optimizer was used for optimization in experiments and the sigmoid function was also used as the activation function in U-Net deep learning technique.
For the measurement of training performance in U-Net, the loss function, which calculates the loss value during the training, and the validation loss function, which calculates the loss value during the validation phase, are used. Unlike U-Net, a multiple loss function is used instead of a single loss function during training and validation in Mask R-CNN. The reason for this is that classification, bounding box, and mask classification are conducted using three different classifiers in the output layer. The loss functions of each of these are calculated separately. Therefore, the loss function (L) is formulated in Mask R-CNN as follows in Eq. (2).
$L=L_{r p n_{-} c l a s s}+L_{r p n \_b b o x}+L_{m r c n n_{-} c l a s s}+L_{m r c n n \_b b o x}+L_{{mrcnn\_mask }}$ (2)
where, $L_{r p n \_c l a s s}$ and $L_{r p n \_b b o x}$ represent the class loss and bounding box loss values for RPN, respectively, and $L_{m r c n n \_c l a s s}, L_{m r c n n \_b b o x}$ and $L_{m r c n n \_m a s k}$ represent the class loss, bounding box loss and mask loss values for Mask R-CNN, respectively.
As a result of the training, the detection and segmentation performance of objects was conducted using commonly used metrics and compared with the experimental studies in two datasets. In segmentation, the performance of the proposed method is measured by the similarity of the ground truth mask and the segmented image by the proposed method. Dice similarity coefficient (DSC), which is one of the frequently used metrics for WMH segmentation performance, was used in experimental studies. DSC takes a value between 0.0 and 1.0 [68]. DSC is given in Eq. (3).
$\operatorname{DSC}\left(\operatorname{Seg}_{\mathrm{gt}}, \operatorname{Seg}_{\text {mask }}\right)=\frac{2 \,\, \left|\mathrm{Seg}_{\mathrm{gt}} \cap \mathrm{Seg}_{\text {mask }}\right|}{\left|\operatorname{Seg}_{\mathrm{g} t}\right|+\mid \text { Seg }_{\text {mask }} \mid}$ (3)
where, $Seg_{gt}$ shows the reference segmentation result marked by the expert and $Seg_{mask}$ shows the predicted segmentation. Another frequently used metric is Precision (PRC), which shows the detection accuracy of the regions with images [69]. PRC is shown in Eq. (4), where TP denotes true positives, FP denotes false positives. PRC takes also value between 0.0 and 1.0.
$\mathrm{P R C}=\frac{\mathrm{T P}}{\mathrm{T P}+\mathrm{F P}}$ (4)
The PRC metric can measure the performance of detected objects. For this reason, it is insufficient to measure the performance effect of undetected objects. PRC is also sensitivity for detecting individual lesions [70]. For this reason, the Recall (RC) metric shown in Eq. (5). is also used in experimental studies. Here, FN represents false negative values and TP denotes true positive. RC metric gives the ratio between the detected objects and the total number of objects that need to be detected.
$\mathrm{RC}=\frac{\mathrm{TP}}{\mathrm{TP}+\mathrm{FN}}$ (5)
Although these two metrics provide information about the performance of the proposed methods, they alone are insufficient for performance. For this reason, the F1 metric, which was created by taking the harmonic mean of RC and PRC values, was also used [71]. The F1 metric is given in Eq. (6).
$\mathrm{F} 1=2 \mathrm{x} \frac{\mathrm{PRC} * \mathrm{RC}}{\mathrm{PRC}+\mathrm{RC}}$ (6)
4.1 Results for ISLES 2015 stroke challenge dataset
In this study, data augmentation was applied for the dataset because the results were not successful enough in the pre-trainings performed in the experimental studies and the loss function could not be observed to improve over time. The ISLES 2015 dataset set was increased from 802 images to 4752 images by applying data augmentation functions (between 4 and 7 times) in Table 2.
The loss and validation loss (val_loss) values in epoch during training for Mask R-CNN and U-Net deep learning techniques on ISLES 2015 dataset are denoted in Figure 8(a) and Figure 8(b), respectively. Here, it is seen that the patterns of loss curves formed in the training and validation stages of both deep learning techniques are similar and the networks are successful.
Figure 8. The loss and validation loss (val_loss) values in epoch during training and validation of (a) Mask R-CNN and (b) U-Net deep learning techniques on ISLES 2015 dataset
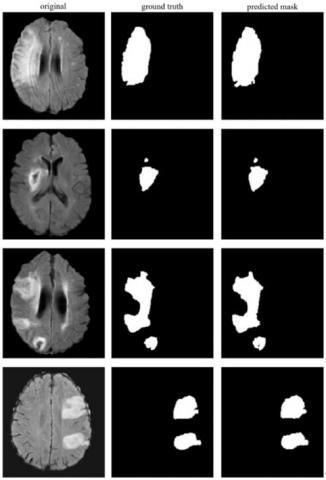
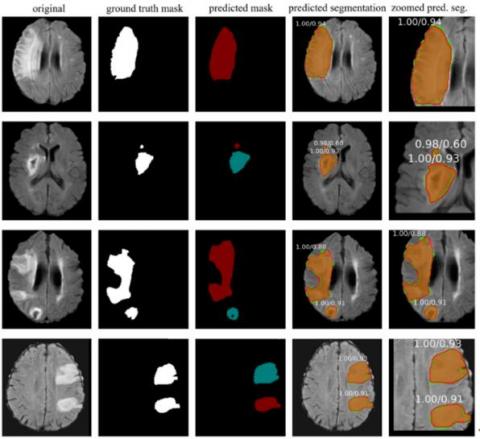
In experimental studies using the stroke dataset with the U-Net technique, 0.92 segmentation scores on pixel basis according to the DSC metric, and 0.89, 0.95 and 0.92 scores according to the PRC, RC and F1 metrics were achieved, respectively. The results from some of the ISLES 2015 MR images for stroke detection are shown in Figure 9. Here, the original MR image, ground truth masks of the stroke lesion area marked by the expert, and semantic segmentation masking of the lesion areas detected with U-Net are given for four different MR images. As a result of the experimental studies performed by the Mask R-CNN using the stroke dataset, 0.93 DSC score was achieved on pixel basis. In addition, as a result of the experiments, 0.97 PRC, 0.98, RC and 0.98 F1 scores were achieved.
Figure 9. U-Net segmentation results in ISLES 2015 dataset for some MR images
The results of some images obtained in the experimental studies for the stroke dataset are shown in Figure 10. Here, the original MR image, masks of the ground truth marked by the expert, the segmented stroke area (predicted mask) as a result of the Mask R-CNN prediction, overlapping of segmentation and ground truth (predicted segmentation) and the zoomed image of the stroke lesion area are given for four different MR images. In Figure 10, masking in green represents the referenced ground truth, and the masking region in red denotes the region segmented by the proposed Mask R-CNN technique. The orange-colored region shows the overlap of the predicted segmentation and the ground truth masks.
The trainings were conducted by trying data augmentation functions and fine-tuned hyperparameter values to achieve high performance with the stroke dataset. In experimental studies, successful WMH segmentation results were obtained with U-Net and 4 different Mask R-CNN networks created using different hyperparameters. The properties of hyperparameters used for fine-tuning in networks are denoted in Table 3, comparatively.
Figure 10. Mask R-CNN segmentation results in ISLES 2015 dataset for some MR images
Table 3. General characteristics of deep learning networks and hyperparameters to fine-tuning used in ISLES 2015 dataset for training
|
Parameter |
Stroke MRCNN #1 |
Stroke MRCNN #2 |
Stroke MRCNN #3 |
Stroke MRCNN #4 |
U-Net |
|
Batch size |
2 |
4 |
2 |
4 |
32 |
|
Kernel size |
3×3 |
3×3 |
3×3 |
3×3 |
3×3 |
|
Pooling |
3×3 max poling |
3×3 max poling |
3×3 max poling |
3×3 max poling |
2×2 max pooling |
|
Activation function |
ReLU |
ReLU |
ReLU |
ReLU |
ReLU |
|
Classification |
ReLU+ softmax (sigmoid for mask) |
ReLU+ softmax (sigmoid for mask) |
ReLU+ softmax (sigmoid for mask) |
ReLU+ softmax (sigmoid for mask) |
ReLU+ softmax (sigmoid for out channel>1) |
|
Optimizer |
SGD |
SGD |
SGD |
SGD |
Adam |
|
Learning Rate |
0.001 (Each epoch after the 5th is multiplied by 0.99) |
0.001 (Each epoch after the 5th is multiplied by 0.99) |
0.001 (Each epoch after the 5th is multiplied by 0.99) |
0.001 (Each epoch after the 5th is multiplied by 0.99) |
0.001 |
|
Backbone |
ResNet 101 |
ResNet 101 |
ResNet 50 |
ResNet 50 |
- |
|
RPN_Anchor_Scales |
16,32,64,128,256 first stage, 8,16,32,64,128 second stage (for last 20 epoch) |
16,32,64,128,256 |
16,32,64,128,256 |
16,32,64,128,256 |
- |
|
Train_ROIs_Per_Image |
256 |
128 |
256 |
128 |
- |
|
RPN_Train_Anchors_Per_Image |
256 |
128 |
256 |
128 |
- |
|
Detection_Min_Confidence |
0.70 first stage, 0.85 second stage |
0.85 |
0.85 |
0.85 |
- |
|
Detection_NMS_Threshold |
0.70 first stage, 0.80 second stage |
0.80 |
0.80 |
0.80 |
- |
|
RPN_NMS_Threshold |
0.70 first stage, 0.80 second stage |
0.80 |
0.80 |
0.80 |
- |
Table 4. Training times of deep learning techniques for ISLES 2015 stroke dataset in experimental studies
|
Technique |
Epoch Size |
Step Size (per Epoch) |
Training Time per Image (Second) |
Test Time per Image (Second) |
Total Training Time (Minutes) |
|
Stroke MRCNN #1 |
70 |
2378 |
0.273 |
0.362 |
1515.78 |
|
Stroke MRCNN #2 |
70 |
1200 |
0.195 |
0.352 |
1092 |
|
Stroke MRCNN #3 |
70 |
2378 |
0.261 |
0.357 |
1448.07 |
|
Stroke MRCNN #4 |
70 |
1200 |
0.164 |
0.346 |
914.4 |
|
U-Net |
120 |
148 |
0.017 |
0.213 |
165.168 |
In experimental studies with networks whose properties are given in Table 3, the performances of the training and test for each network are shown in Table 4 comparatively. If the two tables are evaluated together, it is seen that the training time gets shorter as the batch size increases. This is due to the fact that the number of images processed per unit of time increases in direct proportion to the batch size.
In addition, as the Mask R-CNN networks consist of deep CNN layers, the size of the RPN_Train_Anchors_Per_Image and Train_ROIs_Per_Image parameters used for object localization and the size of the data set increase, the processing load and RAM requirement increase. For this reason, due to the hardware constraints, the batch size could be set to a maximum of 4 in the trainings made with Mask R-CNN for the stroke dataset with a single GPU. In the trainings performed with the U-Net network in the same training set, the batch size could be set to a much larger value such as 32. Therefore, the training time of the U-Net network is shorter.
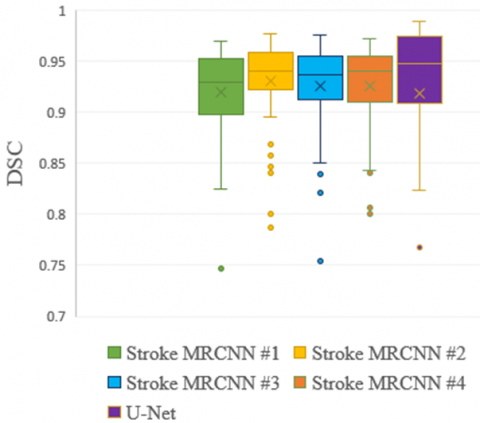
The average performance results according to different measurement metrics are given in Table 5, and the box plot in Figure 11 for DSC scores is denoted. It is seen that DSC scores vary in a narrow range between 0.89 and 0.93. The highest and lowest DSC scores on an image basis were obtained with U-Net and WMH MRCNN #1 with 0.98 and 0.75, respectively.
Table 5. Segmentation results of deep learning techniques for ISLES 2015 stroke dataset according to metrics
|
Technique |
PRC |
RC |
F1 |
DSC |
|
Stroke MRCNN #1 |
0.99 |
0.99 |
0.99 |
0.93 |
|
Stroke MRCNN #2 |
0.98 |
0.98 |
0.98 |
0.93 |
|
Stroke MRCNN #3 |
0.99 |
0.98 |
0.98 |
0.93 |
|
Stroke MRCNN #4 |
0.97 |
0.99 |
0.98 |
0.93 |
|
U-Net |
0.89 |
0.95 |
0.92 |
0.92 |
Figure 11. Box plot distribution of the deep learning techniques used in the segmentation of stroke lesions according to DSC scores
4.2 Results for WMH segmentation challenge dataset
As in the stroke dataset, data augmentation was applied in the WMH dataset. The dataset consisting of 572 images was increased between 8 and 12 times and was increased to 6000 images. In experimental studies using the WMH dataset with the Mask R-CNN technique, 0.83 segmentation score was achieved on a pixel basis according to the DSC. In addition, 0.83, 0.73, and 0.78 scores were obtained for PRC, RC, and F1, respectively.
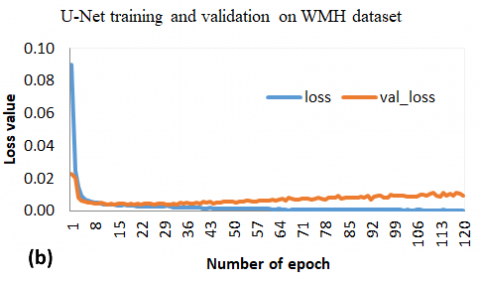
The loss and validation loss (val_loss) values in epoch during training for Mask R-CNN and U-Net on WMH dataset are denoted in Figure 12(a) and Figure 12(b), respectively. Here, although it is seen that the patterns of the loss curves formed in the training and validation stages of both deep learning techniques are similar and the networks are successful, the U-Net deep learning network has become stable in a shorter time and the loss values are lower.
In the experimental studies carried out using the U-Net on the WMH dataset, 0.82 segmentation score on pixel basis was achieved for DSC. In addition, 0.83, 0.83 and 0.82 scores were obtained for PRC, RC and F1, respectively. The results of some segmented images on WMH dataset with U-Net are shown in Figure 13. Here, original MR images (a, b, c, d), expert-marked stroke lesion area (ground truth), and semantic segmentation masking of U-Net detected lesion areas are presented.
Figure 12. The loss and validation loss (val_loss) values in epoch during training and validation of (a) Mask R-CNN and (b) U-Net deep learning techniques on WMH segmentation challenge dataset
Figure 13. Some segmented MR images with U-Net technique in WMH Segmentation Challenge dataset
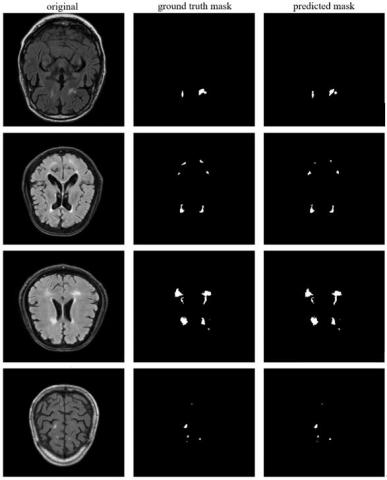
Some images of successful WMH segmentation with Mask R-CNN deep learning technique in WMH Segmentation Challenge dataset are shown in Figure 14. Here, the original MR image for four different MR images, WMH region (ground truth) masks marked by the expert, WMH region segmented with Mask R-CNN (predicted mask), over-lapping of Mask R-CNN segmentation and ground truth (predicted seg.), zoomed-in view of the WMH segmentation result are shown.
In the trainings performed with the WMH Segmentation Challenge dataset, many trainings were conducted with various data augmentation techniques and hyperparameter values by following the procedures in the other dataset. As a result of the experimental studies in the WMH Segmentation Challenge dataset, very successful results were obtained with U-Net and three different Mask R-CNN networks created using different hyperparameters. However, since the WMH lesions in the WMH Segmentation Challenge dataset are much smaller and more diverse, two-stage training was applied, first by segmentation of larger lesions, then segmentation of much smaller lesions. The properties of the networks and hyperparameters used for automatic segmentation in the WMH Segmentation Challenge dataset are given in Table 6, comparatively.
Figure 14. Some segmented MR images with Mask R-CNN technique in WMH Segmentation Challenge dataset
Table 6. The networks and hyperparameters to fine-tuning used for automatic segmentation in training of the WMH segmentation challenge dataset
|
Parameter |
WMH MRCNN #1 |
WMH MRCNN #2 |
WMH MRCNN #3 |
U-Net |
|
Batch Size |
2 |
4 |
4 |
32 |
|
Kernel Size |
3×3 |
3×3 |
3×3 |
3×3 |
|
Pooling |
3×3 max poling |
3×3 max poling |
3×3 max poling |
2×2 max pooling |
|
Activation Function |
ReLU |
ReLU |
ReLU |
ReLU |
|
Classification |
ReLU+ softmax (sigmoid for mask) |
ReLU+ softmax (sigmoid for mask) |
ReLU+ softmax (sigmoid for mask) |
ReLU+ softmax (sigmoid for out channel>1) |
|
Optimizer |
SGD |
SGD |
SGD |
Adam |
|
Learning Rate |
0.001 (Each epoch after the 5th epoch is multiplied by 0.98) |
0.001 (Each epoch after the 5th epoch is multiplied by 0.98) |
0.001 (Each epoch after the 5th epoch is multiplied by 0.98) |
0.001 |
|
Backbone |
ResNet 101 |
ResNet 101 |
ResNet 50 |
- |
|
RPN_Anchor_Scales |
8,16,32,64,128 first stage, 4,8,16,32,64 second stage (for last 20epoch) |
8,16,32,64,128 first stage, 4,8,16,32,64 second stage (for last 20epoch) |
8,16,32,64,128 first stage, 4,8,16,32,64 second stage (for last 20epoch) |
- |
|
Train_ROIs_Per_Image |
256 |
128 |
128 |
- |
|
RPN_Train_Anchors_Per_Image |
512 |
128 |
128 |
- |
|
Detection_Min_Confidence |
0.60 |
0.60 |
0.60 |
- |
|
Detection_NMS_Threshold |
0.60 |
0.60 |
0.60 |
- |
|
RPN_NMS_Threshold |
0.70 |
0.70 |
0.70 |
- |
Table 7. Training and test times of deep learning techniques in WMH segmentation challenge dataset according to the number of epochs and step size
|
Technique |
Epoch Size |
Step Size (per Epoch) |
Training Time per Image (Second) |
Test Time per Image (Second) |
Total Training Time (Minutes) |
|
WMH MRCNN #1 |
70 |
3000 |
0.282 |
0.615 |
3384.34 |
|
WMH MRCNN #2 |
70 |
1500 |
0.193 |
0.591 |
2316 |
|
WMH MRCNN #3 |
70 |
1500 |
0.154 |
0.573 |
1846.54 |
|
U-Net |
70 |
187 |
0.017 |
0.275 |
206.25 |
Table 8. Segmentation performance results of deep learning techniques in WMH segmentation challenge dataset according to metrics
|
Technique |
PRC |
RC |
F1 |
DSC |
|
WMH MRCNN #1 |
0.83 |
0.73 |
0.78 |
0.83 |
|
WMH MRCNN #2 |
0.86 |
0.71 |
0.78 |
0.81 |
|
WMH MRCNN #3 |
0.8 |
0.77 |
0.79 |
0.81 |
|
U-Net |
0.83 |
0.83 |
0.82 |
0.82 |
In Table 7, training and test times are presented comparatively according to the number of epochs and step size in the experimental studies carried out with the deep learning techniques whose properties are given in Table 6 in the WMH Segmentation Challenge dataset. From this, it is clearly seen that the training time gets shorter as the batch size increases. Also, since the WMH Segmentation Challenge dataset is larger in size, the training times are longer than the other dataset.
Table 8 presents the results obtained in the experimental studies. According to the DSC metric, the most successful results were obtained with the WMH MRCNN #1 configuration. On the other hand, according to the PRC metric, the most successful result was achieved in the WMH MRCNN #2 configuration. Moreover, according to RC and F1 scores, U-Net achieved the most successful result. In addition, the results obtained with the U-Net network and the Mask R-CNN networks are very close to each other.
The average segmentation performances according to the DSC metric for four different networks used in the experimental studies conducted in the WMH Segmentation Challenge dataset are shown with the box plots in Figure 15. With the U-Net deep learning technique, as in the other dataset, it is seen that the DSC scores are in the widest range of distribution. On the other hand, the narrowest distribution range for DSC was obtained with WMH MRCNN #3. In addition, the highest and lowest performance results on the basis of images were also obtained with the U-Net deep learning model. The average DSC scores are very close to each other and the best score was obtained with WMH MRCNN #1 with 0.83. For DSC scores, the WMH Segmentation Challenge dataset has a much wider distribution range than the other dataset. In addition, lower scores were obtained for DSC in the WMH Segmentation Challenge dataset compared to the other dataset. The main reasons for this situation are that the WMH dataset contains images of different quality collected from three different MR devices, and WMH lesions are smaller than stroke lesions and contain very small lesions such as 1-2 pixels.
Segmentation of lesions in the WMH dataset is less successful than in the stroke dataset. The fact that the images in the WMH dataset contain a large number of small lesions consisting of 1-2 pixels and therefore the labeling errors of the experts increase, is due to the fact that the segmentation of these lesions is much more difficult. In addition, the use of images obtained from three different MR devices in the WMH dataset and the low quality of some of the images collected from the devices made it difficult to distinguish hyperintense developments.
Figure 15. The average segmentation performances according to the DSC metric for four different networks used in the experimental studies conducted in the WMH segmentation challenge dataset
4.3 Comparative analysis of the result
A comparison of the performance of our study with some studies conducted for WMH segmentation is presented in Table 9. The DSC metric is used to compare the segmentation performances of the related studies. The DSC metric is a widely used metric in studies on segmentation because it reveals how much the detected segmentation mask and ground truth mask overlap on a pixel basis. It is seen that CNN-based semantic segmentation techniques are preferred in most of the existing studies proposed for WMH segmentation. In this study, semantic segmentation with U-Net and sample segmentation with Mask R-CNN were used. The Mask R-CNN which is used relatively less in studies and has a complex infrastructure, long training time, and requires more powerful hardware, relatively more successful results have been obtained compared to the U-Net technique. DSC scores showing segmentation performance were used to compare the results of the methods.
Although the results obtained with U-Net in our study are close to previous studies, our scores are mostly successful than most of them. It is seen that the results obtained with Mask R-CNN are similarly successful than previous studies. It is seen that the two-stage data augmentation and the detection of difficult-to-detect images in the dataset and applying more data augmentation are beneficial and increase the performance especially in the WMH dataset. It has been concluded that FPN, RPN, RoI pooling approaches provided by Mask R-CNN network, hyperparameter optimization and the use of pre-trained networks and transfer learning technique are also decisive in the performance.
In other studies, using the WMH Segmentation Challenge dataset, it is seen in Table 9 that DSC scores vary between 0.77 and 0.84. The most successful result was Liu et al. [72] used the WMH Segmentation Challenge dataset for training but used the ISLES 2015 stroke dataset instead of the WMH dataset for testing, they could only achieve a 0.84 dice score. In our study, the WMH Segmentation Challenge was used for both training and testing with the proposed methods, and 0.83 segmentation success was achieved according to the dice metric by using Mask R-CNN. Likewise, in other studies suggested earlier on the ISLES 2015 dataset, a segmentation performance between 0.76 and 0.85 was achieved according to the DSC score. In our study, DSC scores of 0.93 were achieved with the Mask R-CNN, and higher performance was obtained compared to previous studies.
In addition, unlike most of the other studies, extensive tests were made on two different data sets, and the training and test performances were given comparatively. Extensive experimental studies were carried out to determine the fine-tuned hyperparameter values, and thus the instance segmentation method was successful for WMH segmentation, which is a difficult problem. As a result, it has been revealed that it is important to determine the optimized values of the network parameters before comparing different methods in deep learning networks and applying novelty to the model.
Statistical analyzes were also performed in the study to reveal the significant relationship between DSC scores obtained using WMH and Stroke datasets. For statistical analysis, the two-sided Wilcoxon signed-rank test was applied since the data were normally distributed and there was a dependent variable for the results. The Wilcoxon signed-rank test is a non-parametric statistical test that evaluates the difference between the medians of the data of two dependent variables [73]. As can be seen in Table 9 used WMH Segmentation Challenge dataset, p-value (p= .011 < .05) was statistically significant in the two-sided Wilcoxon signed-rank test (N=10) between this study and other studies (Li et al. [45], Chen et al. [52], Park et al. [70], Hou et al. [71], Liu et al. [72], Wu et al. [74], Rathore et al. [75], Lee et al. [76], Zhou et al. [77] and Li et al. [78]). On the other hand, in ISLES 2015 dataset, the p-value (p= .012 < .05) was reached to be statistically significant in the two-sided Wilcoxon signed-rank test (N=9) between this study and other studies (Chen et al. [52], Khezrpour et al. [69], Liu et al. [72], Clèrigues et al. [79], Karthik et al. [80], Vupputuri et al. [81], Liu et al. [82], Wang et al. [83] and Rajinikanth et al. [84]).
In this study, Mask R-CNN, which provides a novel approach for automatic segmentation of WMH, was implemented by fine-tuning the hyperparameters as instance segmentation. Thanks to this approach, it has been seen that it has contributed to the detection of hyper-intensities encountered in brain MRI images with higher performance by experts. In addition, in our study, a detailed performance comparison of U-Net and different fine-tuned Mask R-CNN deep learning models were performed. In the study, WMH Segmentation Challenge and ISLES 2015 Challenge dataset were used in experimental studies. In experimental studies, the highest DSC score of 0.83 was achieved with the Mask R-CNN technique in experimental studies conducted using the WMH Segmentation Challenge dataset. In the previous studies proposed using this dataset, similar results were obtained in this study, and it was observed that the highest DSC scores were reached in these studies up to 0.84. Assessing the results, it is clear that the obtained WMH segmentation performance is successful for the WMH segmentation of the Mask R-CNN approach. Here, it has been proved by training and validation loss graphs in Figure 8 and Figure 13 that the segmentation performance obtained with the dataset is not unique to the dataset, that is the network gets rid of overfitting. The biggest reason why the performance ratio in the WMH Segmentation Challenge dataset did not increase further is that it contains very small WMH regions on a pixel basis. In addition, dataset size, magnetic field strength, cross-sectional area, Repetition Time (TR) and Echo Time (TE) of the MR device, noise and resolution values of images acquired by MR devices, and differences in expert masks may also affect the segmentation of WMH. The limitations of the study are the limited data sets, the difficulty of accessing the data sets, the need for more powerful equipment in the training phase in case of larger MR images. Due to these limitations, although the current deep learning techniques are useful in the decision-making processes of physicians in difficult problems such as WMH segmentation, it has been observed that they are not yet at a level that can be used for the creation and preliminary evaluation of decision support systems in the radiology units of hospitals. It is seen that the development and accessibility of powerful GPU components, the establishment of larger working groups to create and label data sets, and the development of techniques that can achieve much more successful results with limited resource use can enable decision-support systems to be usable.
On the other hand, in this study, higher performance was achieved with a 0.93 DSC score using Mask R-CNN in experimental studies conducted with the ISLES 2015 dataset. In addition, a very high success rate of 0.99 was achieved in the detection of lesions in the ISLES 2015 dataset. The most important reason for this can be said that the lesion sizes on the images in the dataset are larger and more distinct, and thus expert mask is done with higher accuracy. As a conclusion, higher DSC scores for WMH segmentation performance were achieved using the Mask R-CNN compared to previous studies. Hyperintense lesions were segmented using two datasets consisting of MR images. While one of the datasets consists of disease images belonging to a certain class (stroke), the other dataset consists of images in which all hyperintensities are classified as WMH in general. MICCAI 2017 WMH Challenge event was held in 2017, and then this dataset was provided as publicly-available. In this challenge, it was seen that CNN-based methods were generally successful and U-Net was used for the first time. In subsequent studies, it has been observed that the performance of the segmentation U-Net and methods developed by modifying the U-Net model is high. The biggest advantages of the U-Net model are that it can achieve good performance with a small number of images, and that it can train many images at the same time (high batch size) due to the low number of CNN layers. The application can be run with low-specification hardware and can get fast results. High performance has also been achieved with the Mask R-CNN network, which is a technique used in this study for WMH segmentation. The most important innovation that Mask R-CNN brought to the studies with deep learning-based networks is that if there is more than one object belonging to the same class, they are not only included in a single class identifier as in semantic segmentation but a unique descriptive object identifier is assigned to each object. In addition, individual localization information of each object is obtained in Mask R-CNN. In this way, it can also detect the exact location and size of each WMH lesion in the brain. This technique used in the Mask R-CNN model is called in-stance segmentation. In this respect, Mask R-CNN has a special place compared to other segmentation methods developed before it, and it can provide convenience in the 3D segmentation of lesions. There are a number of difficulties in the implementation of the Mask R-CNN network. In instance segmentation, the network architecture of Mask R-CNN is complicated by the feature extraction by focusing on each object separately (regions of interest), the use of FPN for pooling the regions of interest, the use of RPN structure for region recommendation, and the fact that it contains too many hyperparameters to optimize. With simple CNN, when 256×256 MR images are used, batch size images such as 32 and 64 can be processed with a single GPU, while this number can be limited to 2, 4, or at most 8 images at the same time for instance segmentation.
Table 9. The comparison of this study and some previously proposed studies for WMH segmentation
|
Study and Year |
Dataset |
MR Sequences |
WMH Type |
Method |
DSC |
|
(Guerrero et al. [44], 2018) |
WMH (their own dataset) |
T1-w and FLAIR |
WMH |
CNN (uResNet) |
0.70 |
|
(Li et al. [45], 2018) |
MICCAI 2017 WMH |
T1-w and FLAIR |
WMH |
U-Net |
0.80 |
|
(Manjón et al. [85], 2018) |
AIBL MICCAI 2008 MS Lesion |
FLAIR |
Alzheimer MS |
Ensemble of NN and patch-based voting |
0.78 |
|
(Jiang et al. [43], 2018) |
Their own datasets (OATS, Sydney MAS) |
T1-w and FLAIR |
WMH |
UBO detector, k-NN |
0.85 |
|
(Wu et al. [74], 2019) |
MICCAI 2017 WMH |
T1-w and FLAIR |
WMH |
SC U-Net |
0.78 |
|
(Liu et al. [72], 2020) |
MICCAI 2017 WMH (train), ISLES 2015 (test) |
T1-w and FLAIR |
WMH, Ischemic stroke |
M2DCNN |
0.84 |
|
(Liu et al. [82], 2020) |
ISLES 2015 (SISS) |
T1-w, T2-w, DWI and FLAIR |
Stroke
|
DRANet (U-Net based) |
0.76 |
|
(Rathore et al. [75], 2020) |
MICCAI 2017 WMH |
T1, FLAIR |
WMH |
ResNet+ SVM |
0.80 |
|
(Lee et al. [76], 2020) |
Acute Infarct (Asan Medical dataset) |
DWI
|
Stroke
|
U-Net+ SE (squeeze and excitation blocks) |
0.85
|
|
MICCAI 2017 WMH |
FLAIR |
WMH |
U-Net+ SE |
0.77 |
|
|
(Zhou et al. [77], 2020) |
MICCAI 2017 WMH |
T1, FLAIR |
WMH |
U-Net+ CRF+ Spatial |
0.78 |
|
(Hou et. al. [71], 2020) |
MICCAI 2017 WMH |
T1, FLAIR |
WMH |
HA-DCN |
0.80 |
|
(Clerigues et al. [79], 2020) |
ISLES 2015 (SISS) |
T1, T2, FLAIR, DWI, CBF, CBV, TTP and Tmax |
Stroke |
U-Net |
0.59 |
|
ISLES 2015 (SPES) |
0.84 |
||||
|
(Park et al. [70], 2021) |
MICCAI 2017 WMH |
T1-w and FLAIR |
WMH |
U-Net+ highlighting foregrounds (HF) |
0.81 |
|
(Karthik et al. [80], 2021) |
ISLES 2015 (SISS) |
T1-w, T2-w, DWI and FLAIR |
Stroke |
Multi-level RoI aligned CNN |
0.77 |
|
(Vupputuri et al. [81], 2021) |
ISLES 2015 (SISS) |
T1-w, T2-w, DWI and FLAIR |
Stroke |
MCA-DN CNN |
0.79 |
|
ISLES 2015(SPES) |
0.85 |
||||
|
(Rajinikanth et al. [84], 2021) |
ISLES 2015 |
T1-w, T2-w, DWI and FLAIR |
Stroke |
VGG+ SegNet |
0.93 |
|
(Li et al. [78], 2022) |
MICCAI 2017 WMH |
T1-w and FLAIR |
WMH |
U-Net |
0.83 |
|
Chinese National Stroke Registry (CNSR) |
Stroke |
0.78 |
|||
|
(Uçar and Dandıl [86], 2022) |
MICCAI 2008 MS Lesion (1) |
T2-w |
MS |
Mask R-CNN |
0.76 |
|
Their own brain tumor dataset TCGA-LGG (2) |
Brain tumors |
0.88 |
|||
|
(1)+(2) |
MS+ Brain tumor |
0.82 |
|||
|
(Chen et al. [52], 2022) |
ISLES 2015 (SISS) |
FLAIR |
Stroke |
CNN Posterior-CRF |
0.61 |
|
MICCAI 2017 WMH |
T1 and FLAIR |
WMH |
(U-Net based) |
0.79 |
|
|
(Wang et al. [83], 2022) |
ATLAS |
T1-w |
Stroke |
U-Net |
0.93 |
|
ISLES 2015 |
T1-w, T2-w, DWI and FLAIR |
0.79 |
|||
|
ISLES 2018 |
0.67 |
||||
|
(Khezrpour et al. [69], 2022) |
ISLES 2015 (SISS) |
FLAIR |
Stroke |
U-Net |
0.90 |
|
Proposed study |
MICCAI 2017 WMH |
FLAIR |
WMH |
Mask R-CNN |
0.83 |
|
U-Net |
0.82 |
||||
|
ISLES 2015 (SISS) |
Stroke |
Mask R-CNN |
0.93 |
||
|
U-Net |
0.92 |
It is seen that deep learning is successful for the detection and segmentation of WMH lesions on MR images, and there is a need for more clinical, experimental, and algorithmic studies to develop new approaches in this regard. As a result of the experimental studies, it is also very important to develop systems that can make it easier for physicians to make decisions and reduce their workload. It has been concluded that instance segmentation can be useful for image segmentation. Data augmentation methods are beneficial in increasing performance, but this provides limited improvement. In addition, the pre-trained network coefficients used for instance segmentation may be obtained by training very large datasets such as COCO, and ImageNet, consisting of different image classes. Similarly, it is thought that pre-training weight coefficients can be obtained and contribute to the increase of performance with large datasets containing only medical images belonging to different disease classes. In addition, it is thought that Mask R-CNN and similarly producing networks can be used more frequently in the future, especially for determining the classes of objects in MR images, drawing the boundaries of each object with descriptive information separately, and detecting 3D objects from MR images.
As a result, it has been seen that deep learning-based decision support systems can be developed and these systems can be a tool that physicians can apply during the automatic pre-assessment phase and in cases where physicians are undecided. In this way, it has been seen that early stage disease findings that may be overlooked can be detected, the treatment processes of the patients can be facilitated and health expenditures can be reduced. However, there are some difficulties in front of the development of these systems to be more effective and successful. It is clearly seen that powerful hardware components become available and besides software techniques that can achieve more successful results, comprehensive data sets are needed. In obtaining these needed data sets, it has been observed that there are limitations in terms of expert verification and interpretation, as well as data privacy and security concerns, and these should be overcome.
[1] Association, A.P. (2013). Diagnostic and statistical manual of mental disorders: DSM-5. Vol. 5. American Psychiatric Association Washington, DC.
[2] Di Luca, M., Nutt, D., Oertel, W., Boyer, P., Jaarsma, J., Destrebecq, F., Esposito, G.Quoidbach, V. (2018). Towards earlier diagnosis and treatment of disorders of the brain. Bulletin of the World Health Organization, 96(5): 298-298A. https://doi.org/10.2471/BLT.17.206599
[3] World Health Organization. (2015). International statistical classification of diseases and related health problems. 10th revision, Fifth edition, 2016 ed. Geneva: World Health Organization.
[4] Herholz, K., Salmon, E., Perani, D., et al. (2002). Discrimination between Alzheimer dementia and controls by automated analysis of multicenter FDG PET. Neuroimage, 17(1): 302-316. https://doi.org/10.1006/nimg.2002.1208
[5] Estimates, G.H. (2016). Disease burden by Cause, Age, Sex, by Country and by Region, 2000-2015. Geneva: World Health Organization.
[6] Wittchen, H.U., Jacobi, F., Rehm, J., Gustavsson, A., Svensson, M., Jönsson, B., Olesen, J., Allgulander, C., Alonso, J., Faravelli, C., Fratiglioni, L., Jennum, P., Lieb, R., Maercker, A., van Os, J., Preisig, M., Salvador-Carulla, L., Simon, R., Steinhausen, H.C. (2011). The size and burden of mental disorders and other disorders of the brain in Europe 2010. European Neuropsychopharmacology, 21(9): 655-679. https://doi.org/10.1016/j.euroneuro.2011.07.018
[7] Maddalena, L., Granata, I., Giordano, M., Manzo, M., Guarracino, M.R. (2022). Classifying Alzheimer's disease using MRIs and transcriptomic data. In BIOIMAGING, pp. 70-79. https://doi.org/10.5220/0010902900003123
[8] Food, U.Administration, D. Radiation-Emitting Products and Procedures - Medical Imaging MRI (Magnetic Resonance Imaging) - Benefits and Risks. 2017. https://www.fda.gov/radiation-emitting-products/mri-magnetic-resonance-imaging/benefits-and-risks.
[9] Bittner, R., Felix, R. (1998). Magnetic resonance (MR) imaging of the chest: State-of-the-art. European Respiratory Journal, 11(6): 1392-1404. https://doi.org/10.1183/09031936.98.11061392
[10] Müller, N. (2002). Computed tomography and magnetic resonance imaging: Past, present and future. European Respiratory Journal, 19(35 suppl): 3s-12s. https://doi.org/10.1183/09031936.02.00248202
[11] Jack Jr, C.R., O'Brien, P.C., Rettman, D.W., Shiung, M.M., Xu, Y., Muthupillai, R., Manduca, A., Avula, R., Erickson, B.J. (2001). FLAIR histogram segmentation for measurement of leukoaraiosis volume. Journal of Magnetic Resonance Imaging: An Official Journal of the International Society for Magnetic Resonance in Medicine, 14(6): 668-676. https://doi.org/10.1002/jmri.10011
[12] Chen, C.C.C., Chai, J.W., Chen, H.C., Wang, H.C., Chang, Y.C., Wu, Y.Y., Chen, W.H., Chen, H.M., Lee, S.K., Chang, C.I. (2019). An iterative mixed pixel classification for brain tissues and white matter hyperintensity in magnetic resonance imaging. IEEE Access, 7: 124674-124687. https://doi.org/10.1109/ACCESS.2019.2931761
[13] Burton, E.J., McKeith, I.G., Burn, D.J., Firbank, M.J., O'Brien, J.T. (2006). Progression of white matter hyperintensities in Alzheimer disease, dementia with lewy bodies, and Parkinson disease dementia: A comparison with normal aging. The American Journal of Geriatric Psychiatry, 14(10): 842-849. https://doi.org/10.1097/01.JGP.0000236596.56982.1c
[14] Mortamais, M., Artero, S., Ritchie, K. (2014). White matter hyperintensities as early and independent predictors of Alzheimer's disease risk. Journal of Alzheimer's Disease, 42(s4): 393-400. https://doi.org/10.3233/JAD-141473
[15] Hauser, S.L., Cree, B.A. (2020). Treatment of multiple sclerosis: A review. The American Journal of Medicine, 133(12): 1380-1390.e2. https://doi.org/10.1016/j.amjmed.2020.05.049
[16] Harris, K.G., Tran, D.D., Sickels, W.J., Cornell, S.H., Yuh, W. (1994). Diagnosing intracranial vasculitis: The roles of MR and angiography. American Journal of Neuroradiology, 15(2): 317-330.
[17] Hu, H.Y., Ou, Y.N., Shen, X.N., Qu, Y., Ma, Y.H., Wang, Z.T., Dong, Q., Tan, L., Yu, J.T. (2021). White matter hyperintensities and risks of cognitive impairment and dementia: A systematic review and meta-analysis of 36 prospective studies. Neuroscience & Biobehavioral Reviews, 120: 16-27. https://doi.org/10.1016/j.neubiorev.2020.11.007
[18] Etherton, M.R., Wu, O., Rost, N.S. (2016). Recent advances in leukoaraiosis: White matter structural integrity and functional outcomes after acute ischemic stroke. Current Cardiology Reports, 18(12): 123. https://doi.org/10.1007/s11886-016-0803-0
[19] Eikermann-Haerter, K., Huang, S.Y. (2021). White matter lesions in migraine. The American Journal of Pathology, 191(11): 1955-1962. https://doi.org/10.1016/j.ajpath.2021.02.007
[20] Ylikoski, A., Erkinjuntti, T., Raininko, R., Sarna, S., Sulkava, R., Tilvis, R. (1995). White matter hyperintensities on MRI in the neurologically nondiseased elderly: Analysis of cohorts of consecutive subjects aged 55 to 85 years living at home. Stroke, 26(7): 1171-1177. https://doi.org/10.1161/01.STR.26.7.1171
[21] Gons, R.A., van Norden, A.G., de Laat, K.F., van Oudheusden, L.J., van Uden, I.W., Zwiers, M.P., Norris, D.G., de Leeuw, F.E. (2011). Cigarette smoking is associated with reduced microstructural integrity of cerebral white matter. Brain, 134(7): 2116-2124. https://doi.org/10.1093/brain/awr145
[22] van Dijk, E.J., Breteler, M.M., Schmidt, R., Berger, K., Nilsson, L.-G.r., Oudkerk, M., Pajak, A., Sans, S., de Ridder, M., Dufouil, C., Fuhrer, R., Giampaoli, S., Launer, L.J., Hofman, A., for the CASCADE Consortium (2004). The association between blood pressure, hypertension, and cerebral white matter lesions: Cardiovascular determinants of dementia study. Hypertension, 44(5): 625-630. https://doi.org/10.1161/01.HYP.0000145857.98904.20
[23] Murray, A.D., Staff, R.T., Shenkin, S.D., Deary, I.J., Starr, J.M., Whalley, L.J. (2005). Brain white matter hyperintensities: Relative importance of vascular risk factors in nondemented elderly people. Radiology, 237(1): 251-257. https://doi.org/10.1148/radiol.2371041496
[24] van Sloten, T.T., Sedaghat, S., Carnethon, M.R., Launer, L.J., Stehouwer, C.D. (2020). Cerebral microvascular complications of type 2 diabetes: Stroke, cognitive dysfunction, and depression. The Lancet Diabetes & Endocrinology, 8(4): 325-336. https://doi.org/10.1016/S2213-8587(19)30405-X
[25] Mitra, J., Bourgeat, P., Fripp, J., Ghose, S., Rose, S., Salvado, O., Connelly, A., Campbell, B., Palmer, S., Sharma, G., Christensen, S., Carey, L. (2014). Lesion segmentation from multimodal MRI using random forest following ischemic stroke. NeuroImage, 98: 324-335. https://doi.org/10.1016/j.neuroimage.2014.04.056
[26] Schmidt, P., Gaser, C., Arsic, M., Buck, D., Förschler, A., Berthele, A., Hoshi, M., Ilg, R., Schmid, V.J., Zimmer, C., Hemmer, B., Mühlau, M. (2012). An automated tool for detection of FLAIR-hyperintense white-matter lesions in multiple sclerosis. Neuroimage, 59(4): 3774-3783. https://doi.org/10.1016/j.neuroimage.2011.11.032
[27] Schiffmann, R., van der Knaap, M.S. (2009). Invited article: An MRI-based approach to the diagnosis of white matter disorders. Neurology, 72(8): 750-759. https://doi.org/10.1212/01.wnl.0000343049.00540.c8
[28] Diniz, P.H.B., Valente, T.L.A., Diniz, J.O.B., Silva, A.C., Gattass, M., Ventura, N., Muniz, B.C., Gasparetto, E.L. (2018). Detection of white matter lesion regions in MRI using SLIC0 and convolutional neural network. Computer Methods and Programs in Biomedicine, 167: 49-63. https://doi.org/10.1016/j.cmpb.2018.04.011
[29] Lee, S., Viqar, F., Zimmerman, M.E., et al. (2016). White matter hyperintensities are a core feature of Alzheimer's disease: Evidence from the dominantly inherited Alzheimer network. Annals of Neurology, 79(6): 929-939. https://doi.org/10.1002/ana.24647
[30] Chabriat, H., Jouvent, E. (2020). Imaging of the aging brain and development of MRI signal abnormalities. Revue Neurologique, 176(9): 661-669. https://doi.org/10.1016/j.neurol.2019.12.009
[31] Lozano, R., Naghavi, M., Foreman, K., et al. (2012). Global and regional mortality from 235 causes of death for 20 age groups in 1990 and 2010: A systematic analysis for the Global Burden of Disease Study 2010. The Lancet, 380(9859): 2095-2128. https://doi.org/10.1016/S0140-6736(12)61728-0
[32] Smallwood, A., Oulhaj, A., Joachim, C., Christie, S., Sloan, C., Smith, A.D. Esiri, M. (2012). Cerebral subcortical small vessel disease and its relation to cognition in elderly subjects: A pathological study in the Oxford Project to Investigate Memory and Ageing (OPTIMA) cohort. Neuropathology and Applied Neurobiology, 38(4): 337-343. https://doi.org/10.1111/j.1365-2990.2011.01221.x
[33] Admiraal-Behloul, F., Van Den Heuvel, D., Olofsen, H., van Osch, M.J., van der Grond, J., van Buchem, M.A., Reiber, J.H. (2005). Fully automatic segmentation of white matter hyperintensities in MR images of the elderly. Neuroimage, 28(3): 607-617. https://doi.org/10.1016/j.neuroimage.2005.06.061
[34] Anbeek, P., Vincken, K.L., Van Osch, M.J., Bisschops, R.H., van der Grond, J. (2004). Probabilistic segmentation of white matter lesions in MR imaging. NeuroImage, 21(3): 1037-1044. https://doi.org/10.1016/j.neuroimage.2003.10.012
[35] Lao, Z., Shen, D., Liu, D., Jawad, A.F., Melhem, E.R., Launer, L.J., Bryan, R.N., Davatzikos, C. (2008). Computer-assisted segmentation of white matter lesions in 3D MR images using support vector machine. Academic Radiology, 15(3): 300-313. https://doi.org/10.1016/j.acra.2007.10.012
[36] Dyrby, T.B., Rostrup, E., Baaré, W.F., van Straaten, E.C., Barkhof, F., Vrenken, H., Ropele, S., Schmidt, R., Erkinjuntti, T., Wahlund, L.O., Pantoni, L., Inzitari, D., Paulson, O.B., Hansen, L.K., Waldemar, G., on behalf of the LADIS study group. (2008). Segmentation of age-related white matter changes in a clinical multi-center study. NeuroImage, 41(2): 335-345. https://doi.org/10.1016/j.neuroimage.2008.02.024
[37] Kawata, Y., Arimura, H., Yamashita, Y., Magome, T., Ohki, M., Toyofuku, F., Higashida, Y., Tsuchiya, K. (2010). Computer-aided evaluation method of white matter hyperintensities related to subcortical vascular dementia based on magnetic resonance imaging. Computerized Medical Imaging and Graphics, 34(5): 370-376. https://doi.org/10.1016/j.compmedimag.2009.12.014
[38] Klöppel, S., Abdulkadir, A., Hadjidemetriou, S., Issleib, S., Frings, L., Thanh, T.N., Mader, I., Teipel, S.J., Hüll, M., Ronneberger, O. (2011). A comparison of different automated methods for the detection of white matter lesions in MRI data. NeuroImage, 57(2): 416-422. https://doi.org/10.1016/j.neuroimage.2011.04.053
[39] Leite, M., Rittner, L., Appenzeller, S., Ruocco, H.H., Lotufo, R.A. (2015). Etiology-based classification of brain white matter hyperintensity on magnetic resonance imaging. Journal of Medical Imaging, 2(1): 014002. https://doi.org/10.1117/1.JMI.2.1.014002
[40] Griffanti, L., Zamboni, G., Khan, A., Li, L., Bonifacio, G., Sundaresan, V., Schulz, U.G., Kuker, W., Battaglini, M., Rothwell, P.M., Jenkinson, M. (2016). BIANCA (Brain Intensity AbNormality Classification Algorithm): A new tool for automated segmentation of white matter hyperintensities. Neuroimage, 141: 191-205. https://doi.org/10.1016/j.neuroimage.2016.07.018
[41] Dadar, M., Maranzano, J., Misquitta, K., Anor, C.J., Fonov, V.S., Tartaglia, M.C., Carmichael, O.T., Decarli, C., Collins, D.L., Alzheimer's Disease Neuroimaging Initiative. (2017). Performance comparison of 10 different classification techniques in segmenting white matter hyperintensities in aging. NeuroImage, 157: 233-249. https://doi.org/10.1016/j.neuroimage.2017.06.009
[42] Park, B., Lee, M.J., Lee, S., Cha, J., Chung, C.S., Kim, S.T., Park, H. (2018). DEWS (DEep White matter hyperintensity Segmentation framework): A fully automated pipeline for detecting small deep white matter hyperintensities in migraineurs. NeuroImage: Clinical, 18: 638-647. https://doi.org/10.1016/j.nicl.2018.02.033
[43] Jiang, J., Liu, T., Zhu, W., Koncz, R., Liu, H., Lee, T., Sachdev, P.S., Wen, W. (2018). UBO detector–A cluster-based, fully automated pipeline for extracting white matter hyperintensities. Neuroimage, 174: 539-549. https://doi.org/10.1016/j.neuroimage.2018.03.050
[44] Guerrero, R., Qin, C., Oktay, O., Bowles, C., Chen, L., Joules, R., Wolz, R., Valdés-Hernández, M.C., Dickie, D.A., Wardlaw, J., Rueckert, D. (2018). White matter hyperintensity and stroke lesion segmentation and differentiation using convolutional neural networks. NeuroImage: Clinical, 17: 918-934. https://doi.org/10.1016/j.nicl.2017.12.022
[45] Li, H., Jiang, G., Zhang, J., Wang, R., Wang, Z., Zheng, W.S., Menze, B. (2018). Fully convolutional network ensembles for white matter hyperintensities segmentation in MR images. NeuroImage, 183: 650-665. https://doi.org/10.1016/j.neuroimage.2018.07.005
[46] Maier, O., Menze, B.H., von der Gablentz, J., et al. (2017). ISLES 2015-A public evaluation benchmark for ischemic stroke lesion segmentation from multispectral MRI. Medical Image Analysis, 35: 250-269. https://doi.org/10.1016/j.media.2016.07.009
[47] Rachmadi, M.F., Valdes-Hernandez, M.d.C., Agan, M.L.F., Di Perri, C., Komura, T., The Alzheimer's Disease Neuroimaging Initiative. (2018). Segmentation of white matter hyperintensities using convolutional neural networks with global spatial information in routine clinical brain MRI with none or mild vascular pathology. Computerized Medical Imaging and Graphics, 66: 28-43. https://doi.org/10.1016/j.compmedimag.2018.02.002
[48] Hong, J., Park, B., Lee, M.J., Chung, C.S., Cha, J., Park, H. (2020). Two-step deep neural network for segmentation of deep white matter hyperintensities in migraineurs. Computer methods and programs in biomedicine, 183: 105065. https://doi.org/10.1016/j.cmpb.2019.105065
[49] Oh, K.T., Kim, D., Ye, B.S., Lee, S., Yun, M., Yoo, S.K. (2021). Segmentation of white matter hyperintensities on 18F-FDG PET/CT images with a generative adversarial network. European Journal of Nuclear Medicine and Molecular Imaging, 48(11): 3422-3431. https://doi.org/10.1007/s00259-021-05285-4
[50] Liang, L., Zhou, P., Lu, W., Guo, X., Ye, C., Lv, H., Wang, T., Ma, T. (2021). An anatomical knowledge-based MRI deep learning pipeline for white matter hyperintensity quantification associated with cognitive impairment. Computerized Medical Imaging and Graphics, 89: 101873. https://doi.org/10.1016/j.compmedimag.2021.101873
[51] Umapathy, L., Perez-Carrillo, G., Keerthivasan, M., Rosado-Toro, J., Altbach, M., Winegar, B., Weinkauf, C., Bilgin, A. (2021). A stacked generalization of 3D orthogonal deep learning convolutional neural networks for improved detection of white matter hyperintensities in 3D FLAIR images. American Journal of Neuroradiology, 42(4): 639-647. https://doi.org/10.3174/ajnr.A6970
[52] Chen, S., Gamechi, Z.S., Dubost, F., van Tulder, G., de Bruijne, M. (2022). An end-to-end approach to segmentation in medical images with CNN and posterior-CRF. Medical Image Analysis, 76: 102311. https://doi.org/10.1016/j.media.2021.102311
[53] Liu, S., Wu, X., He, S., Song, X., Shang, F., Zhao, X. (2020). Identification of white matter lesions in patients with acute ischemic lesions using U-net. Frontiers in Neurology, 11: 1008. https://doi.org/10.3389/fneur.2020.01008
[54] Mohammed, B.A., Senan, E.M., Rassem, T.H., Makbol, N.M., Alanazi, A.A., Al-Mekhlafi, Z.G., Almurayziq, T.S., Ghaleb, F.A. (2021). Multi-method analysis of medical records and MRI images for early diagnosis of dementia and Alzheimer’s disease based on deep learning and hybrid methods. Electronics, 10(22): 2860. https://doi.org/10.3390/electronics10222860
[55] Bangyal, W.H., Rehman, N.U., Nawaz, A., Nisar, K., Ibrahim, A., Ag, A., Shakir, R., Rawat, D.B. (2022). Constructing domain ontology for Alzheimer disease using deep learning based approach. Electronics, 11(12): 1890. https://doi.org/10.3390/electronics11121890
[56] Sharma, R., Sekhon, S., Cascella, M. (2021). White matter lesions. StatPearls [Internet].
[57] ISLES2015. ISLES Challenge 2015 Ischemic Stroke Lesion Segmentation Dataset. 2015. http://www.isles-challenge.org/ISLES2015/.
[58] Astrup, J., Siesjö, B.K., Symon, L. (1981). Thresholds in cerebral ischemia-the ischemic penumbra. Stroke, 12(6): 723-725. https://doi.org/10.1161/01.STR.12.6.723
[59] Kuijf, H.J., Biesbroek, J.M., De Bresser, J., Heinen, R., Andermatt, S., Bento, M., Berseth, M., Belyaev, M., Cardoso, M.J., Casamitjana, A. (2019). Standardized assessment of automatic segmentation of white matter hyperintensities and results of the WMH segmentation challenge. IEEE Transactions on Medical Imaging, 38(11): 2556-2568. https://doi.org/10.1109/TMI.2019.2905770
[60] WMH. MICCAI 2017 WMH Segmentation Challenge Dataset. 2017. https://wmh.isi.uu.nl/.
[61] Jung, A. (2019). Imgaug documentation. Readthedocs. io, Jun, 25.
[62] Ronneberger, O., Fischer, P., Brox, T. (2015). U-Net: Convolutional networks for biomedical image segmentation. In Navab, N., Hornegger, J., Wells, W., Frangi, A. (eds) Medical Image Computing and Computer-Assisted Intervention – MICCAI 2015. MICCAI 2015. Lecture Notes in Computer Science(), vol 9351. Springer, Cham. https://doi.org/10.1007/978-3-319-24574-4_28
[63] He, K., Gkioxari, G., Dollár, P., Girshick, R. (2017). Mask R-CNN. In 2017 IEEE International Conference on Computer Vision (ICCV), Venice, Italy, pp. 2980-2988. https://doi.org/10.1109/ICCV.2017.322
[64] Girshick, R., Donahue, J., Darrell, T., Malik, J. (2014). Rich feature hierarchies for accurate object detection and semantic segmentation. In Proceedings of the IEEE Conference on Computer Vision and Pattern Recognition, Columbus, OH, USA, pp. 580-587. https://doi.org/10.1109/CVPR.2014.81
[65] Girshick, R. (2015). Fast R-CNN. In 2015 IEEE International Conference on Computer Vision (ICCV), Santiago, Chile, pp. 1440-1448. https://doi.org/10.1109/ICCV.2015.169
[66] Ren, S., He, K., Girshick, R., Sun, J. (2015). Faster R-CNN: Towards real-time object detection with region proposal networks. Advances in Neural Information Processing Systems, 28.
[67] Abdulla, W. (2017). Mask R-CNN for object detection and instance segmentation on Keras and TensorFlow. https://github. com/matterport.
[68] Dice, L.R. (1945). Measures of the amount of ecologic association between species. Ecology, 26(3): 297-302. https://doi.org/10.2307/1932409
[69] Khezrpour, S., Seyedarabi, H., Razavi, S.N., Farhoudi, M. (2022). Automatic segmentation of the brain stroke lesions from MR flair scans using improved U-net framework. Biomedical Signal Processing and Control, 78: 103978. https://doi.org/10.1016/j.bspc.2022.103978
[70] Park, G., Hong, J., Duffy, B.A., Lee, J.M., Kim, H. (2021). White matter hyperintensities segmentation using the ensemble U-Net with multi-scale highlighting foregrounds. Neuroimage, 237: 118140. https://doi.org/10.1016/j.neuroimage.2021.118140
[71] Hou, B., Xu, X., Kang, G., Tang, Y., Hu, C. (2020). Hybrid attention densely connected ensemble framework for lesion segmentation from magnetic resonance images. IEEE Access, 8: 188564-188576. https://doi.org/10.1109/ACCESS.2020.3030913
[72] Liu, L., Chen, S., Zhu, X., Zhao, X.M., Wu, F.X., Wang, J. (2020). Deep convolutional neural network for accurate segmentation and quantification of white matter hyperintensities. Neurocomputing, 384: 231-242. https://doi.org/10.1016/j.neucom.2019.12.050
[73] Wilcoxon, F. (1992). Individual comparisons by ranking methods. Individual Comparisons by Ranking Methods. In Kotz, S., Johnson, N.L. (eds) Breakthroughs in Statistics. Springer Series in Statistics. Springer, New York, NY. https://doi.org/10.1007/978-1-4612-4380-9_16
[74] Wu, J., Zhang, Y., Wang, K., Tang, X. (2019). Skip connection U-Net for white matter hyperintensities segmentation from MRI. IEEE Access, 7: 155194-155202. https://doi.org/10.1109/ACCESS.2019.2948476
[75] Rathore, S., Niazi, T., Iftikhar, M.A., Singh, A., Rathore, B., Bilello, M., Chaddad, A. (2020). Multimodal ensemble-based segmentation of white matter lesions and analysis of their differential characteristics across major brain regions. Applied Sciences, 10(6): 1903. https://doi.org/10.3390/app10061903
[76] Lee, A.R., Woo, I., Kang, D.W., Jung, S.C., Lee, H., Kim, N. (2020). Fully automated segmentation on brain ischemic and white matter hyperintensities lesions using semantic segmentation networks with squeeze-and-excitation blocks in MRI. Informatics in Medicine Unlocked, 21: 100440. https://doi.org/10.1016/j.imu.2020.100440
[77] Zhou, P., Liang, L., Guo, X., Lv, H., Wang, T., Ma, T. (2020). U-net combined with CRF and anatomical based spatial features to segment white matter hyperintensities. In 2020 42nd Annual International Conference of the IEEE Engineering in Medicine & Biology Society (EMBC), Montreal, QC, Canada, pp. 1754-1757. https://doi.org/10.1109/EMBC44109.2020.9175377
[78] Li, X., Zhao, Y., Jiang, J., Cheng, J., Zhu, W., Wu, Z., Jing, J., Zhang, Z., Wen, W., Sachdev, P.S. (2022). White matter hyperintensities segmentation using an ensemble of neural networks. Human Brain Mapping, 43(3): 929-939. https://doi.org/10.1002/hbm.25695
[79] Clèrigues, A., Valverde, S., Bernal, J., Freixenet, J., Oliver, A., Lladó, X. (2020). Acute and sub-acute stroke lesion segmentation from multimodal MRI. Computer Methods and Programs in Biomedicine, 194: 105521. https://doi.org/10.1016/j.cmpb.2020.105521
[80] Karthik, R., Menaka, R., Hariharan, M., Won, D. (2021). Ischemic lesion segmentation using ensemble of multi-scale region aligned CNN, Computer Methods and Programs in Biomedicine, 200: 105831. https://doi.org/10.1016/j.cmpb.2020.105831
[81] Vupputuri, A., Gupta, A., Ghosh, N. (2021). MCA-DN: Multi-path convolution leveraged attention deep network for salvageable tissue detection in ischemic stroke from multi-parametric MRI. Computers in Biology and Medicine, 136: 104724. https://doi.org/10.1016/j.compbiomed.2021.104724
[82] Liu, L., Kurgan, L., Wu, F.X., Wang, J. (2020). Attention convolutional neural network for accurate segmentation and quantification of lesions in ischemic stroke disease. Medical Image Analysis, 65: 101791. https://doi.org/10.1016/j.media.2020.101791
[83] Wang, J., Wang, S., Liang, W. (2022). METrans: Multi-encoder transformer for ischemic stroke segmentation. Electronics Letters, 58(9): 340-342. https://doi.org/10.1049/ell2.12444
[84] Rajinikanth, V., Aslam, S.M., Kadry, S. (2021). Deep learning framework to detect ischemic stroke lesion in brain MRI slices of flair/DW/T1 modalities. Symmetry, 13(11): 2080. https://doi.org/10.3390/sym13112080
[85] Manjón, J.V., Coupé, P., Raniga, P., Xia, Y., Desmond, P., Fripp, J., Salvado, O. (2018). MRI white matter lesion segmentation using an ensemble of neural networks and overcomplete patch-based voting. Computerized Medical Imaging and Graphics, 69: 43-51. https://doi.org/10.1016/j.compmedimag.2018.05.001
[86] Uçar, G., Dandıl, E. (2022). Automatic detection of white matter hyperintensities via mask region-based convolutional neural networks using magnetic resonance images. In Deep Learning for Medical Applications with Unique Data, pp. 153-179. https://doi.org/10.1016/B978-0-12-824145-5.00006-X