Bhuvaneswari Sundaravadivelu*![]() | Karthikeyan Santhanakrishnan
| Karthikeyan Santhanakrishnan![]()
© 2023 IIETA. This article is published by IIETA and is licensed under the CC BY 4.0 license (http://creativecommons.org/licenses/by/4.0/).
OPEN ACCESS
The integration of machine learning models into artificial intelligence has precipitated significant advancements in medical science. Notably, various programs have equipped radiologists with valuable tools to aid in medical image processing. Breast cancer stands out as the most prevalent cancer among women globally. The automated detection and classification of lesions in mammograms remain critical challenges necessitating more accurate diagnosis and meticulous examination of concerning lesions. Mammography is a pivotal diagnostic procedure for early breast cancer detection, enabling individuals to identify changes in their breasts far before they are palpable. In the relentless quest to improve patient care and tackle the prevalent ailments of our time, diverse fields such as data mining and artificial intelligence are making substantial contributions to breast cancer analysis. A groundbreaking investigation is currently focused on developing an innovative image processing technique aimed at detecting and grading breast cancer using mammogram and MRI images. This research relies on a unique image segmentation method utilizing a newly devised algorithm, coined CABC (Comprising Fuzzy C-Means and Artificial Bee Colony optimization). This inventive algorithm synergistically combines the benefits of FCM (Fuzzy C-Means) clustering and the robustness of Artificial Bee Colony (ABC) optimization. To determine the cancer stage, a random forest classifier is used, thereby enhancing the precision of the evaluation. The results stemming from the application of the CABC algorithm have demonstrated an impressive accuracy rate of 89.17%, attesting to the effectiveness of the proposed methodology. To thoroughly assess its performance, a comparative analysis has been conducted, involving other methodologies such as k-Means, Context-Based Clustering, Random Forest, and FCM individually. This rigorous evaluation employs both confusion matrix parameters and decision parameters, conclusively validating the superior performance of the proposed method. Essentially, this study exemplifies the synergistic collaboration between sophisticated image processing techniques, advanced clustering algorithms, and machine learning classifiers in refining breast cancer detection and grading. The empirical evidence presented highlights the potential of the CABC algorithm as a trailblazing instrument in this essential area of medical research.
mammogram, breast cancer, Comprising Fuzzy C-Means and Artificial Bee Colony optimization, random forest, grading
Cancerous tumors originate from abnormal cell proliferation that infiltrates surrounding tissues within the human body. These tumors are classified into benign and malignant types, with an absence of tumors in the breast deemed as normal. Benign tumors consist of noncancerous cells that grow locally and lack the ability to spread through invasion. Conversely, malignant tumors comprise cancerous cells that show uncontrolled growth, disseminate throughout various body parts, and infiltrate neighboring tissues.
Breast cancer emerges as a prevalent disease affecting women globally, presenting a significant public health concern. The International Agency for Research on Cancer (IARC) under the World Health Organization (WHO) reported approximately 8.2 million cancer-related deaths in 2012, with this death toll projected to increase to 27 million by 2030. Therefore, prompt and accurate detection, early diagnosis, and proactive preventative measures are crucial prerequisites for reducing mortality rates among women [1].
Amid the escalating global demand for early breast cancer detection within screening centers and medical institutions, new research opportunities have surfaced. The World Health Organization emphasizes the feasibility of selecting optimal treatment when a disease is identified at an early stage [2]. Breast cancer is the most common malignancy among women, underscoring the importance of early detection for effective treatment. While histopathological imaging remains the established benchmark for diagnosing breast cancer [3], the crucial role of mammography in detecting breast cancer at its initial stages, before clinical symptoms manifest, is undeniable. Mammography screening is the only proven method to reduce breast cancer mortality. To mitigate the incidence of false-negative mammography results, biopsies are recommended for lesions with a malignancy probability exceeding 2 percent [4].
Breast Ultrasound (BUS), a cost-effective imaging modality in clinical practice, serves as a valuable tool for detecting breast tumors and irregularities during physical examinations [5]. The burgeoning interest in developing semi-automatic diagnostic methods, especially for diseases like cancer, has spurred the exploration of computer-aided diagnostic systems. Such systems have the potential to assist medical specialists in enhancing diagnostic accuracy and reinforcing decision-making processes. Radiologists often compare contralateral images, as minor asymmetries may indicate areas of concern even in predominantly symmetrical images. This principle underpins the use of asymmetry analysis in breast cancer research [6-8]. The methodology incorporates the multistage hybrid optimization algorithm and the Fuzzy-based artificial bee colony optimization as key references [9, 10].
The paper is organized as follows: Section II presents a literature survey, Section III introduces the proposed method, Section IV discusses results and analyses, and Section V concludes the paper, followed by references.
This section highlights some of the most significant state-of-the-art methods based on deep learning and machine learning that have been developed over the years for accurate classification of breast cancer using thermal images or mammography.
Implementing diagnostic techniques at the early stages of the disease can significantly improve patient treatment outcomes, given that breast cancer is one of the most challenging and deadly malignancies. Numerous algorithms have been developed for the detection of breast cancer, each addressing various challenges. In this section, several such techniques are examined.
Vu et al. [11] proposed two computational techniques, one for nuclei segmentation and the other for whole-slide tissue image categorization. These segmentation and classification algorithms were evaluated in the MICCAI 2017 Digital Pathology challenge. The segmentation algorithm achieved an accuracy score of 0.78, while the classification method attained an accuracy score of 0.81. These were the top scores in the challenge.
Khan et al. [12] proposed a technique that employs CNN architectures such as GoogLeNet, Visual Geometry Group Network (VGGNet), and Residual Networks (ResNet) to extract features from images. These features are then fed into a fully connected layer for average pooling classification of malignant and benign cells. The performance of the proposed framework is evaluated using standard benchmark datasets. In terms of identifying and classifying breast tumors in cytology images, the proposed method outperforms all known deep learning architectures.
Cahoon et al. [13] demonstrated that when only intensity is used as the distinguishing factor, both supervised and unsupervised segmentation methods in digital mammograms have increased misclassification rates. However, by incorporating additional parameters such as window means and standard deviations, methods like the k-nn algorithm can significantly reduce the number of mislabeled pixels in certain parts of the image.
Al-Yaseen et al. [14] introduced a novel breast cancer prediction model based on both the modified K-means and the support vector machine (SVM) algorithms. The newly developed model significantly outperforms the standalone SVM model in classification performance. The modified K-means method is portrayed as a technique for obtaining high-quality training datasets, where reduced training time can effectively enhance the overall performance of the employed SVM. The novel model achieved 96.996% and 98.067% accuracy levels when applying the 10-cross validation procedure, based on analytical findings collected from two experimental training datasets - WBC and WDBC.
Aswathy et al. [15] examined the efficacy of a segmentation algorithm for detecting breast cancer in a simulated context using a publicly available dataset, UCSB. Fuzzy C-means clustering, k-means clustering, and ACM were used to segment the data. K-means clustering provided the highest segmentation accuracy (93%) among all methods. Clustering algorithms using K-means performed better across other performance metrics. The automated classification of breast cancer images using an SVM model with GLCM properties was 91.1% accurate. The proposed SVM classification technique in this paper also provides excellent sensitivity.
Patel et al. [16] adapted the k-means clustering technique for breast image segmentation to detect microcalcifications and developed a computer-based decision system for early identification of breast cancer. The computer-aided decision system was designed to detect microcalcifications in mammography images. The system is capable of identifying microcalcifications by visually inspecting digitized mammograms. Feature selection is based on the quantity, color, and shape of objects in the image. The number of Bins values, the number of Classes, and the sizes of the objects are considered relevant features for image retrieval. The detection accuracy was measured and compared to previous studies, revealing that the accuracy improves when the K-means method is used adaptively.
Sayed et al. [17] described a strategy for automated computer-aided diagnostics that employs four swarming approaches. The system was used to examine the capability and accuracy of a thermography breast cancer imaging application. According to the test results, the SVM-linear kernel function is the best, delivering the highest accuracy rate across all swarming approaches.
Sasikala et al. [18] improved the diagnostic performance for breast cancer by combining textural data from ultrasound elastographic and echographic images with Particle Swarm Optimization (PSO). The mean classification accuracy of the Optimal Path Forest Classifier is used as the objective function in PSO. Seven performance metrics were developed using GLCM, GLDM, LAWs, and LBP texture features in conjunction with an SVM classifier to evaluate the effectiveness of the proposed method.
Sharma et al. [19] provided a comparative analysis of various machine learning algorithms for breast cancer screening. The Wisconsin Diagnosis Breast Cancer dataset was used to compare the performance of machine learning algorithms with other methods. It was found that each algorithm achieved an accuracy rate of over 94% in determining whether a tumor was benign or malignant.
Aroef et al. [20] used the Boruta feature selection method in their study to discover the most significant features for constructing a machine learning model. Furthermore, the machine learning models RF and SVM were used, achieving maximum accuracies of 90% and 95%, respectively. According to the results, SVM outperforms the random forest in terms of accuracy.
Singh et al. [21] proposed a powerful automated method based on a contextual information-aware conditional generative adversarial learning framework for tumor segmentation in breast ultrasound (BUS) images. They employed atrous convolution (AC) to handle a broad range of tumor sizes and shapes by capturing spatial and scale information (i.e., position and size of tumors). Additionally, they proposed the use of channel attention and channel weighting (CAW) techniques to emphasize tumor-relevant features (without additional supervision) and to lessen the impact of artifacts. To finally capture the local context information generated from the region surrounding the tumors, they incorporated the structural similarity index metric (SSIM) and L1-norm in the loss function of the adversarial learning framework. From the survey, it was concluded that the CNN method sometimes outperforms all known deep learning architectures and that the SVM-linear kernel function is the best, delivering the highest accuracy rate in all of the swarming approaches.
This method proposes a novel method for segmentation with CABC algorithm for lesion segmentation on breast medical images following segmentation GLCM features are extracted from the segmented images then classified with Random forest classifier for malignant and benign classification.
Figure 1. Block diagram of the proposed method
Figure 1 represents the block diagram of the proposed method. The input data of 260 patients are used to investigate the breast tumor. After input data are used for the image reading and scaling, denoising, segmentation, and morphological steps are all handled by the preprocessing technique (smoothing edges). The CABC based segmentation method is the combination of FCM and Artificial bee colony (ABC) optimization. The CABC based segmentation method is used to segment the processed images for further process. The grey level co-occurrence matrix (GLCM) [5] is used to recover various grey level texture properties. And lastly Random Forest Classification is used to get the finalized result.
3.1 Input data
3.1.1 Patients
A total of 260 patients with and without solid breast tumors were investigated, all of them were female and aged 38 to 65. From needle aspiration/excision biopsy and surgical removal, all patients had histopathological verified diagnoses. Images are acquired in jpg format mostly in RGB components and were converted to gray while processing. Totally 520 images (367- cancer affected images and 153 normal images) and were used among those 400 (280 cancer affected and 120 normal ) images were used for training and 120 (87 cancer affected image and 33 normal images) for testing.
3.1.2 Magnetic resonance imaging
The setup uses a 1.5 T MRI equipment with a specialized surface coil to simultaneously image both breasts throughout the procedure. The patients were in a prone position, on their backs, laying on a table. Short TI inversion recovery STIR sequence was used to obtain transverse images with a repetition rate of TR= 5600 ms, echo time TE= 60ms, flip angle FA= 90 deg, inversion time TI= 150ms, matrix size of 258256 pixels, and slice thickness of 4 mm, and the same sequence was used to obtain transverse images. This was followed by creating a 3-D dynamic T1 weighted gradient echo sequence with a matrix size of 256256 pixels and an effective slice thickness of 4 mm for a quick low angle shot. Figure 2 shows the comparison of cancer affected and normal breast image captured using MRI scan.
Figure 2. MRI image of cancer affected and normal breast
3.2 Preprocessing
Because digital pictures include noise and may lack proper contrast, image augmentation and preprocessing are critical stages. Features extraction and image analysis may be affected by the quality of image preprocessing. Similar to normalizing data, preprocessing is a typical step in feature descriptor techniques. To avoid issues caused by colour inconsistencies, grayscale preprocessing is required.
The image reading and scaling, denoising, segmentation, and morphological steps are all handled by the preprocessing technique (smoothing edges). The ROI refers to the procedure of processing only a small portion of an image while leaving the rest of the image alone. The ROI is defined by the provided limits of a picture of an item or a sketch. To detect nucleus cells using an object perimeter gradient, a local adaptive thresholding strategy is combined with an active contour model. To enhance nuclei segmentation convergence, the model has better initialization and works within a confined area. When nucleus detection is employed, this approach generates expensive training data and a deep learning model.
3.3 CABC based segmentation
The CABC based segmentation method is the combination of FCM and Artificial bee colony (ABC) optimization. The segmentation method is described below.
3.3.1 FCM
FCM has been used and demonstrated to be effective for image segmentation since it retains more information than hard segmentation approaches [22, 23].
The clustering algorithm Fuzzy C-means (FCM) allows a single piece of data to belong to two or more clusters. For a decent classification, the objective function must be reduced [24, 25]. Nominal solutions are the stationary points with the least squared error of the clustering criterion 'J' in equation (1).
Step 1: Calculate the number of clusters as well as their Centre.
Step 2: Eq. (1) can be used to determine how far off each data point in the image is from the cluster Centre.
$j_m=\sum_{i=1}^k \sum_{i=1}^c U_{i j}|| x_i-c_j \|^2$ (1)
where, 1≤m≤infinite, where 'm' is any real number higher than one, is the degree of membership in the cluster 'j' is the dimension measured data.
Step 3: Create an image histogram.
Step 4: Determine the histogram's mean and local maxima.
Step 5: Look for peaks that are higher than the mean of the local maxima.
$F(i, j)=1-T(i, j)$ (2)
Step 6: Calculate the entropy of each band, using EnT for T, EnI for I, and EnF for F.
Step 7: To assess the NS image for T, I, and F, compute the Entropy EnNS, where EnNS=EnT +EnI +EnF.
3.3.2 ABC
Artificial bee colony optimization algorithm was developed based on honey bee foraging behavior. In the wild, all bees work together to produce more honey for the colony. Honey output is increased by three varieties of bees used by ABC. Whenever a new food source is discovered, bees use their memory to update their knowledge of the surroundings [26-28].
On the other hand, observer bees have no prior recollection and must look for beneficial sources. To acquire credible source information, employed bees' experience is utilized. The bees discard the source when it is depleted, and employed bees become scout bees [9].
The process begins by determining the number of Np food sources. It is a D-dimensional vector with the parameter values to be optimized, which are spread out evenly between the lower and upper initial parameter boundaries, respectively, for each food source [10, 29].
$x (b, a)=x b_{ {low }}+{rand}(0,1) *\left(x b_{ {high }}-x b_{ {low }}\right)$ (3)
where, b=1, 2, .., D and a=1, 2, ..., Np and x(b, a) is the ath individual's bth parameter.
Steps involved in ABC algorithm [9] is given below:
1. Configure the control parameters.
2. Set up the food sources.
3. Assess using the objective function.
4. Repeat until the maximum number of iterations is reached.
5. Utilized bee phase for food supply exploitation.
6. The onlooker bee looks for profitable sources.
7. Scout bee phase for randomly exploring for food sources.
8. Refresh the best memory locations.
9. Stop at step nine (max. iterations reach).
3.3.3 Proposed algorithm
The CABC method we suggest combines the FCM and ABC methods to produce a new algorithm with significantly improved segmentation performance.
Proposed Algorithm
1. Read input image (I).
2. Matrix to vector conversion (Tn,Zi).
3. Pre-clustering with random center points (C0 and C1).
4. Update clusters and setting seed point for next level ABC (CC0 and CC1).
5. Generate population, location and speed.
6. Particle’s (cluster) best value evaluation and Gbest declaration.
7. Modify the particle position.
8. Improved segmentation result.
The disadvantage of FCM clustering is overcome by the suggested method by updating the centroid after each iteration until the centroids are constant. Optimizing the clusters produced by the ABC method, as well. Figure 3 depicts the architecture of the proposed methodology.
Figure 3. Architecture of the proposed method
3.4 Feature extraction
An efficient way to reduce dimensionality is to use feature extraction techniques. This strategy is useful when dealing with large images. For quantitative evaluation of tissue and organ function, it is vital to obtain the necessary information to determine cell and tissue architecture. By combining morphological, tactual, co-localization, and geographically related elements, it is feasible to measure differences in cell and tissue structure. Everything from the shape of an object to its colour is a local or global quality. Global and local characteristics are employed for picture retrieval, categorization, and detection of blobs and corners.
During this stage, the grey level co-occurrence matrix (GLCM) is used to recover various grey level texture properties. In the sense that it collects pixel information from pixel pairs, GLCM is akin to second order statistics. The GLCM approach shows how the intensity of pixel pairs in an image change over time. The GLCM matrix is constructed in d intervals separated by 1 degree and at different angles. Numerous metrics, including as entropy, energy, contrast, and correlation, are included in the GLCM features. The formulae mentioned in Table 1 can be used to calculate these measurements.
Table 1. Some Intensity based statistical features
|
Entropy |
$\sum_{i=1}^{N_g} P_{(i)} \log _2\left(P_{(i)}+\varepsilon\right), \varepsilon$ |
(4) |
|
Standard deviation |
$\sqrt{\frac{1}{N_p} \sum_{i=1}^{N_p}\left(X_{(i)}-\bar{X}\right)^2}$ |
(5) |
|
Mean Deviation |
$\frac{1}{N} \sum_{i=1}^{N_p}\left|X_{(i)}-\bar{X}\right|$ |
(6) |
|
Skewness |
$\frac{\frac{1}{N_p} \sum_{i=1}^{N_p}\left(X_{(i)}-\bar{X}\right)^3}{\left(\sqrt{\frac{1}{N_p} \sum_{i=1}^{N_p}\left(X_{(i)}-\bar{X}\right)^2}\right)^3}$ |
(7) |
|
Kurtosis |
$\frac{\frac{1}{N_p} \sum_{i=1}^{N_p}\left(X_{(i)}-\bar{X}\right)^4}{\left(\frac{1}{N_p} \sum_{i=1}^{N_p}\left(X_{(i)}-\bar{X}\right)^2\right)^2}$ |
(8) |
3.5 Random forest classification
Random forests, also known as random decision forests, generate a huge number of trees that produce results using ensemble learning approaches for classification and regression. The properties it employs to construct such trees are bagging and feature randomness. The random forest outperforms the decision tree in that it does not over fit the data. It is a collection of numerous decision trees that use bootstrapping and random feature selection. Random forest is appropriate for our investigation since it works well with massive datasets.
${Gain}(t, x)=E(t)-E(t, x)$ (9)
Random forest is a classifier made up of classification trees {T(x,y), j=1, .., 1} where Vi is a vector of equally distributed tree votes that are dispersed independently at the input. The accuracy of the decision tree is more exact and steady. The importance of the tree correlation is increased by the random forest's superior accuracy performance [30]. The risk of overfitting is decreased, and the error and converge into some value is generalized, by building a lot of trees into a random forest [20, 31].
The most likely or greatest posterior class that addresses the optimization problem is the Random Forest, which presupposes that the characteristics in a dataset are mutually independent. In actuality, the independence assumption is frequently broken, although Random forest classifier continues to outperform under this unrealistic assumption.
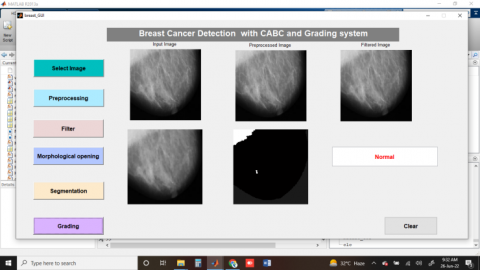
The Figures 4, 5 and 6 show result of breast image analysis for normal, Grade1 cancer and Grade3 cancer detection, which performs preprocessing for enhancement of base image followed by image filtering with Gabor filter that improves features extraction. Then clustered with proposed segmentation algorithm finally grading with Random forest technology.
Figure 4. Detection of normal breast image
Figure 5. Detection of cancer affected breast with Grade1
Figure 6. Detection of cancer affected breast with Grade3
Table 2. Confusion matrix of classification with FCM, ABC and Proposed method (CABC)
|
Algorithm |
True Positive |
False Negative |
True Negative |
False Positive |
|
K-Means |
60 |
27 |
18 |
15 |
|
Watershed |
66 |
21 |
22 |
11 |
|
Context Based |
65 |
22 |
19 |
14 |
|
Random forest |
70 |
17 |
21 |
12 |
|
FCM |
74 |
13 |
24 |
9 |
|
CABC |
79 |
8 |
28 |
5 |
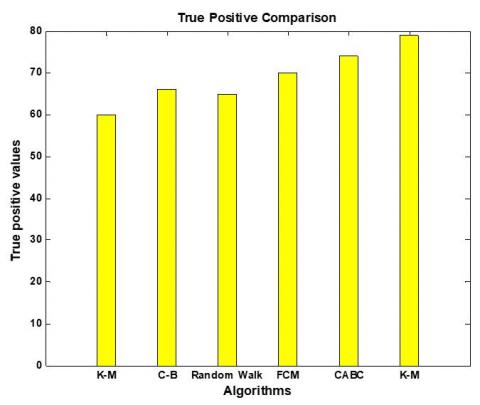
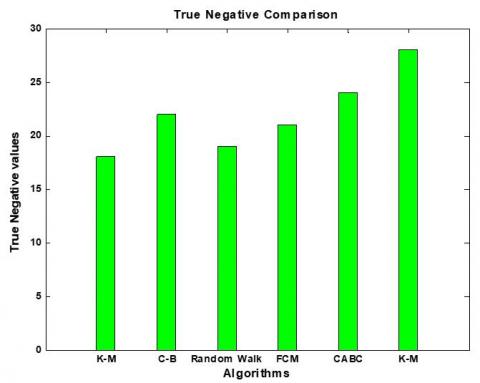
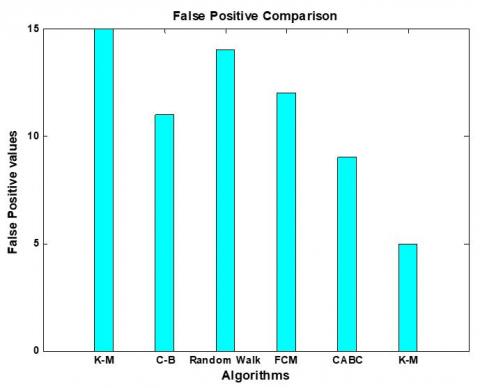
Figures 7-11 and Table 2 show the comparative analysis of confusion matrix parameters like True positive, True negative, False positive and False negative which shows that our proposed methodology performs better with higher true positive and true negative rate and lower false positive and false negative rate.
Figure 7. TPR comparison of K-Means, Context based, Random forest, FCM and Proposed method (CABC)
Figure 8. FNR comparison of K-Means, Context based, Random forest, FCM and Proposed method (CABC)
Figure 9. TNR Comparison of K-Means, Context based, Random forest, FCM and Proposed method (CABC)
Figure 10. FPR Comparison of K-Means, Context based, Random forest, FCM and Proposed method (CABC)
Figure 11. Confusion matrix of K-Means, Context based, Random forest, FCM and Proposed method (CABC)
Figure 12. Precision rate Comparison of K-Means, Context based, Random forest, FCM and Proposed method (CABC)
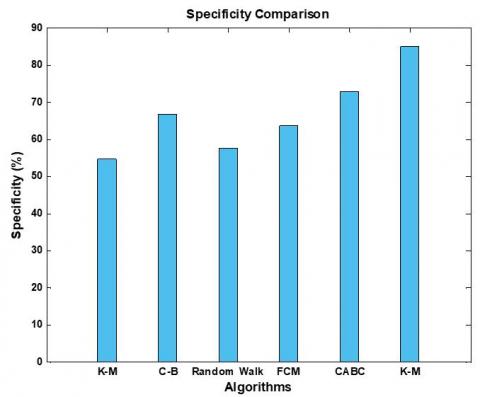
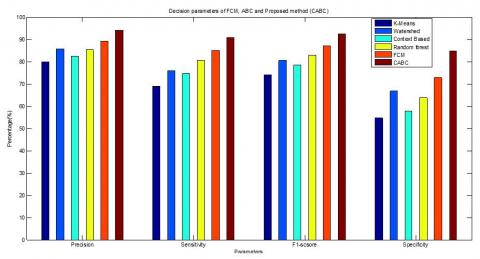
Figures 12 to 16 and Table 3 show the comparative analysis of Decision parameters like True precision, recall, accuracy, F-score and specificity which shows that our proposed methodology performs better with higher result on all parameters. The CABC shows the highest accuracy value of 94.05% which is higher when compared with other methods.
Table 3. Decision parameters of FCM, ABC and Proposed method (CABC)
|
Algorithm |
Precision (%) |
Sensitivity (%) |
F1 score (%) |
Specificity (%) |
|
K-Means |
80.00 |
68.97 |
74.07 |
54.55 |
|
Watershed |
85.71 |
75.86 |
80.49 |
66.67 |
|
Context Based |
82.28 |
74.71 |
78.31 |
57.58 |
|
Random forest |
85.37 |
80.46 |
82.84 |
63.64 |
|
FCM |
89.16 |
85.06 |
87.06 |
72.73 |
|
CABC |
94.05 |
90.80 |
92.40 |
84.85 |
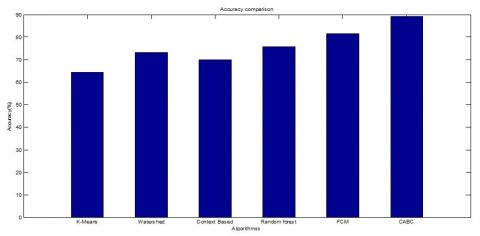
Table 4. Accuracy comparison of different segmentation algorithm
|
Algorithm |
Accuracy (%) |
|
K-Means [14] |
64.46 |
|
Watershed [7] |
73.33 |
|
Context Based [21] |
70.00 |
|
Random forest [30] |
75.83 |
|
FCM [24] |
81.67 |
|
CABC |
89.17 |
Figure 13. Sensitivity rate Comparison of K-Means, Context based, Random forest, FCM and Proposed method (CABC)
Figure 14. F1-score rate Comparison of K-Means, Context based, Random forest, FCM and Proposed method (CABC)
Figure 15. Specificity rate Comparison of K-Means, Context based, Random forest, FCM and Proposed method (CABC)
Figure 16. Decision parameters of FCM, ABC and Proposed method (CABC)
Figure 17 and Table 4 show accuracy comparison with different segmenting algorithm with random forest classifier. The CABC shows the highest accuracy value of 89.17% which is higher when compared with other methods. Comparing accuracy from five different segmenting algorithm k-Means, Context based, Random forest, FCM and CABC shows poor performance with K-Means and best performance with CABC while Context based, Random forest and FCM shows moderating performance with FCM as better among them.
Figure 17. Accuracy comparison of different segmentation algorithm
This work focuses on a novel image processing-based strategy for identifying and grading breast cancer using mammography and MRI data. Images were segmented using a unique CABC (Fuzzy C-Means Artificial bee colony (ABC) optimization) technique, which combines the advantages of Fuzzy C-means clustering, artificial bee colony optimization, and a random forest classifier for grading cancer stage. The suggested approach is compared against k-Means, Context-based clustering, Random forest, and FCM independently with confusion matrix parameters and decision parameters, and the new methodology outperforms them all. This study might be expanded to include PET and radio genomic imaging, which are used to diagnose breast cancer in its early stages.
This work is supported by Sathyabama Institute of science and Technology for providing us with various resources and unconditional support for carrying out this study.
[1] Hamed, G., Marey, M.A.E.R., Amin, S.E.S., Tolba, M.F. (2020). Deep learning in breast cancer detection and classification. In The International Conference on Artificial Intelligence and Computer Vision, pp. 322-333. https://doi.org/10.1007/978-3-030-44289-7_30
[2] Krithiga, R., Geetha, P. (2021). Breast cancer detection, segmentation and classification on histopathology images analysis: A systematic review. Archives of Computational Methods in Engineering, 28(4): 2607-2619. https://doi.org/10.1007/s11831-020-09470-w
[3] Wang, P., Hu, X., Li, Y., Liu, Q., Zhu, X. (2016). Automatic cell nuclei segmentation and classification of breast cancer histopathology images. Signal Processing, 122: 1-13. https://doi.org/10.1016/j.sigpro.2015.11.011
[4] Ilesanmi, A.E., Chaumrattanakul, U., Makhanov, S.S. (2021). Methods for the segmentation and classification of breast ultrasound images: A review. Journal of Ultrasound, 1-16. https://doi.org/10.1007/s40477-020-00557-5
[5] Yurttakal, A.H., Erbay, H., İkizceli, T., Karacavus, S., Çinarer, G. (2018). A comparative study on segmentation and classification in breast MRI imaging. IIOAB Journal, 9(5): 23-33.
[6] Qi, H., Head, J.F. (2001). Asymmetry analysis using automatic segmentation and classification for breast cancer detection in thermograms. In 2001 Conference Proceedings of the 23rd Annual International Conference of the IEEE Engineering in Medicine and Biology Society, pp. 2866-2869. https://doi.org/10.1109/IEMBS.2001.1017386
[7] Essafi, S., Doughri, R., M'hiri, S., Romdhane, K.B., Ghorbel, F. (2006). Segmentation and classification of breast cancer cells in histological images. In 2006 2nd International Conference on Information & Communication Technologies, pp. 1097-1102. https://doi.org/10.1109/ICTTA.2006.1684527
[8] Wismüller, A., Meyer-Bäse, A., Lange, O., Schlossbauer, T., Kallergi, M., Reiser, M., Leinsinger, G. (2006). Segmentation and classification of dynamic breast magnetic resonance image data. Journal of Electronic Imaging, 15(1): 013020. https://doi.org/10.1117/1.2178776
[9] Upadhyay, P., Chhabra, J.K. (2021). Multilevel thresholding based image segmentation using new multistage hybrid optimization algorithm. Journal of Ambient Intelligence and Humanized Computing, 12(1): 1081-1098. https://doi.org/10.1007/s12652-020-02143-3
[10] Bose, A., Mali, K. (2016). Fuzzy-based artificial bee colony optimization for gray image segmentation. Signal, Image and Video Processing, 10(6): 1089-1096. https://doi.org/10.1007/s11760-016-0863-z
[11] Vu, Q.D., Graham, S., Kurc, T., To, M.N.N., Shaban, M., Qaiser, T., Farahani, K. (2019). Methods for segmentation and classification of digital microscopy tissue images. Frontiers in Bioengineering and Biotechnology, 7: 53. https://doi.org/10.3389/fbioe.2019.00053
[12] Khan, S., Islam, N., Jan, Z., Din, I.U., Rodrigues, J.J.C. (2019). A novel deep learning based framework for the detection and classification of breast cancer using transfer learning. Pattern Recognition Letters, 125, 1-6. https://doi.org/10.1016/j.patrec.2019.03.022
[13] Cahoon, T.C., Sutton, M.A., Bezdek, J.C. (2000). Breast cancer detection using image processing techniques. In Ninth IEEE International Conference on Fuzzy Systems. FUZZ-IEEE 2000 (Cat. No. 00CH37063), pp. 973-976. https://doi.org/10.1109/FUZZY.2000.839171
[14] Al-Yaseen, W., Jehad, A., Abed, C.I., Idrees, A.K. (2021). The use of modified K-Means algorithm to enhance the performance of support vector machine in classifying breast cancer. International Journal of Intelligent Engineering & Systems, 14(2). https://doi.org/10.22266/ijies2021.0430.17
[15] Aswathy, M.A., Jagannath, M. (2020). Performance Analysis of segmentation algorithms for the detection of breast cancer. Procedia Computer Science, 167: 666-676. https://doi.org/10.1016/j.procs.2020.03.333
[16] Patel, B.C., Sinha, G.R. (2010). An adaptive K-means clustering algorithm for breast image segmentation. International Journal of Computer Applications, 10(4): 35-38. http://doi.org/10.5120/1467-1982
[17] Sayed, G.I., Soliman, M., Hassanien, A.E. (2016). Bio-inspired swarm techniques for thermogram breast cancer detection. In Medical Imaging in Clinical Applications, 487-506. https://doi.org/10.1007/978-3-319-33793-7_21
[18] Sasikala, S., Bharathi, M., Ezhilarasi, M., Senthil, S., Reddy, M.R. (2019). Particle swarm optimization based fusion of ultrasound echographic and elastographic texture features for improved breast cancer detection. Australasian Physical & Engineering Sciences in Medicine, 42(3): 677-688. https://doi.org/10.1007/s13246-019-00765-2
[19] Sharma, S., Aggarwal, A., Choudhury, T. (2018). Breast cancer detection using machine learning algorithms. In 2018 International Conference on Computational Techniques, Electronics and Mechanical Systems (CTEMS), pp. 114-118. https://doi.org/10.1109/CTEMS.2018.8769187
[20] Aroef, C., Rivan, Y., Rustam, Z. (2020). Comparing random forest and support vector machines for breast cancer classification. Telkomnika, 18(2): 815-821.
[21] Singh, V.K., Abdel-Nasser, M., Akram, F., Rashwan, H.A., Sarker, M.M.K., Pandey, N., Puig, D. (2020). Breast tumor segmentation in ultrasound images using contextual-information-aware deep adversarial learning framework. Expert Systems with Applications, 162: 113870. https://doi.org/10.3390/info8010016
[22] Tolias, Y.A., Panas, S.M. (1998). Image segmentation by a fuzzy clustering algorithm using adaptive spatially constrained membership functions. IEEE Transactions on Systems, Man, and Cybernetics-Part A: Systems and Humans, 28(3): 359-369. https://doi.org/10.1109/3468.668967
[23] Ahmed, M.N., Yamany, S.M., Mohamed, N., Farag, A. A., Moriarty, T. (2002). A modified fuzzy c-means algorithm for bias field estimation and segmentation of MRI data. IEEE Transactions on Medical Imaging, 21(3): 193-199. https://doi.org/10.1109/42.996338
[24] Singh, N., Mohapatra, A.G., Rath, B.N., Kanungo, G.K. (2012). GUI Based Automatic Breast Cancer Mass and Calcification Detection in Mammogram Images using K-means and Fuzzy C-means Methods. International Journal of Machine Learning and Computing, 2(1): 7.
[25] Singh, N., Mohapatra, A.G., Kanungo, G. (2011). Breast cancer mass detection in mammograms using K-means and fuzzy C-means clustering. International Journal of Computer Applications, 22(2): 15-21.
[26] Horng, M.H. (2011). Multilevel thresholding selection based on the artificial bee colony algorithm for image segmentation. Expert Systems with Applications, 38(11): 13785-13791. https://doi.org/10.1016/j.eswa.2011.04.180
[27] Karaboga, D. (2005). An idea based on honey bee swarm for numerical optimization. Technical report-tr06, Erciyes University, Engineering Faculty, Computer Engineering Department.
[28] Li, L., Sun, L., Guo, J., Han, C., Zhou, J., Li, S. (2017). A quick artificial bee colony algorithm for image thresholding. Information, 8(1): 16. https://doi.org/10.3390/info8010016
[29] Bose, A., Mali, K. (2014). A comparative study on image segmentation based on artificial bee colony optimization and FCM. IJARCSSE. Corpus ID: 18994009.
[30] Huljanah, M., Rustam, Z., Utama, S., Siswantining, T. (2019). Feature selection using random forest classifier for predicting prostate cancer. In IOP Conference Series: Materials Science and Engineering, 546(5): 052031. https://doi.org/10.1088/1757-899X/546/5/052031
[31] Rane, N., Sunny, J., Kanade, R., Devi, S. (2020). Breast cancer classification and prediction using machine learning. International Journal of Engineering Research & Technology, 9(2): 576-580. https://doi.org/10.17577/IJERTV9IS020280