Nupur Choudhury*![]() | Uzzal Sharma
| Uzzal Sharma![]()
© 2023 IIETA. This article is published by IIETA and is licensed under the CC BY 4.0 license (http://creativecommons.org/licenses/by/4.0/).
OPEN ACCESS
This study explores the uncharted territory of automated emotion recognition in the Assamese language, a broadly spoken but under-researched dialect in Northeast India, using speech and signal processing techniques. Using a unique combination of language-independent features, sophisticated supervised machine learning algorithms are employed to classify a spectrum of basic and derived emotions from spoken Assamese. An innovative fusion of non-personalized and personalized features is proposed for Speech Emotion Recognition (SER), wherein high-dimensional features are initially divided into subclasses using the Fuzzy C-means clustering algorithm. Subsequent implementation of multiple random forest classifiers facilitates the recognition and classification of emotions. Special attention is paid to certain emotions with overlapping transitions, which traditionally pose challenges to classification algorithms. Performance analysis is conducted using K-fold cross-validation, with the results validated against several key parameters and compared against baseline random forest algorithms. Remarkably, the proposed algorithm demonstrates superior performance, yielding an accuracy increase of approximately 4.26-4.50% compared to baseline models, suggesting effective classification without language-dependent features. Furthermore, this study contributes to the development of a practical application tool for SER. This tool holds potential utility for medical practitioners, enabling the accurate diagnosis of a patient's emotional state, thereby informing more effective treatment approaches. The implications of this research are vast, particularly for underexplored languages, and underline the importance of expanding emotion recognition studies to a wider linguistic landscape.
fuzzy C-means, n-Random Forest, emotion recognition, audio signal processing
The domain of Emotion Recognition (ER) from speech has seen a significant surge in research interest, evidenced by the 5,595 publications within the past five years as per the ScienceDirect database. However, the challenges inherent in Speech Emotion Recognition (SER) have kept it at the forefront of research in the realms of machine learning and Human-Computer Interaction (HCI) [1-3].
Speech, being the fundamental mode of human communication, encapsulates both linguistic (explicit) and paralinguistic (implicit) information, which can be harnessed to detect emotional dimensions. Paralinguistic information is often assessed via quantitative changes in linguistic patterns or speech mannerisms, while linguistic data relies on qualitative elements to discern linguistic patterns. Spectral features, such as fluctuations in pitch and intensity that carry no linguistic information, and voice quality are among these non-lexical elements [4].
The process of SER can be conceptually segmented into two sequential steps [5]: the selection and extraction of suitable features, followed by the choice of an effective classification technique. The extraction process aims to derive personalized and non-personalized features from the voice, which can then be utilized during the training and testing phases to differentiate among various emotions. Multiple feature types surface during speech, including linguistic features that help to define the speaker's intent and hyperlinguistic features that emerge from subtle alterations in the language itself, capturing the speaker's accent and associated social stratum [6].
Despite the wealth of research in SER using well-resourced languages like English, Mandarin, and German, there is a considerable research gap concerning less popular languages. Furthermore, the majority of the existing studies in SER focus primarily on personalized features [7], leaving non-personalized ones largely unexplored. Although different speakers may express the same emotion, their speeches' acoustic characteristics can vary significantly, leading to potential overlaps among acoustic features [8]. As a result, speaker-independent speech samples with non-personalized features are often employed in SER for more effective classification [9].
Machine learning, particularly deep learning, has contributed significantly to the field of SER [10]. The deep learning approach simplifies various parameters such as the ability to identify complex features and structures, handle unlabeled data, and extract lower-level features. However, each deep learning architecture has its limitations; for instance, Convolutional Neural Networks (CNNs) can learn from minor variations and distortions, potentially impacting accuracy and requiring larger storage capacity. Recurrent Neural Networks (RNNs) with Long Short-Term Memory (LSTM), on the other hand, can take longer to train and may face issues like the vanishing gradient problem and gradient explosion [11].
Table 1. Summary of the recent work (2019-2022) in the field of SER which includes the dataset, features, classifiers, emotions, accuracy and the future scope of research
|
Author |
Language Dependent/ Independent |
Features (Personalised/ Non-Personalised) and Classifiers Used |
Emotions |
Future Scope |
Accuracy |
|
Jin et al. [12] |
SAVEE and RAVDESS (Language Dependent) |
Personalised features Classifier used was CNN. |
Disgust, neutral, calm, sadness, anger and happiness |
Combination of ResNet and Google Net for building multiscale depth convolution Non-personalised features can be tested. |
SAVEE: 98.26% RAVDESS: 97.30% |
|
Atmaja et al. [13] |
MSP_IMPROV (Language Dependent) |
Non-personalised features Classifier used was MLP and LSTM. |
Basic and derived emotions |
Studying the acoustic features that correlate to the naturalness of speech may also include a balancing strategy to improve the model performance, as well as mapping continuous scores to ordinal labels. |
Prediction using the single task learning approach outperforms the multitask learning approach. |
|
Seo and Lee [14] |
IEMOCAP (Language Dependent) |
Personalised features Classifier used was MTC-SER model. |
Excitement, happiness, fear, frustration, anger, surprise,sadness and neutral |
Usage and application of the output of ASR to contextual information Comparison with other datasets would also be one of the important future works. |
70.0 ± 1.5% for arousal considering unweighted accuracy |
|
Guo et al. [15] |
IEMOCAP and Emo-Db (Language Dependent) |
Non-personalised features Classifier used: CNN |
Fear, disgust, happy, bored, neutral, sad and angry |
Variance, kurtosis and skewness could be explored further for representation at the utterance level. Time frequency analysis such as DWT and empirical mode distribution could also be used for the same. |
For Emo-Db: 94.02 (Weighted Accuracy) 93.66 (Unweighted Accuracy) For IEMOCAP: 57.58 (Weighted Accuracy) 58.07 (Unweighted Accuracy) |
|
Alnuaim et al. [16] |
BAVED, ANAD, SAVEE (Language Dependent) |
Personalised features Classifier used: 1D CNN and other basic classifiers like KNN, SVC, RBF Kernel, AdaBoost, Gaussian NB, Quadratic Discriminant Analysis |
Happy, angry, surprised, disgust, neutral,sad, fear |
Accuracy can be improved by adding variety to the datasets or including a greater number of utterances for the same. |
96.44% (ANAD), 83.33% (SAVEE) and 97.09% (BAVED) |
|
Li et al. [17] |
IEMOCAP and Emo-Db (Language Dependent) |
Personalised and non-personalised features Classifier used: BLSTM-DSA |
Happy, sad, neutral and angry |
Further research with multiple datasets are proposed. |
62.16% (Unweighted Frequency) 55.21% (Weighted Frequency) |
|
Praseetha and Joby [18] |
TESS (Language Dependent) |
Personalised and non-personalised features Classifier used was RNN with Gated Recurrent Unit (GRU). |
Sad, neutral, angry, happy and fear |
Work on improvement of accuracy |
Average accuracy of 93% |
|
Al Dujaili et al. [19] |
Berlin's German Database and SAVEE (Language Dependent) |
Personalised and non-personalised features Classifier used: SVM and KNN |
Sad, angry, happy, fear,disgust, neutral and surprise |
Further research with multiple datasets are proposed. |
German:87.85% SAVEE: 90.83% |
|
Agarwal and Om [20] |
RAVDESS, TESS and IIKGP-SEHSC (Language Dependent) |
Personalised and non-personalised features Classifier used: Optimized Deep Neural Network |
Surprise, angry, calm, disgust, neutral, fear, happy |
Fine tuning of the classifiers and experimenting with multiple datasets |
TESS: 97.85% RAVDESS: 97.14% IITKGP-SEHSC: 93.75% |
|
Parthasarathy and Busso [21] |
MSP-Podcast (Version 1.2), USC-IEMOCAP and MSP-IMPROV (Language Dependent) |
ComParE feature set |
Neutral, happy, sad, and angry (IEMOCAP) |
Improvement of the ladder network architectures for prediction of the valence scores |
The suggested method produces relative increases in concordance correlation coefficient (CCC) between 3.0% and 3.5% for within-corpus assessments and between 16.1% and 74.1% for cross-corpus evaluations when compared to the single task learning baselines. |
|
Zhu et al. [22] |
IEMOCAP (Language Dependent) |
CRNN (Convolutional Recurrent Neural Network), RNN and Bi-GRU |
Neutral, happy, sad, and angry |
Not mentioned |
Variable length input yields recognition results of 69.01% (WAR) and 65.43% (UAR). |
|
Atmaja et al. [23] |
IEMOCAP (Language Dependent) |
LSTM and Word embedding |
Neutral, sad, and angry |
Future study must devise a method to consistently achieve high accuracy in order to compare results with those of previous studies on speech emotion recognition. |
For the 3 models the accuracy was observed to be 68.83%, 69.13% and 75.49%. |
|
Jain et al. [24] |
LDC and UGA (Language Dependent) |
Personalised Classifier used: Support Vector Machine (SVM) using 2 different strategies: Gender Dependent Classification and One against All (OAA) |
Sadness, anger, fear and happiness |
To increase system accuracy, change the system by merging more feature values with MFCC and MEDC. |
Happy MFCC (99.64%) and LPCC (70.94%), Sad MFCC (83.33%) and LPCC (71.32%), Angry MFCC (91.66%) and LPCC (85.65%) and Fear MFCC (65.71%) and LPCC (64.59%) |
|
Kerkeni et al. [25] |
Berlin Database and Spanish Database (Language Dependent) |
Personalised and non Personalised Classifiers:Multivariate Linear Regression, RNN and SVM |
Anger, disgust, fear, happiness,boredom, surprise, neutral and sadness |
Combination of databases and fusion of features |
On the Spanish data base, 94% using an RNN classifier without speaker normalisation (SN) and feature selection (FS). When a speaker normalisation (SN) and a feature selection (FS) are applied to the features, all of the classifiers for the Berlin database attain an accuracy of 83%. |
|
Qayyum et al. [26] |
SAVEE (Language Dependent) |
Personalised and non Personalised Classifiers:Multivariate Linear Regression, RNN and SVM |
Anger, happy, fear, sad, disgust and surprise |
Combination of databases and fusion of features |
Accuracy of 83.61% as compared to conventional approaches |
|
Sun et al. [27] |
CASIA and Berlin Emo-DB (Language Dependent) |
Classifier: SVM and SVM with fisher feature selection |
Angry, happy, fear, neutral aurprise and sad |
Identify more effective feature selection strategies for selection of features |
Average recognition rate: 74.75% (baseline SVM), 83.75% (proposed approach) |
|
Tarantino et al. [28] |
IEMOCAP (Language Dependent) |
Transformer model is used with self attention mechanism. |
Anger, happiness, sad and neutral |
Combination of databases and fusion of features |
On the IEMOCAP dataset, the method along with self-attention exceeds the prior state of the art in terms of WA and UA. |
|
Raghu and Sadanandam [29] |
RAVDESS, IIITH IIITH-TEMD and DETL |
Non personalised features Classifier: SVM and MLP |
Happy, Sad, Anger, Fear and Neutral
|
Identifying the appropriate feature subset |
SVM 56.24% and MLP 74.47% for MFCC and Hybrid features gives 74.36% for SVM and 81.32% for MLP respectively. |
Considering the critical role of feature extraction in SER, the current work conducts experiments using both personalized and non-personalized features to improve outcomes. The fusion of these features has gained substantial attention in the SER domain for effective classification. However, as seen in Table 1, most existing works primarily focus on personalized features and widely spoken languages, leaving a significant research gap in the use of non-personalized features and lesser-known languages.
This study addresses these gaps by exploring SER in the context of the Assamese language, a low-resource language native to the state of Assam in India. The study develops a dialect-free dataset in Assamese for SER and investigates the use of optimized supervised machine learning for emotion classification. This work introduces a two-layer classification process, with Fuzzy C-means clustering in the first layer and multiple random forests in the second layer, to recognize seven different emotions.
The primary contributions of this work include: (1) the creation of a dialect-free dataset in the Assamese language for SER and examination of optimized supervised machine learning for emotion classification, (2) the investigation of the fusion of personalized and non-personalized features for feature construction and the performance analysis of the FCM algorithm, (3) the analysis of language-independent features in the Assamese language, and (4) the optimization of the existing baseline algorithm, such as Random Forest (RF), for performance enhancement.
This paper is organized as follows: Section 2 provides the background and related work in SER and machine learning's role in SER. Section 3 details the Assamese dataset used for the experimentation. Section 4 outlines the methodology for SER using the dataset. Section 5 presents the analysis and simulations. Section 6 describes the development of a Graphical User Interface (GUI) based application tool. Finally, Section 7 summarizes the research and discusses future prospects.
Automated SER has been a widely researched domain which is successful in gaining popularity in the recent years. Supervised machine learning algorithms such as Regression trees, Support Vector machines (SVM), Ensembled models like RF and Decision trees etc. [1, 12] plays a pivotal role in the classification task. This article works with the optimization of a popular supervised learning model, i.e., Random Forest using Fuzzy C Means clustering (FCM) algorithm for SER on an Assamese speech dataset.
Automated SER primarily involves two steps: extraction of emotion related features and selection of effective classifiers for classification. The first step involves wide domain of research in the recent past [30, 31] where investigation of different emotion related features in speech are done. Among these the global statistics over the lower-level descriptors such as durations, intensities, fundamental frequency (F0), Mel frequency cepstral Coefficient (MFCCs) [4] etc. has achieved significant impact in the entire domain of research.
Semantic labels and Prosody based information were used for SER by Chen et al. [32]. The short-term acoustic features like the MFCC, duration, pitch, energy etc. were extracted by using openSMILE toolkit [33] by Eyben et al. [34] where F0 features, Zero Crossing Rate (ZCR), MFCC, Root Mean Square signal frame energy also known as RMS energy, Harmonic Noise Ratio (HNR) etc. are used. This paper also dealt with the personalized as well as non-personalized features for emotional speech which could be used for SER. This step also focusses on the feature recognition where different features are analyzed and a hierarchical classifier is used for enhancing the performance of the classifier. Based on Wu and Liang [35] achieved the results by integrating weights along with semantic tags which was then tested by making use of a natural environment of sound. In another work Yüncü et al. [36] obtained identifiable degree of the categories of emotions by selecting the differences of feature sets which can also be termed as the confusion size for different types of emotions. The recognition of the emotional states was done in 2 layers of decision trees. Sheikhan et al. [37] worked with a fuzzy based neural SVM which addressed the problem of insufficient feature sets. The feature information can be utilized well and the dimension disaster problem could also be partially addressed by using ensemble learning approaches. Observing the work which has been carried out, it is indicative that previous researches have primarily focused on utilizing acoustic features for SER and have also reflected that extraction of features as a crucial step in automated SER.
Morrison et al. [38] used multiple classifiers and their results. These results were obtained after testing the model using 5 baseline classifiers and the results were verified by using a linear regression classifier. These results were then categorized into 3 different layers for the fuzzy logic integration after which the final outcome has been obtained. Hence today the concept of fusion of features, usage of ensemble methods as well as hierarchical classifiers has gained wide popularity in the field of SER.
Similarly, for the second step, classifiers are selected for SER which involves traditional and enhanced classifiers such as Gaussian Mixture Model [39], Hidden Markov Model [40], Support vector machine [41, 42] as well as Artificial Neural network [43, 44]. Ensemble classifiers are popularly used in which Albornoz and Milone [45] worked with an ensemble classifier that comprises of different baseline classifiers for multiple languages and were tested on the same. Breiman [30] worked with the implementation of RF to address the issue of insufficient studies on feature data having higher dimensions. This RF comprises of trees for classification where huge number of independent variables could be used. The RF could also serve as a machine learning algorithm for the fusion of feature sets at the decision level as well as feature sets at individual level [46, 47]. RF has also been implemented in the process of natural language recognition [48]. Anjana et al. [49] made use of SVM, K-Nearest Neighbour (KNN), decision tree, neural network etc. for the classification of the data. In another work Kondo and Taira [50] mentions that RF proves to have better performance than Logistic Regression, Artificial Neural networks (ANN) or SVM. Here it is seen that multiple classifiers as well as ensemble models like RF has been successful in yielding effective results due to its ability to handle higher dimensional features.
At present SER is highly impacted by the standardized methods like ensemble algorithms, combination of different algorithms as well as hierarchical classifiers. Considering all these concerns a suitable classifier is designed so that the performance could be enhanced in the most effective manner.
In this work, 7 different emotions which includes neutral, fear, happy, sad, angry, disgust and surprise is recognized by using an optimized RF classifier where both the personalized as well as non-personalized features are combined. Here, a corpus which comprises of prominent emotions in Assamese language is incorporated, given the low resource factor, size restrictions and insufficient major researches related to this domain. This fusion has an important impact in understanding the intentions of the emotions [41] of the speaker. Based on the information related to identification of age and gender the data can be categorized into various subclasses by using the FCM. Here depending on the characteristics of the speech data the clusters are formed by using the membership functions and the Euclidean distance. After this the optimized RF is implemented in which the decision tree as well as the Bootstrap method is used for the identification of the speech features. Finally, the establishment of the model is confirmed by generating the confusion matrix. In addition to it, classification is carried out in a separate manner for those emotions which are difficult to recognize using multiple classifications. The details of the work are represented in the next section.
The initial phase of the development of a speech processing algorithm is to generate or develop a dataset which is relevant to the application [51]. In India, Assamese is a language which is spoken in certain regions along the North Eastern part of the country. It has multiple dialects which are dependent on the various sectors the regions are divided into. The number of speakers of this language is growing in number across various geographical locations primarily due to migration. However, it has been noticed that the domain of SER is insufficiently explored in this language. Since its resources are limited, working with SER with this language would be an additional advantage in this sector and help the speakers and medical practitioners to go for early detection of any problems associated to it.
The experiments in this work are carried out using the simulated and elicited corpus in Assamese Language [52] to facilitate SER in this language. This dataset is constructed in reference to the Ryerson Audio-Visual Database of Emotional Speech and Song (RAVDESS) [12]. Here the emotional utterances are recorded from 25 different individuals (15 females and 10 males) where they spoke 5 different sentences based on the category of emotions in 2 different tonal intensities. These individuals belong to the community of Assamese origins studying at Assam Don Bosco University, Assam, India and speak dialect free language whose mean is almost 26yrs, standard deviation of 3.75 and age ranges for 20-33 years and belongs from Upper Assam, Lower Assam and the plain areas of Assam. There are 7 different emotional categories which includes neutral, happy, sad, fear, disgust, surprise and angry. Here a total of 1750 utterance were considered which comprised of both the higher intensity-based emotions for the same category as well as the lower one. For training the machine learning models, labelling of the data is necessary, hence each of the speech samples are labelled by an expert in this domain and accordingly the dataset was segregated. The feature sets for speech were extracted using the openSMILE framework [11] which included the basic features such as ZCR, HNR, MFCC and RMS energy as shown in Table 2. These features do not depend upon the natural environment of the speaker. They are categorized as personalized and non-personalized features where MFCC comprises of 8 spectral energy-based coefficients which are on the equal frequency bands and are dynamic in nature which are collected using 8 statistics. Rate of change is introduced in order to remove the influence of various speaker dependent parameters. The details of the construction of the database could be found in the study of Choudhury and Sharma [52].
Overall architecture for the proposed approach used for SER is depicted in Figure 1. It shows that the algorithm initially extracts the features related to emotions from voice using a standard toolkit, i.e., openSMILE [11]. After this FCM is applied through which the subclasses are created for various training sets. This is followed by using multiple RF for the identification of the emotions of the speech features which are selected, and the generated output Si (i=1…k) is considered as the affiliated emotional category.
4.1 Extraction of features
For the purpose of feature extraction in SER, non-personalized features of emotions are obtained which are dependent on a derivative that would supplement the traditional characteristics of personalized emotions. It is also used for realizing the universal and non-negotiable characteristics of emotions. openSMILE toolkit is used to compute the various feature sets based on the emotions. 12 basic features along with their 1st order derivatives are considered and extracted as the fundamental experimental features and are shown in the Table 2. The primary features include, ZCR, F0 (Fundamental Frequency), RMS energy, HNR and MFCC 1-8. The impact of different speakers is not addressed much in the fundamental features for which derivative features which could be considered as non-personalized features. Additionally, 8 statistical values in context to the fundamental features are calculated through which both the groups of features are obtained. ZCR [53] denotes that that the pattern of signal which is being considered is passed through a zero-level record. It is represented as
$Y_z=\frac{1}{2} \sum_{m=0}^{N-1}|\operatorname{sgn}[s(m)]-\operatorname{sgn}[s(m-1)]|$ (1)
where, s(m) is the speech signal and sgn[.] represents a function and is calculated [50] as the following:
$\operatorname{sgn}[x]=\left\{\begin{aligned} 1, & (x \geq 0) \\ -1, & (x<0)\end{aligned}\right.$ (2)
The various steps involved in the calculation of MFCC are as follows:
Step 1: Framing and Hamming window is applied for improving the information related to the voice of the speaker which can be referred to as pre-processing. After this the Fast Fourier Transformation (FFT) is applied in order to generate the spectrum.
Step 2: The result of Step 1. is squared and passed through a triangular filter followed by even arrangement of the center frequency in context to the Mel frequency scale. After this the central frequency derived from the band pass filter is further broken down into intervals of 150 Mel and having 300 Mel bandwidth. Hence in M no. of filters the filtering output frequency should be F(k) where k=1,2…M.
Table 2. Features considered for SER
|
Features |
12 Basic Features |
8 Statistical Values |
|
Personalized Features |
ZCR RMS energy HNR F0 MFCC 1-8 |
Min Average Max Standard deviation Skewness Kurtosis Range Maxpos |
|
Non- Personalized Features |
1st Order delta coefficients of 12 features |
Figure 1. Architecture of multiple-layer based fuzzy n-Random Forest for speech emotion recognition
Step 3: The bandpass filter output logarithm is calculated which was generated from Step 2. and then the calculation of the power log spectrum using the formula given below [54] is done in order to obtain the value of K-MFCC where K=8-12. The transformation is simplified as per the symmetry:
$\begin{gathered}O_n=\sum_{\mathrm{i}=1}^{\mathrm{I}} \log \mathrm{X}(\mathrm{i}) \cos [\pi(i-0.5) n / N] \\ n=1,2,3, \ldots N\end{gathered}$ (3)
where, i = order of the parameters of MFCC, N = no. of filters, On = filtered output.
However, it has been observed that the SER of a known individual is better with personalized information, but for unfamiliar speakers the rate of recognition is low which can be addressed using the derivatives of the basic parameters which caters to the non-personalized information-based SER.
4.2 Extraction of features using FCM
FCM is precisely used as a clustering algorithm for data. It is based on the Bootstrap method through which the training dataset T, is obtained, i.e., $T=\left[a_1, a_2, \ldots . a_n\right] G$ and $a_o=\left[a_o 1, a_o 2, \ldots a_o 412\right], o=1,2,3, \ldots . N$ where N is the sample data. FCM is based on iterative clustering which partitions p normalized data samples into c number of clusters through minimization of the following objective function [55, 56]:
$\operatorname{minJ}_m(X, C)=\sum_{i=1}^p \sum_{0=1}^N\left(\mu_{i_o}\right)^m T_{i_0}^2$
$T_{i_0}^2=\left\|a_0-C_i\right\|^2$
s.t. $\left\{\begin{array}{l}\sum_{i=1}^p \mu_{i_0}=1 \\ 0<\mu_{i_0}<1\end{array} i=1, \ldots, P, o=1, \ldots, N\right.$ (4)
Here $\mu_{i_0}$ is the oth sample membership value in the ith cluster, X is the fuzzy logic based partition matrix which consists of $\mu_{i_0}$, $C=c_1, c_2, \ldots c_P$ refers to the cluster centre matrix, P is the no. of clusters, m is the fuzzification exponential that has an impact on the regulatory effect of the degree of fuzziness and generally m = 2 [4, 57]. $T_{i_0}$ is the Euclidean distance between the oth sample and a0 and the ith cluster centre ci. The following equations are used to minimize the objective function Jm [58, 59]:
$\mu_{i_0}=\frac{1}{\sum_{f=1}^P\left(E_{i_0} / E_{f_0}\right)^{2 /(m-1)}}$ (5)
$\mathrm{C}_i=\frac{\sum_{o=1}^N\left(\mu_{i_0}\right)^m a_0}{\sum_{0=1}^N\left(\mu_{i_0}\right)^m}$ (6)
Here $E_{f_0}$ = Euclidean distance from a0 to cf. The algorithm begins to iterate after the initial cluster value is selected and will stop its iteration when $E_{f_0}<\varepsilon$ where $\mathcal{E}$ stands for the defined sensitivity threshold. Finally, the training set is divided into clusters by making use of FCM for the classification of the features.
4.3 SER using n-Random Forest
This ensemble algorithm comprises of a group of decision trees $t\left(s, \theta_n\right)$ where $n=1,2, \ldots k$ where $n=1,2, \ldots k$ where $\theta_n$ is subjected to be identical and independent random vectors and k is equal to the number of decision trees. s is a given characteristic of speech variable and based on it each of the decision trees would vote in order to determine the most optimal result for classification. The various steps for the generation of RF are as follows:
Step 1: By using the initial training data, it was considered that the number of decision trees to be used is k and bootstrap method is applied in order to select the k subset samples in a random manner without replacing the original data. Each of the subset would be considered as the training set in order to grow a tree. The trained model is not tested using the sample which constitutes of the k out of bag data.
Step 2: Let there be F features out of which f features are selected in a random manner such that (f<<F). Here nodes are split in an optimized manner using the f variables comprising of the optimized classification capabilities. Here the value of f does not get affected with the forest growth. The process is then repeated until the entire tree is completed.
Step 3: Each of the decision trees do not have any deletion or cutting until it grows to the maximum size.
The trees which are generated creates the RF classifier which is used for the classification of the test data of the speech utterance. Its output is determined based on the results generated by the decision trees where the maximum votes are taken into consideration for the generation of the final outcome. The decision-making process is as follows [54]:
$\mathrm{T}(\mathrm{s})=\operatorname{argmax} \sum_{i=1}^N F\left(t_i(s)=Z\right)$ (7)
Here T(s) is the output of the classifier, F(.) indicatory function, $t_i(s)$ = single model of decision tree, Z is the tag of the target that refers to the emotion types in this scenario. Gini coefficients are utilised for extracting the subsets used in training with the help of Bootstrapping method which reflects that the criterion for selection is inversely proportional to the size of the Gini coefficients. Considering the number of sample classes in a set T is N, the associated Gini coefficient can be defined as the following [60, 61]:
$\operatorname{Gini}(T)=\sum_{i=1}^N q_i\left(1-q_i\right)=1-\sum_{i=1}^N q_i^2$ (8)
The probability based on class i is defined using qi. If there are 2 categories it becomes relatively easier considering the probability as q, the formula is as follows [60, 61]:
$\operatorname{Gini}(T)=2 q(1-q)$ (9)
Considering Eqs. (8) and (9), the corresponding Gini index for n branches in a node is given by:
$\operatorname{Gini}_{\text {branch }}(T)=\frac{T_1}{T} \operatorname{Gini}\left(T_1\right)+\cdots+\frac{T_n}{T} \operatorname{Gini}\left(T_n\right)$ (10)
Here $T_n=n^{t h}$ subset in the set T. The dispersion degree of the nodes is reflected by the Gini index. Along with this the importance of each of the feature is also sorted using the same. The Gini index for a data belonging to a class is equal to 0.
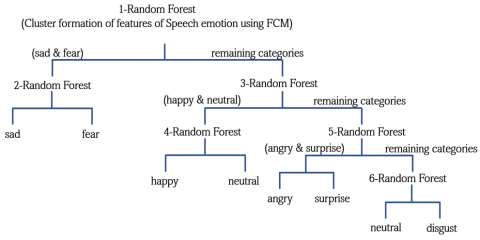
As shown in Figure 1, the process initially extracts the emotional features from speech using the OpenSMILE Toolkit as mentioned in section 4. After that FCM clustering is applied which enables the training sets to be segregated or divided into multiple sub classes after which RF is applied for identification of emotions of the features that are selected and labelled accordingly as shown in Figure 2. These features are then categorised for training using groups of decision trees which are directly fed into the RF model. The initial set of features are fed into the RF after which the emotional labels of sad and fear are affiliated and the remaining categories are once again segregated into the next level of training. During the second phase, happy and neutral were affiliated and likewise the remaining feature set is fed into trees which further classifies them into angry and surprise as well as neutral and disgust. The entire process of considering the number of decision trees and selection of the subsets using bootstrapping is discussed in Section 4.3, step (1). Followed by the random selection of the features and description of the decision-making process in step (2) and (3) respectively. Eq. (7) explains the parameters required for performing the decision-making process and the entropy values are measured by Eqs. (8), (9) and (10) where the dispersion of the degrees of the nodes are reflected. Figure 2 gives a pictorial representation of the entire process of creating subsets and affiliating the labels for multiple classes of emotions.
Figure 2. n-Random Forest for SER
4.4 Dual layer fuzzy n-Random Forest classification
The recognition of emotions is difficult to an extent due to certain factors which is addressed using the RF algorithm. Considering S states of emotions, every time 2 different categories are extracted which are difficult to recognize in comparison to the others. Finally, the conclusion that the n- random forest is required is given by the following equation [51]:
$R_{R F}=2\left|\frac{S}{2}\right|-1$, where $S=1,2, \ldots n$ (11)
Here R is the Number of random forests, S is the number of states of emotions. In this work the number of emotions which are considered is 7 and this approach aids in resolving the mutual interference of the signals and the performance are highly improved for any of these emotional categories. The proposed approach involves 4 different steps which are discussed as follows:
Step 1: Extraction of the data related to the feature by the pre-processing step utilizing the openSMILE framework.
Step 2: FCM is utilised to cluster the training data into P different subclasses considering the influence of information related to identification of the emotions.
Step 3: The RF classifier is trained where there is a total of 6 classifiers. One additional classifier (5+1) is given as the neutral emotion has very low transitions over other emotions and needs additional classification. In addition to it, the structure of n-Random Forest is based on the similarity and the experience among the various emotions. In comparison to the conventional and trademark databases, the accuracies related to fear and sad is comparatively low and are often confused in most of the cases. Hence these 2 emotions are considered and are trained in a separate manner in relation to the 5 other emotions. Hence the structure becomes something like this, classifier 1 identifies fear, sad and the other emotions, Classifier 2 identifies fear and sad, Classifier 3 would distinguish between happy, neutral and the other emotions, Classifier 4 would be distinguishing the happy and neutral, Classifier 5 takes care of anger and surprise and classifier 6 helps in distinguishing neutral and disgust. The entire structure is shown in Figure 2.
Step 4: The final step is to use the trained Dual Layer fuzzy n-Random Forest classification for the classification of 7 basic emotions and carry out with the integration of the P subclasses into the result of classification.
This section describes the environmental setup and the associated results and comparative analysis of the experiments carried out with the baseline RF model as well as the proposed approach.
5.1 Environmental setup
After the completion of the pre-processing step of the feature sets of the emotional speech, 4900 * 412 dimensional eigenvectors were received from a single male and a single female speaker. These eigenvectors would correspond to the labels (1-neutral, 2-happy, 3-sad, 4-surpirse, 5-disgust, 6-angry and 7-fear). In general, gender and age have certain impact on SER as there is a difference in the way in which emotions are expressed in men and women. Hence based on the gender i. e. male as well as female the dataset which is used in training is clustered by FCM into P=2 subsets or subclasses. Each of these subclasses comprises of feature data of which around 80% is used to train the RF model for emotion recognition. The other 20% of the data is used as the test data. The establishment of RF is facilitated by Bootstrapping which would be used to randomly sample the data. After this, subsets are formed comprising of 350 data samples where repetition of the same sample may take place. Along with this a decision tree is generated which would be trained using each of the subset of samples which leads to the formation of the RF model which would be able to classify 7 states of emotions. Since it has a low recognition rate n-Random Forest classifier is used for identifying certain emotions which are very cumbersome to distinguish.
5.2 Analysis and simulations
This section takes care of the verification of the effectiveness of the Speech Emotion Recognition using the baseline RF Model and the proposed model. The verification of the validity of the model is carried out by considering the amount of data which is used in simulation and according to it a 5-fold cross-validation approach is adopted for verification. Different data is used to carry out the experiments for each of the time. Finally, the cyclic variable k is used to represent the results of the output for 5 cycles. The following are the representations of the 5 different folds: (Here, Neu (Neutral), Ang (Anger), Fear (fear), Sur (Surprise), Hap (Happy), Dis (Disgust)).
In comparison to both the methods of the Speech Emotion Recognition using the Assamese dataset the results are shown in Table 5. The first method involves RF model where the confusion matrix is shown in Table 3. The results are achieved by the process of cross validation and the average rate of recognition is 84.7%. In the meantime, comparison of the current proposed approach is higher than the baseline RF with an increase of 2.01%-6.8% and the confusion matrix of the same is shown in Table 4. The results are obtained in a similar manner by the cross-validation method. Comparing the proposed method which includes dual layer fuzzy n-Random Forest approach to the baseline method, the results of the former is much better and is more stable which can be of great importance to the SER Domain. According to the Table 3 and Table 4, the average rate of recognition for each of the states in shown in the Table 5. The relative comparison of recognition of emotions for Baseline RF and Proposed algorithm is shown in Figure 3 where a categorical comparison is done for each category of emotions.
Table 3. Confusion matrix of the recognition rates of the baseline RF using the Assamese corpus (a) K=1 (b) K=2 (c) K=3 (d) K=4 (e) K=5
(a) K=1
|
Neu |
Ang |
Sad |
Fea |
Sur |
Hap |
Dis |
|
|
Neu |
0.91 |
0.01 |
0.02 |
0.03 |
0 |
0.03 |
0 |
|
Ang |
0.02 |
0.84 |
0 |
0.02 |
0.03 |
0.04 |
0.05 |
|
Sad |
0.06 |
0.02 |
0.67 |
0.12 |
0.06 |
0 |
0.07 |
|
Fea |
0.07 |
0 |
0.17 |
0.65 |
0.04 |
0.02 |
0.05 |
|
Sur |
0.02 |
0.06 |
0.02 |
0.07 |
0.77 |
0.01 |
0.05 |
|
Hap |
0.11 |
0.06 |
0.04 |
0.11 |
0.17 |
0.51 |
0 |
|
Dis |
0.03 |
0.08 |
0.07 |
0 |
0.11 |
0.09 |
0.62 |
(b) K=2
|
Neu |
Ang |
Sad |
Fea |
Sur |
Hap |
Dis |
|
|
Neu |
0.87 |
0 |
0.01 |
0.03 |
0.02 |
0.04 |
0.03 |
|
Ang |
0.03 |
0.82 |
0.02 |
0 |
0.01 |
0.05 |
0.07 |
|
Sad |
0.05 |
0.04 |
0.68 |
0.05 |
0 |
0.07 |
0.11 |
|
Fea |
0.05 |
0.11 |
0.13 |
0.64 |
0 |
0.02 |
0.05 |
|
Sur |
0.03 |
0.01 |
0 |
0.01 |
0.79 |
0.07 |
0.09 |
|
Hap |
0.16 |
0.15 |
0.03 |
0.04 |
0 |
0.54 |
0.08 |
|
Dis |
0.04 |
0.16 |
0.06 |
0.13 |
0 |
0.01 |
0.6 |
(c) K=3
|
Neu |
Ang |
Sad |
Fea |
Sur |
Hap |
Dis |
|
|
Neu |
0.93 |
0.01 |
0 |
0.02 |
0.01 |
0.03 |
0 |
|
Ang |
0.01 |
0.85 |
0.05 |
0 |
0.04 |
0.03 |
0.02 |
|
Sad |
0.03 |
0.02 |
0.69 |
0.03 |
0.06 |
0.09 |
0.08 |
|
Fea |
0 |
0.08 |
0.18 |
0.62 |
0 |
0.08 |
0.04 |
|
Sur |
0.06 |
0.08 |
0 |
0.01 |
0.76 |
0.07 |
0.02 |
|
Hap |
0.02 |
0 |
0.01 |
0.13 |
0.08 |
0.59 |
0.17 |
|
Dis |
0 |
0.14 |
0.13 |
0.03 |
0.04 |
0.05 |
0.61 |
(d) K=4
|
Neu |
Ang |
Sad |
Fea |
Sur |
Hap |
Dis |
|
|
Neu |
0.95 |
0 |
0.01 |
0 |
0.01 |
0.01 |
0.02 |
|
Ang |
0.03 |
0.81 |
0.06 |
0.05 |
0.03 |
0.02 |
0 |
|
Sad |
0.06 |
0.01 |
0.62 |
0.04 |
0.03 |
0.07 |
0.17 |
|
Fea |
0.01 |
0.14 |
0.12 |
0.65 |
0 |
0.05 |
0.03 |
|
Sur |
0.11 |
0.01 |
0 |
0.01 |
0.74 |
0.06 |
0.07 |
|
Hap |
0.09 |
0.07 |
0.04 |
0 |
0.11 |
0.57 |
0.12 |
|
Dis |
0.1 |
0.04 |
0.09 |
0.11 |
0.02 |
0 |
0.64 |
(e) K=5
|
Neu |
Ang |
Sad |
Fea |
Sur |
Hap |
Dis |
|
|
Neu |
0.89 |
0.02 |
0.01 |
0 |
0.02 |
0.01 |
0.05 |
|
Ang |
0.01 |
0.85 |
0.02 |
0 |
0.06 |
0.05 |
0.01 |
|
Sad |
0.04 |
0 |
0.67 |
0.07 |
0.09 |
0.01 |
0.12 |
|
Fea |
0.07 |
0.03 |
0.01 |
0.65 |
0 |
0.04 |
0.2 |
|
Sur |
0 |
0.02 |
0.04 |
0.08 |
0.77 |
0.07 |
0.02 |
|
Hap |
0.05 |
0.01 |
0 |
0.11 |
0.09 |
0.62 |
0.12 |
|
Dis |
0 |
0.06 |
0.08 |
0.05 |
0.09 |
0.05 |
0.67 |
Table 4. Confusion matrix of the recognition rates of the proposed algorithm using the Assamese corpus (a) K=1 (b) K=2 (c) K=3 (d) K=4 (e) K=5
(a) K=1
|
Neu |
Ang |
Sad |
Fea |
Sur |
Hap |
Dis |
|
|
Neu |
0.95 |
0.01 |
0.02 |
0 |
0.01 |
0.01 |
0 |
|
Ang |
0.04 |
0.85 |
0.03 |
0.02 |
0.03 |
0.02 |
0.01 |
|
Sad |
0 |
0.01 |
0.66 |
0.09 |
0.09 |
0.07 |
0.08 |
|
Fea |
0.02 |
0.02 |
0 |
0.68 |
0.12 |
0.16 |
0 |
|
Sur |
0.05 |
0.03 |
0.04 |
0.06 |
0.78 |
0 |
0.04 |
|
Hap |
0.11 |
0 |
0.15 |
0.07 |
0.08 |
0.54 |
0.05 |
|
Dis |
0.03 |
0.12 |
0.07 |
0.09 |
0.01 |
0.05 |
0.63 |
(b) K=2
|
Neu |
Ang |
Sad |
Fea |
Sur |
Hap |
Dis |
|
|
Neu |
0.93 |
0.03 |
0.01 |
0 |
0.02 |
0 |
0.01 |
|
Ang |
0.02 |
0.87 |
0.01 |
0.02 |
0 |
0.06 |
0.02 |
|
Sad |
0 |
0.01 |
0.68 |
0.07 |
0.03 |
0.04 |
0.17 |
|
Fea |
0.04 |
0.13 |
0.05 |
0.67 |
0 |
0.11 |
0 |
|
Sur |
0 |
0.04 |
0.05 |
0.01 |
0.77 |
0.11 |
0.02 |
|
Hap |
0.03 |
0 |
0.19 |
0.07 |
0.15 |
0.56 |
0 |
|
Dis |
0.04 |
0.07 |
0.03 |
0.08 |
0.17 |
0 |
0.61 |
(c) K=3
|
Neu |
Ang |
Sad |
Fea |
Sur |
Hap |
Dis |
|
|
Neu |
0.96 |
0 |
0.01 |
0.02 |
0 |
0.01 |
0 |
|
Ang |
0.02 |
0.88 |
0.03 |
0.04 |
0.02 |
0.01 |
0 |
|
Sad |
0.06 |
0.07 |
0.64 |
0.03 |
0 |
0.11 |
0.09 |
|
Fea |
0.02 |
0.07 |
0.09 |
0.69 |
0.07 |
0.05 |
0.01 |
|
Sur |
0.04 |
0.01 |
0.02 |
0.05 |
0.79 |
0.07 |
0.02 |
|
Hap |
0.05 |
0.04 |
0 |
0.09 |
0 |
0.58 |
0.24 |
|
Dis |
0.03 |
0.12 |
0.01 |
0.03 |
0.09 |
0.08 |
0.64 |
(d) K=4
|
Neu |
Ang |
Sad |
Fea |
Sur |
Hap |
Dis |
|
|
Neu |
0.94 |
0.01 |
0.02 |
0 |
0.01 |
0.02 |
0 |
|
Ang |
0.01 |
0.89 |
0.06 |
0.01 |
0 |
0.01 |
0.02 |
|
Sad |
0.04 |
0.13 |
0.62 |
0.01 |
0.08 |
0.12 |
0 |
|
Fea |
0 |
0.14 |
0.06 |
0.61 |
0.07 |
0.08 |
0.04 |
|
Sur |
0.04 |
0.16 |
0.02 |
0 |
0.76 |
0.01 |
0.01 |
|
Hap |
0.09 |
0.11 |
0 |
0.19 |
0.01 |
0.55 |
0.05 |
|
Dis |
0.09 |
0.08 |
0.03 |
0.02 |
0.06 |
0.07 |
0.65 |
(e) K=5
|
Neu |
Ang |
Sad |
Fea |
Sur |
Hap |
Dis |
|
|
Neu |
0.95 |
0.01 |
0 |
0.02 |
0.01 |
0 |
0.01 |
|
Ang |
0.02 |
0.88 |
0 |
0.02 |
0.01 |
0.04 |
0.03 |
|
Sad |
0.15 |
0.05 |
0.65 |
0.09 |
0 |
0.05 |
0.01 |
|
Fea |
0 |
0.08 |
0.03 |
0.64 |
0.03 |
0.08 |
0.14 |
|
Sur |
0.09 |
0.02 |
0.01 |
0 |
0.79 |
0 |
0.09 |
|
Hap |
0.15 |
0.08 |
0.05 |
0.05 |
0.09 |
0.57 |
0.01 |
|
Dis |
0.06 |
0.01 |
0.08 |
0.07 |
0.09 |
0.07 |
0.62 |
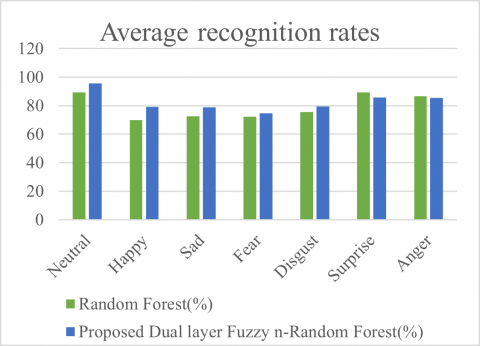
The proposed approach shows a better rate of recognition as compared to baseline RF model with minimum variance. The average rate of accuracy is lower in case of 2 emotions namely surprise and anger as there are similarities in between the speech related features which might lead to the misidentification and lower performance. Moreover, the current features which are used is not sufficient in order to distinguish certain emotions as the audio frequency was not very much prominent. Therefore, a state of confusion always arises in between the sadness and other emotions like disgust and fear as they are similar when they are expressed by the speech samples. The in-depth analysis of the experiments is done by obtaining the Specificity and the Kappa Coefficient Sensitivity of the proposed approach that is based on its confusion matrix which is represented in the Table 6. Table 6 data is also represented in a bar chart in Figure 4 to represent the efficiency of the proposed algorithm over the conventional Baseline RF.
Table 5. Average recognition rates of emotions with baseline RF and proposed algorithm
|
Emotions |
Random Forest (%) |
Proposed Dual layer Fuzzy n-Random Forest (%) |
|
Neutral |
89.34 |
95.66 |
|
Happy |
69.82 |
79.20 |
|
Sad |
72.45 |
78.75 |
|
Fear |
72.33 |
74.55 |
|
Disgust |
75.67 |
79.56 |
|
Surprise |
89.20 |
85.77 |
|
Anger |
86.50 |
85.45 |
Figure 3. Relative comparison of recognition of emotions for Baseline RF and Proposed algorithm
Table 6. Comparison of recognition of emotions with baseline RF and proposed algorithm
|
Sl. No. |
Baseline Random Forest |
Dual Layer Fuzzy n-Random Forest |
|
k=1 |
84.21% |
74.56% |
|
k=2 |
86.48% |
85.51% |
|
k=3 |
75.62% |
89.67% |
|
k=4 |
88.50% |
87.65% |
|
k=5 |
66.70% |
74.72% |
|
Kappa Coefficient |
0.66 |
0.78 |
|
Average ± std (%) |
81.45±2.89 |
81.73±1.45 |
|
Specificity |
0.872 |
0.938 |
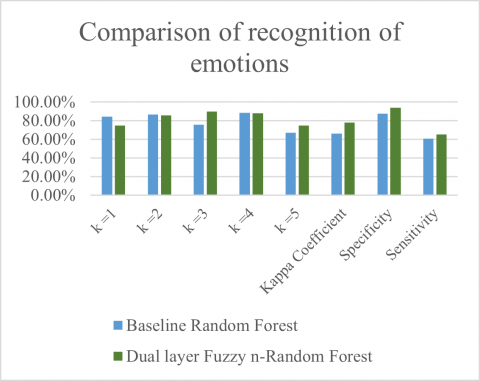
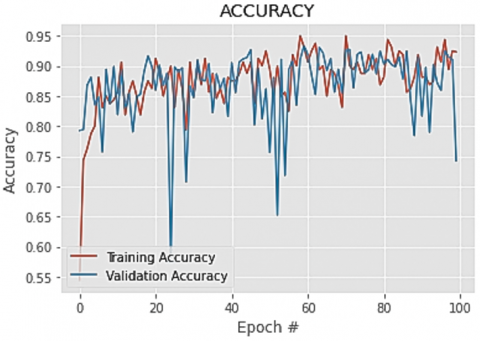
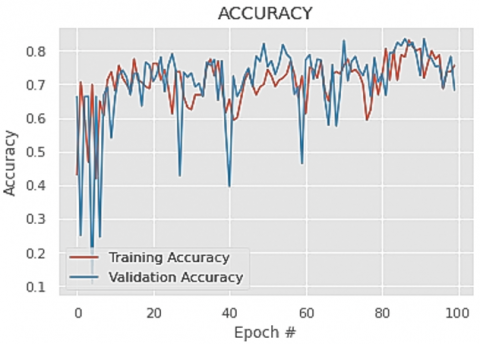
High degree consistent outcomes are shown by the mean values for specificity, Kappa Coefficient and sensitivity. As per the results of SER, the average recognition rates of the proposed approach are observed to be higher than the baseline RF. The standard errors are shown in Table 6 and for RF and the proposed approach the errors are mentioned as 2.89 and 1.45 respectively. In addition to it the proposed approach has greater advantages while handling higher dimensional data where the information of identification is incorporated due to which the gender as well as age is considered for the classification of data. The computation time for both the RF and the proposed method is 0.0182 s and 0.0021 s respectively and it has been seen that the proposed method takes more computation time but as compared to its performance the considered time is not the highest. The following graphs represent the training and validation accuracy as well as losses incurred during training and validation phase of the proposed algorithm and it was found that the proposed algorithm demonstrated high rate of accuracy as compared to baseline RF in terms of training and validation which comes ~95%.
Figure 4. Relative comparison of recognition of emotions for baseline Random Forest and proposed algorithm
Figure 5. Training and validation accuracy graph of the proposed dual layer fuzzy n-Random Forest algorithm
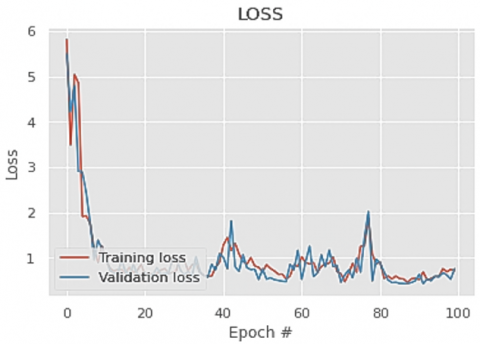
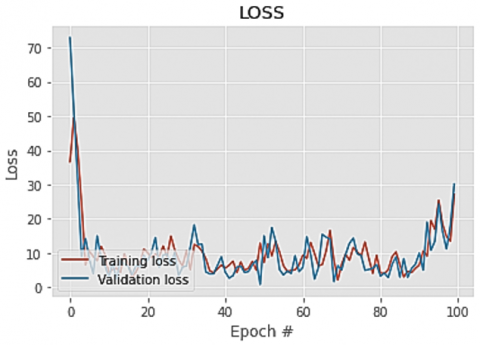
Figures 5-8 represent the Training and validation accuracy graph of the proposed dual layer fuzzy n-Random Forest algorithm, Training and validation accuracy graph of the baseline Random Forest algorithm, Training and validation loss graph of the proposed dual layer fuzzy n-Random Forest algorithm and Training and validation loss graph of the baseline Random Forest algorithm respectively and it is observed that the models do not suffer from overfitting.
Figure 6. Training and validation accuracy graph of the baseline Random Forest algorithm
Figure 7. Training and validation loss graph of the proposed dual layer fuzzy n-Random Forest algorithm
Figure 8. Training and validation loss graph of the baseline Random Forest algorithm
During the execution of the proposed work, it was identified that a Graphical user Interface (GUI) could be developed which would help the researchers to work in this domain in a more effective manner. Moreover, having a GUI would enable a prominent and effective view of the speech signals and various parameters associated with it such as the waveforms and spectrograms etc. It could also be used as a preliminary diagnostic tool in practice for the psychologists. Through this tool/Interface they would be able to have a first-hand idea of the emotional state of mind of a patient with minimum technical know-how that would aid in their diagnosis.
The following section discusses the development of the application which can capture the voice input of an individual and then store the input in a dataset which could be used for further training the models used for SER. The interface of the application is as follows:
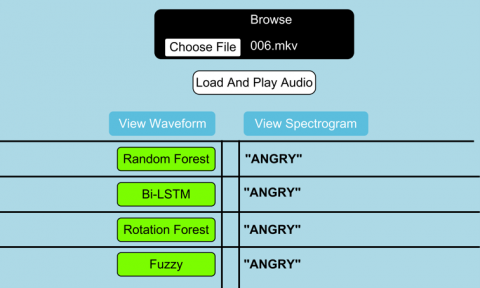
Figure 9. Home page of the application interface
This framework is designed by using Python 3.10.2, Flask 2.2.2 and Werkzeug 2.2.2. Using this application, the researchers can go on adding the various models which they have designed and experimented to find an accurate classification. There are various buttons which would enable to load the audio as well as view the waveforms and the related spectrogram as shown in Figures 9, 10 and 11. The different buttons developed for this web tool are as follows:
On the right side of the panel the predicted class of emotion for the sample which has been loaded would be displayed. The predicted class may vary for different models for which the training of the dataset was done depending on the accuracy of the models. The Layout of the tool may have a drop-down menu for the different models it supports and the functionality for newer models could be integrated in the drop-down menu as and when it is required. Moreover, functionality regarding the extracted features and their respective analysis plots could also be displayed in the tool with updated versions.
Figure 10. Wave form of the audio which has been loaded
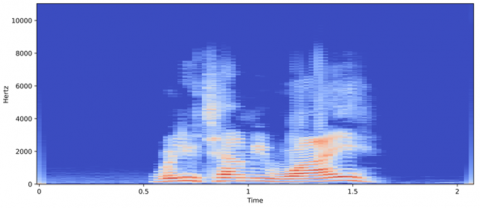
Figure 11. Spectrogram of the audio signal which is been loaded
Using this tool, the corresponding emotion that an audio signal is carrying could be clearly understood and the corresponding results could be seen on the right-hand panels of Figure 9. Researchers could load as many models as required in this application and the results could be clearly seen in the application interface itself.
Using this application, the psychologists could easily confirm their diagnosis as well as compare the results obtained during different phases of interaction with the patients and derive a cumulative and effective process of treatment for the same.
The proposed approach that uses Supervised Learning and language independent features has been developed for recognizing the states of emotion that is embedded in a speech signal. It takes into consideration the choice of features as well as the identification of the classifiers. Derivative based features are considered for supplementing the personalized characteristics of emotions which helps in realizing the negotiability and universal characteristics of emotions. The proposed approach is capable of adopting high dimensional features of correlation and improve the result of recognition tremendously. Here FCM is initially used to partition the data into subclasses based on the information of identification by making use of Euclidean distance as well as the membership functions. This is followed using the n-Random Forest method by making use of a decision tree as well as a Bootstrap method to identify the feature data. The proposed method is capable of considering the future impact and it is novel as apart from implementing the derivative of the features it is also capable of dividing the higher dimensional data related to the features into various subclasses in a manner in which the dimension of computation is reduced and the characteristics of the subclasses are near similar in nature in order to facilitate efficient learning. The approach is utilised to improve the rate of recognition. Validity is also verified for the experiments, and it has been found that the proposed approach performance is better than the corresponding baseline methods.
The average recognition rates for the baseline RF model for the neutral emotion is ~89.34% while the proposed model shows ~95.66%, for happy emotion the accuracy achieved was ~79.20% for proposed model as compared to ~69.82% of the baseline RF, for sad it was ~78.75% as compared to ~72.45% of the baseline model, for fear, disgust, surprise and anger the proposed model shows an average accuracy of ~74.55%, ~79.56%, ~85.77% and ~85.45% respectively as compared to ~72.33%, ~75.67%, ~89.20% and ~86.50% respectively. Other evaluation parameters such as the Kappa Index coefficient, sensitivity and specificity are also performed which are frequently used methods for testing the reliability [62]. Here K-fold cross validation yielded a maximum accuracy of ~89.67% and the Kappa coefficient being .78 for the proposed algorithm as compared to .66 of the baseline RF. The proposed algorithm showed a minimum standard deviation of ~±1.45 while the specificity was found to be .938 and sensitivity .652 for the proposed model as compared to .872 and .604 of the standard RF respectively. Thus, it is seen that the proposed model has better performance than the existing baseline models.
The major contributions of the proposed work involved experimenting with the personalized and non-personalized features as well as their fusion for the task of automated SER. Efforts are also being made for analyzing the language independent characteristics for the same and study their impact on a low resource language such as Assamese. As per the available literature this work is the first attempt with the Assamese language. The proposed work also focusses on optimization of the baseline RF model by introducing 2 distinct layers for the task of classification which improves the accuracy and other parameters used for evaluation. In addition to it, a GUI has been developed for the researchers to conduct their study in an effective manner.
Based on the results of the approach, it can further be applied in a wide range of area. The GUI that has been designed would also help in understanding the emotions in a much better way and could aid the psychiatrists as well as psychologists for effective diagnosis and treatment of the patients.
For future work multimodal information would be useful to enhance the performance of SER as the visual effects would also be considered such as body gesture, facial expression etc. but sometimes it is difficult for acquiring the visual information hence it might be a roadblock for the applied research field. For further exploration in this domain, Genetic Algorithm (GA) as well as multimodal features could also be employed so that the performance is enhanced and contribute in various field such as Robotics, signal processing etc.
[1] Albornoz, E.M., Milone, D.H., Rufiner, H.L. (2017). Feature extraction based on bio-inspired model for robust emotion recognition. Soft Computing, 21(17): 5145-5158. https://doi.org/10.1007/s00500-016-2110-5
[2] Gonçalves, V.P., Giancristofaro, G.T., Filho, G.P., Johnson, T., Carvalho, V., Pessin, G., de Almeida Neris, V.P., Ueyama, J. (2017). Assessing users’ emotion at interaction time: A multimodal approach with multiple sensors. Soft Computing, 21: 5309-5323. https://doi.org/10.1007/s00500-016-2115-0
[3] Leu, F.Y., Liu, J.C., Hsu, Y.T., Huang, Y.L. (2014). The simulation of an emotional robot implemented with fuzzy logic. Soft Computing, 18: 1729-1743. https://doi.org/10.1007/s00500-013-1217-1
[4] Iliou, T., Anagnostopoulos, C.N. (2009). Comparison of different classifiers for emotion recognition. In 2009 13th Panhellenic Conference on Informatics, IEEE, pp. 102-106. http://doi.org/10.1109/pci.2009.7
[5] El Ayadi, M., Kamel, M.S., Karray, F. (2011). Survey on speech emotion recognition: Features, classification schemes, and databases. Pattern Recognition, 44(3): 572-587. https://doi.org/10.1016/j.patcog.2010.09.020
[6] Schuller, B., Batliner, A., Steidl, S., Schiel, F., Krajewski, J. (2011). The INTERSPEECH 2011 speaker state challenge. In Proc. INTERSPEECH 2011, Florence, Italy, 2011, pp. 3201-3204. https://doi.org/10.21437/Interspeech.2011-801
[7] Kim, J.B., Park, J.S. (2016). Multistage data selection-based unsupervised speaker adaptation for personalized speech emotion recognition. Engineering Applications of Artificial Intelligence, 52: 126-134. https://doi.org/10.1016/j.engappai.2016.02.018
[8] Park, J.S., Kim, J.H., Oh, Y.H. (2009). Feature vector classification based speech emotion recognition for service robots. IEEE Transactions on Consumer Electronics, 55(3): 1590-1596. https://doi.org/10.1109/TCE.2009.5278031
[9] Kim, E.H., Hyun, K.H., Kim, S.H., Kwak, Y.K. (2009). Improved emotion recognition with a novel speaker-independent feature. IEEE/ASME Transactions on Mechatronics, 14(3): 317-325. https://doi.org/10.1109/TMECH.2008.2008644
[10] Pagidirayi, A.K., Bhuma, A. (2022). Speech emotion recognition using machine learning techniques. Revue d'Intelligence Artificielle, 36(2): 271-278. https://doi.org/10.18280/ria.360211
[11] Eyben, F., Wöllmer, M., Graves, A., Schuller, B., Douglas-Cowie, E., Cowie, R. (2010). On-line emotion recognition in a 3-D activation-valence-time continuum using acoustic and linguistic cues. Journal on Multimodal User Interfaces, 3: 7-19. https://doi.org/10.1007/s12193-009-0032-6
[12] Jin, C., Sherstneva, A.I., Botygin, I.A. (2022). Speech emotion recognition based on deep residual convolutional neural network. Eurasian Scientific Journal, (3): 20-24.
[13] Atmaja, B.T., Sasou, A., Akagi, M. (2022). Survey on bimodal speech emotion recognition from acoustic and linguistic information fusion. Speech Communication, 140: 11-28. https://doi.org/10.1016/j.specom.2022.03.002
[14] Seo, J., Lee, B. (2022). Multi-task conformer with multi-feature combination for speech emotion recognition. Symmetry, 14(7): 1428. https://doi.org/10.3390/sym14071428
[15] Guo, L., Wang, L., Dang, J., Chng, E.S., Nakagawa, S. (2022). Learning affective representations based on magnitude and dynamic relative phase information for speech emotion recognition. Speech Communication, 136: 118-127. https://doi.org/10.1016/j.specom.2021.11.005
[16] Alnuaim, A.A., Zakariah, M., Alhadlaq, A., Shashidhar, C., Hatamleh, W.A., Tarazi, H., Ratna, R. (2022). Human-computer interaction with detection of speaker emotions using convolution neural networks. Computational Intelligence and Neuroscience. https://doi.org/10.1155/2022/7463091
[17] Li, D., Liu, J., Yang, Z., Sun, L., Wang, Z. (2021). Speech emotion recognition using recurrent neural networks with directional self-attention. Expert Systems with Applications, 173: 114683. https://doi.org/10.1016/j.eswa.2021.114683
[18] Praseetha, V.M., Joby, P.P. (2022). Speech emotion recognition using data augmentation. International Journal of Speech Technology, 25(4): 783-792. https://doi.org/10.1007/s10772-021-09883-3
[19] Al Dujaili, M.J., Ebrahimi-Moghadam, A., Fatlawi, A. (2021). Speech emotion recognition based on SVM and KNN classifications fusion. International Journal of Electrical and Computer Engineering, 11(2): 1259. http://doi.org/10.11591/ijece.v11i2.pp1259-1264
[20] Agarwal, G., Om, H. (2021). Performance of deer hunting optimization based deep learning algorithm for speech emotion recognition. Multimedia Tools and Applications, 80: 9961-9992. https://doi.org/10.1007/s11042-020-10118-x
[21] Parthasarathy, S., Busso, C. (2020). Semi-supervised speech emotion recognition with ladder networks. IEEE/ACM Transactions on Audio, Speech, and Language Processing, 28: 2697-2709. https://doi.org/10.1109/TASLP.2020.3023632
[22] Zhu, Z., Dai, W., Hu, Y., Li, J. (2020). Speech emotion recognition model based on Bi-GRU and Focal Loss. Pattern Recognition Letters, 140: 358-365. https://doi.org/10.1016/j.patrec.2020.11.009
[23] Atmaja, B.T., Shirai, K., Akagi, M. (2019). Speech emotion recognition using speech feature and word embedding. In 2019 Asia-Pacific Signal and Information Processing Association Annual Summit and Conference (APSIPA ASC), IEEE, pp. 519-523. https://doi.org/10.1109/APSIPAASC47483.2019.9023098
[24] Jain, M., Narayan, S., Balaji, P., Bhowmick, A., Muthu, R.K. (2020). Speech emotion recognition using support vector machine. arXiv preprint arXiv:2002.07590. https://doi.org/10.48550/arXiv.2002.07590
[25] Kerkeni, L., Serrestou, Y., Raoof, K., Mbarki, M., Mahjoub, M.A., Cleder, C. (2019). Automatic speech emotion recognition using an optimal combination of features based on EMD-TKEO. Speech Communication, 114: 22-35. https://doi.org/10.1016/j.specom.2019.09.002
[26] Qayyum, A.B.A., Arefeen, A., Shahnaz, C. (2019). Convolutional neural network (CNN) based speech-emotion recognition. In 2019 IEEE International Conference on Signal Processing, Information, Communication & Systems (SPICSCON), IEEE, pp. 122-125. https://doi.org/10.1109/SPICSCON48833.2019.9065172
[27] Sun, L., Fu, S., Wang, F. (2019). Decision tree SVM model with Fisher feature selection for speech emotion recognition. EURASIP Journal on Audio, Speech, and Music Processing, 2019(1): 1-14. https://doi.org/10.1186/s13636-018-0145-5
[28] Tarantino, L., Garner, P.N., Lazaridis, A. (2019). Self-attention for speech emotion recognition. In Interspeech 2019, Graz, Austria, pp. 2578-2582. http://doi.org/10.21437/Interspeech.2019-2822
[29] Bhardwaj, V., Kukreja, V., Singh, A. (2021). Usage of prosody modification and acoustic adaptation for robust automatic speech recognition (ASR) system. Revue d'Intelligence Artificielle, 35(3): 235-242. https://doi.org/10.18280/ria.350307
[30] Breiman, L. (2001). Random forests. Machine Learning, 45: 5-32. https://doi.org/10.1023/A:1010933404324
[31] Oyedotun, O.K., Khashman, A. (2017). Prototype-incorporated emotional neural network. IEEE Transactions on Neural Networks and Learning Systems, 29(8): 3560-3572. http://doi.org/10.1109/TNNLS.2017.2730179
[32] Chen, L., Wu, M., Zhou, M., Liu, Z., She, J., Hirota, K. (2017). Dynamic emotion understanding in human–robot interaction based on two-layer fuzzy SVR-TS model. IEEE Transactions on Systems, Man, and Cybernetics: Systems, 50(2): 490-501. https://doi.org/10.1109/TSMC.2017.2756447
[33] Raposo, F., Ribeiro, R., de Matos, D.M. (2016). Using generic summarization to improve music information retrieval tasks. IEEE/ACM Transactions on Audio, Speech, and Language Processing, 24(6): 1119-1128. https://doi.org/10.1109/TASLP.2016.2541299
[34] Eyben, F., Wöllmer, M., Graves, A., Schuller, B., Douglas-Cowie, E., Cowie, R. (2010). On-line emotion recognition in a 3-D activation-valence-time continuum using acoustic and linguistic cues. Journal on Multimodal User Interfaces, 3: 7-19. https://doi.org/10.1007/s12193-009-0032-6
[35] Wu, C.H., Liang, W.B. (2010). Emotion recognition of affective speech based on multiple classifiers using acoustic-prosodic information and semantic labels. IEEE Transactions on Affective Computing, 2(1): 10-21. https://doi.org/10.1109/T-AFFC.2010.16
[36] Yüncü, E., Hacihabiboglu, H., Bozsahin, C. (2014). Automatic speech emotion recognition using auditory models with binary decision tree and SVM. In 2014 22nd International Conference on Pattern Recognition, IEEE, pp. 773-778. https://doi.org/10.1109/ICPR.2014.143
[37] Sheikhan, M., Bejani, M., Gharavian, D. (2013). Modular neural-SVM scheme for speech emotion recognition using ANOVA feature selection method. Neural Computing and Applications, 23: 215-227. https://doi.org/10.1007/s00521-012-0814-8
[38] Morrison, D., Wang, R., de Silva, L.C. (2007). Ensemble methods for spoken emotion recognition in call-centres. Speech Communication, 49(2): 98-112. https://doi.org/10.1016/j.specom.2006.11.004
[39] Mohamed, A.R., Dahl, G.E., Hinton, G. (2011). Acoustic modeling using deep belief networks. IEEE Transactions on Audio, Speech, and Language Processing, 20(1): 14-22. https://doi.org/10.1109/TASL.2011.2109382
[40] Deriche, M., Abo absa, A.H. (2017). A two-stage hierarchical bilingual emotion recognition system using a hidden Markov model and neural networks. Arabian Journal for Science and Engineering, 42: 5231-5249. https://doi.org/10.1007/s13369-017-2742-5
[41] Chen, L., Zhou, M., Su, W., Wu, M., She, J., Hirota, K. (2018). Softmax regression based deep sparse autoencoder network for facial emotion recognition in human-robot interaction. Information Sciences, 428: 49-61. https://doi.org/10.1016/j.ins.2017.10.044
[42] Dileep, A.D., Sekhar, C.C. (2013). GMM-based intermediate matching kernel for classification of varying length patterns of long duration speech using support vector machines. IEEE Transactions on Neural Networks and Learning Systems, 25(8): 1421-1432. https://doi.org/10.1109/TNNLS.2013.2293512
[43] Deng, J., Zhang, Z., Marchi, E., Schuller, B. (2013). Sparse autoencoder-based feature transfer learning for speech emotion recognition. In 2013 Humaine Association Conference on Affective Computing and Intelligent Interaction, IEEE, pp. 511-516. https://doi.org/10.1109/ACII.2013.90
[44] Fayek, H.M., Lech, M., Cavedon, L. (2017). Evaluating deep learning architectures for speech emotion recognition. Neural Networks, 92: 60-68. https://doi.org/10.1016/j.neunet.2017.02.013
[45] Albornoz, E.M., Milone, D.H. (2015). Emotion recognition in never-seen languages using a novel ensemble method with emotion profiles. IEEE Transactions on Affective Computing, 8(1): 43-53. https://doi.org/10.1109/TAFFC.2015.2503757
[46] Genuer, R., Poggi, J.M., Tuleau-Malot, C. (2010). Variable selection using random forests. Pattern Recognition Letters, 31(14): 2225-2236. https://doi.org/10.1016/j.patrec.2010.03.014
[47] Vaiciukynas, E., Verikas, A., Gelzinis, A., Bacauskiene, M. (2017). Detecting Parkinson’s disease from sustained phonation and speech signals. PloS One, 12(10): e0185613. https://doi.org/10.1371/journal.pone.0185613
[48] Iliou, T., Anagnostopoulos, C.N. (2009). Comparison of different classifiers for emotion recognition. In 2009 13th Panhellenic Conference on Informatics, IEEE, pp. 102-106. https://doi.org/10.1109/PCI.2009.7
[49] Anjana, J.S., Poorna, S.S. (2018). Language identification from speech features using SVM and LDA. In 2018 International Conference on Wireless Communications, Signal Processing and Networking (WiSPNET), IEEE, pp. 1-4. https://doi.org/10.1109/WiSPNET.2018.8538638
[50] Kondo, K., Taira, K. (2018). Estimation of binaural speech intelligibility using machine learning. Applied Acoustics, 129: 408-416. https://doi.org/10.1016/j.apacoust.2017.09.001.
[51] Dendani, B., Bahi, H., Sari, T. (2021). Self-supervised speech enhancement for Arabic speech recognition in real-world environments. Traitement du Signal, 38(2): 349-358. https://doi.org/10.18280/ts.380631
[52] Choudhury, N., Sharma, U. (2021). Emotion recognition in standard spoken Assamese language using support vector machine and ensemble model. Indian Journal of Computer Science and Engineernig, 12: 148-158. http://doi.org/10.21817/indjcse/2021/v12i1/211201187
[53] Giannakopoulos, T., Pikrakis, A. (2014). Introduction to Audio Analysis: A MATLAB® Approach. Academic Press.
[54] Chen, L., Su, W., Feng, Y., Wu, M., She, J., Hirota, K. (2020). Two-layer fuzzy multiple random forest for speech emotion recognition in human-robot interaction. Information Sciences, 509: 150-163. https://doi.org/10.1016/j.ins.2019.09.005
[55] Zhao, Q., Li, G., Xing, S. (2010). FCM algorithm based on the optimization parameters of objective function point. In 2010 International Conference on Computing, Control and Industrial Engineering, IEEE, pp. 331-333. https://doi.org/10.1109/CCIE.2010.200
[56] Deng, W., Chen, R., He, B., Liu, Y., Yin, L., Guo, J. (2012). A novel two-stage hybrid swarm intelligence optimization algorithm and application. Soft Computing, 16: 1707-1722. https://doi.org/10.1007/s00500-012-0855-z
[57] Chen, L., Wu, M., Pedrycz, W., Hirota, K., Chen, L., Wu, M., Hirota, K. (2021). Two-layer fuzzy multiple random forest for speech emotion recognition. Emotion Recognition and Understanding for Emotional Human-Robot Interaction Systems, 2021: 77-89. https://doi.org/10.1016/j.ins.2019.09.005
[58] Wang, Z., Cui, B. (2010). The study of an improved FCM clustering algorithm. In 2010 2nd International Conference on Signal Processing Systems, IEEE, pp. V2-96. https://doi.org/10.1109/ICSPS.2010.5555213
[59] Zhou, M.T., Chen, L.F., Xu, J.P., Cheng, X.H., Wu, M., Cao, W.H., Hirota, K. (2017). FCM-based multiple random forest for speech emotion recognition. In Proceedings of the 5th International Workshop on Advanced Computational Intelligence and Intelligent Informatics, pp. 1-2.
[60] Algehyne, E.A., Jibril, M.L., Algehainy, N.A., Alamri, O.A., Alzahrani, A.K. (2022). Fuzzy neural network expert system with an improved Gini index random forest-based feature importance measure algorithm for early diagnosis of breast cancer in Saudi Arabia. Big Data and Cognitive Computing, 6(1): 13. https://doi.org/10.3390/bdcc6010013
[61] Liu, H., Zhou, M., Lu, X.S., Yao, C. (2018). Weighted Gini index feature selection method for imbalanced data. In 2018 IEEE 15th International Conference on Networking, Sensing and Control (ICNSC), IEEE, pp. 1-6. https://doi.org/10.1109/ICNSC.2018.8361371
[62] McGinnis, E.W., Anderau, S.P., Hruschak, J., Gurchiek, R.D., Lopez-Duran, N.L., Fitzgerald, K., McGinnis, R.S. (2019). Giving voice to vulnerable children: Machine learning analysis of speech detects anxiety and depression in early childhood. IEEE Journal of Biomedical and Health Informatics, 23(6): 2294-2301. https://doi.org/10.1109/JBHI.2019.2913590