Suzhen Wu![]()
© 2023 IIETA. This article is published by IIETA and is licensed under the CC BY 4.0 license (http://creativecommons.org/licenses/by/4.0/).
OPEN ACCESS
With the advancement of modern industrial technology, complex mechanical systems have found extensive applications across various industries. Gears, integral components of these systems, play a crucial role in determining the stability and safety of the entire system. Wear and aging of system components during prolonged operations might lead to performance degradation or system failures. Historically, numerous methods for vibration signal analysis and gear wear detection have been proposed. However, these methods often exhibit limitations when applied to intricate systems, such as reliance on empirical rules and sub-optimal handling of nonlinear vibration signals. In light of these challenges, the vibration genesis mechanism in complex mechanical systems has been deeply investigated. A “Gear Health Factor” has been introduced, and a wear prediction model for gears, incorporating Bidirectional Long Short-Term Memory (Bi-LSTM) networks and attention mechanisms, has been developed. This research offers fresh perspectives and methods for the health management of complex mechanical systems and holds significant practical implications.
complex mechanical systems, gear wear, vibration signal analysis, bidirectional long short-term memory (Bi-LSTM) networks, attention mechanism
With the progression of modern industrial technology, complex mechanical systems have been extensively utilized across various domains. These mechanical systems typically encompass numerous gears, bearings, and other rotating components, the operational states of which directly influence the overall system's stability and safety [1-4]. During prolonged operation, wear and aging in these components are inevitably encountered, potentially leading to system performance decline or even failures [5, 6]. Notably, gear wear, being central to these mechanical systems, can result in system shutdowns or malfunctions once issues arise [7-9]. Thus, accurate vibration signal analysis of complex mechanical systems, coupled with early wear detection and forecasting for gears, has become a focal research direction within the mechanical engineering realm.
Analysis of vibration signals from complex mechanical systems and gear wear detection not only facilitates timely identification and mitigation of system hazards but also prolongs equipment lifespan, reduces maintenance costs, and enhances production efficiency [10-12]. Especially in large-scale, high-value, or critical equipment, malfunctions could lead to significant economic losses and even jeopardize production safety. Therefore, mastering advanced techniques for early gear wear detection and prediction holds profound real-world significance in ensuring equipment's safe operation and augmenting industrial economic benefits [13, 14].
While previous research has proposed myriad methods regarding vibration signal analysis and gear wear detection, these methods often exhibit limitations when addressing complex mechanical systems [15-18]. Conventional detection approaches largely rely on empirical rules and statistical techniques, possibly failing to represent the true wear status of gears accurately, thus prone to false alarms or omissions [19, 20]. Additionally, the efficacy of these methods on complex, nonlinear vibration signal processing is less than optimal, struggling to meet the demands of contemporary intricate mechanical systems [21-23].
In light of the aforementioned challenges, a profound study into the vibration genesis mechanism in complex mechanical systems and the vibration signal analysis methods has been conducted. A gear health factor, which accurately reflects the wear status of gears, has been introduced. For more precise gear wear trend predictions, Bi-LSTM networks and attention mechanisms have been incorporated, forming a novel gear wear prediction model. This model, not only exhibiting elevated detection and prediction accuracy, is also adept at autonomously learning and extracting key features from vibration signals, offering robust technical support for the health management of complex mechanical systems. The findings of this research bear significant theoretical and practical value in propelling the advancement of health diagnosis and predictive technologies for mechanical systems, ensuring their safe and efficient operation.
In complex mechanical systems, vibrations are often generated from various components for diverse reasons. These vibrations typically encompass modulated characteristics and impulsive features. Modulated characteristics imply that a primary vibration signal can be influenced or "distorted" by signals of different frequencies. Such phenomena are frequently attributed to the interactions between two or more components. For instance, in a system containing gears, as one gear rotates and engages with another, the meshing frequency can introduce modulating effects on the primary rotational frequency. This modulation arises because every tooth engagement causes a minor vibration, which, when superimposed upon the main gear's rotation, results in this modulated effect. On the other hand, impulsive characteristics indicate the sudden appearance of a brief yet intense vibration signal at a specific moment. Such impulses are often provoked by sudden failures of a component or transient collisions between two parts. Taking the aforementioned gear system as an example, should a tooth on one gear experience wear or breakage, every subsequent engagement of this damaged tooth with the counterpart gear will produce an impulsive vibration. Such impulses are abrupt and markedly more intense than the vibrations from standard gear engagements. Thus, early detection of gear damages or wear can be achieved by monitoring these impulsive vibrations.
Figure 1. Vibration source identification process in complex mechanical systems
The implications of impulsive vibrations in complex mechanical systems are manifold. They can not only reduce the operational efficiency of the system but also inflict structural damages, further jeopardizing the system's stability and safety. Additionally, impulsive vibrations can lead to the production of high-frequency noise. This noise, detrimental to the working environment of operators, might also surpass certain noise limit standards, necessitating equipment adjustments or maintenance. Therefore, understanding the mechanisms underlying impulsive vibrations is crucial for ensuring the normal, stable, and safe operation of complex mechanical systems. By comprehending the origins and processes of impulsive vibrations, potential faults and anomalies can be identified and located at an early stage, allowing for appropriate measures to be taken before issues exacerbate.
Engines, representative of complex mechanical systems, are known to produce various vibration signals during their operational phases. Special attention is merited by the mechanism through which impulsive vibrations are formed. In this study, engines will be taken as examples to analyse the mechanism of impulsive vibrations in complex mechanical systems. Figure 1 illustrates the vibration source identification procedure.
The ignition fundamental frequency refers to the frequency at which ignition events occur within an engine. For a four-stroke petrol engine, an ignition occurs for every two crankshaft rotational cycles. During ignition, rapid combustion of the air-fuel mixture results in significant heat and pressure, causing an abrupt rise in internal cylinder pressure. Such a rapid pressure alteration leads to impulsive vibrations. By measuring the engine's rotational speed, the crankshaft's rotational cycle can be determined, further facilitating the calculation of the ignition fundamental frequency. Let the ignition fundamental frequency be denoted by $d_r$, the number of engine cylinders by $x_r$, and the number of engine strokes by $\pi$. The formula to calculate the ignition fundamental frequency is:
$d_r=b x_r / 30 \pi$ (1)
Many engine systems incorporate a hydraulic pump to deliver fluid (such as oil) to various parts. The operation of a hydraulic pump might induce pressure pulsations within the system, especially when the pump's blades come into contact with the pump casing or other components. These pressure pulsations lead to impulsive vibrations within the system. By monitoring pressure alterations in the hydraulic system, the pulsation frequency of the hydraulic pump can be identified. Assuming the pulsation frequency variation of the hydraulic pump is denoted by $d_o$, and the number of pistons in the hydraulic pump by $x_o$, the frequency of hydraulic pump pressure pulsations can be calculated as (2):
$d_o=b x_0 / 30$ (2)
Factors such as operating conditions, mechanical wear, and lubrication conditions can influence the repetitive cycle of impulsive response signals. Some prevalent characteristics of impulsive response signals include: 1) Peak value, representing the maximum value of the impulsive response signal, often indicating the intensity of the impact. 2) Pulse width, denoting the time interval from the beginning to the end of the impulsive signal. 3) Pulse interval, marking the time gap between two successive impulses. 4) Impulse energy, reflecting the overall energy of the impulsive response signal, calculated based on the squared sum of the signal. 5) Frequency content, representing the distribution of the impulsive signal in the frequency domain, typically used to identify the source and type of impulse. 6) Decay rate, illustrating the diminishing speed of the impulsive response signal over time. 7) Rise time, measuring the duration taken by the signal to reach its peak. 8) Repetition frequency, indicating the number of impulsive events within a specified time frame.
Figure 2. Analysis procedure of vibration source patterns in complex mechanical systems
Due to the intrinsic complexity and diversity of vibrations in complex mechanical systems, these vibrations often encompass harmonic components, modulated components, and impulse components. Each component symbolizes distinct physical phenomena and possible failure modes within the system. Specific fingerprints might also be present for each failure mode within the vibration signals. An investigation into the vibration signal model of complex mechanical systems is further pursued. Figure 2 depicts the comprehensive analysis procedure of vibration source patterns in such systems. Assuming the rotational frequency of the shaft is represented by $d_e$, the number of harmonic resonances by B, the amplitude of the b-th order resonance by $S_b$, the natural frequency of structural vibration by $d_a$, the number of structural vibration responses by A, and the amplitude of the a-th structural vibration response by $S_a$, the response signal of the harmonic component can be expressed as:
$\begin{gathered}z(y)=\sum_{b=1}^B S_b \operatorname{COS}\left(2 \tau b d_e y\right) +\sum_{a=1}^A S_a \operatorname{COS}\left(2 \tau d_a y\right)\end{gathered}$ (3)
Vibration signals in complex mechanical systems are typically the culmination of multi-source, multi-component influences, with each component potentially having its distinct vibration origin. Considering multiple modulated frequency components can provide a more accurate portrayal of this complexity. Thus, the amplitude and phase of the vibration source signal, being influenced by multiple modulated frequency components, are further incorporated into the signal model. Assuming the amplitude coefficient of the vibration signal is represented by V, the number of amplitude and frequency modulated components by J and M respectively, the modulating base frequency by d, the carrier frequency or rotational frequency of the vibration source by $d_v$, the amplitude of the j-th modulated component by $S_j$, the amplitude of the m-th modulated component by $N_m$, and the initial positions by $\theta, \beta$, and $\alpha$, the signal model expression can be described by:
$\begin{aligned} z(y) & =V[1+s(y)] \bullet \operatorname{COS}\left[2 \tau d_v y+n(y)+\theta\right] \\ z(y) & =\sum_{j=1}^J S_j \operatorname{COS}\left(2 \tau j d_b y+\beta_j\right), n(y) =\sum_{m=1}^M N_m \operatorname{COS}\left(2 \tau m d_b y+\alpha_m\right)\end{aligned}$ (4)
Pressure pulsations are ubiquitously observed in intricate mechanical systems, particularly in hydraulic systems or systems containing hydrodynamic components. The impulsive vibration signals generated by such pressure pulsations are distinctly periodic. To better comprehend, diagnose, and predict the performance and health status of these complex mechanical systems, further probing into the rules of their vibration source signals becomes pivotal. Assuming the number of impulsive responses is represented by W and the time interval between consecutive impulsive responses by Yw, the rule of periodic impulsive vibration signals in complex mechanical systems, induced by pressure pulsations, can be formulated as:
$z(y)=\left\{1+\bar{\mu} \operatorname{COS}\left[2 \tau d_e(y) y\right]\right\} \sum_{w=1}^W e^{-\xi\left[2 \tau d_v\left(y-w \times Y_w\right)\right] / \sqrt{1-\xi^2}} \operatorname{COS}\left[2 \tau d_v\left(y-w \times Y_w\right)\right]$ (5)
Based on the aforementioned analytical results, if all quantities are represented by z1(y), quantities from the same vibration source L are denoted by z2(y), and various periodic impulsive components are represented by z3(y), the vibration signal model expression for complex mechanical systems can be described as:
$\begin{aligned} & z(y)=z_1(y)+z_2(y)+z_3(y)+b(y) \\ & z_1(y)=\sum_{b=1}^B S_b \operatorname{COS}\left(2 \tau b d_e y\right)+\sum_{a=1}^A S_a \operatorname{COS}\left(2 \tau b d_a y\right) \\ & z_2(y)=\sum_{l=1}^L V_l\left[1+s_l(y)\right] \operatorname{COS}\left[2 \tau d_v y+n_l(y)+\theta_l\right] \\ & z_3(y)=\left\{1+\bar{\mu} \operatorname{COS}\left[2 \tau b d_e y\right]\right\} \sum_{o=1}^o r^{-\frac{\xi}{\sqrt{1-\xi^2}}\left[2 \tau d_v\left(y-o \times Y_o\right)\right]} \operatorname{COS}\left[2 \tau d_v\left(y-o \times Y_o\right)\right] \\ & \end{aligned}$ (6)
The wear process of gears in complex mechanical systems can be regarded as a non-stationary time series. From healthy operation to complete failure, the wear process of gears undergoes four stages. Given that this is a continuous and irreversible process, it implies that, over time, its statistical properties (e.g., mean, variance) will undergo alterations. Owing to the intimate correlation of these changes with the health status of the gear, a health factor has been devised to capture and quantify these variations.
Selection criteria such as wear trend and wear monotonicity have been chosen as evaluative metrics. This is to ensure that the health factor can accurately reflect the health status of the gear and make rational predictions. The wear trend focuses on the overall changing trend of gear wear, ensuring that the health factor can aptly capture the general direction and speed of gear wear. The expression for the wear trend metric of the health factor is:
$\operatorname{TR}(G, Y)=\frac{\left|\sum_{j=1}^J\left(g_j-\bar{G}\right)\left(y_j-\bar{Y}\right)\right|}{\sqrt{\sum_{j=1}^J\left(g_j-\bar{H}\right)^2 \sum_{j=1}^J\left(y_j-\bar{Y}\right)^2}}$ (7)
Assuming the health factor value at operation cycle $y_j$ is represented by $g_j$, the mean of each operation cycle is given by $Y=(1 / J) \sum_{j=1}^{J_j} y_j$, and the mean of the health factor across the operation cycle is denoted by $G^{-}=(1 / J) \sum_{j=1}^J g_j$. It is noted that $T R(G, Y) \in[0,1]$, and a higher value of $T R(G, Y)$ indicates a better trend consistency in the health factor curve.
Monotonicity of wear, on the other hand, concentrates on the persistence and consistency of gear wear, ensuring the health factor remains monotonic throughout the wear process. This enables precise differentiation between the wear stages of the gear. The formula for calculating the wear monotonicity of the health factor is:
$M O(Z)=\frac{1}{B-1}\left|Q_{z_{j+1}}-Q_{z_j}\right|$ (8)
The efficacy of the Bi-LSTM combined with the attention mechanism has been demonstrated in a variety of time series prediction tasks. For predicting the wear conditions of gears in complex mechanical systems, the Bi-LSTM is capable of simultaneously capturing both past and future information within a time series. Within the context of gear wear, both historical wear patterns and future wear trends are pivotal for accurate current wear state prediction. Such bidirectional networks ensure that both aspects of information are utilized. Not all historical data points hold equal significance when predicting the wear state of gears. The attention mechanism offers a way for the model to place greater emphasis on those time points deemed more pertinent or representative, thereby enhancing prediction accuracy. A schematic of the gear wear prediction model for the mechanical system constructed in this study is presented in Figure 3.
Initially, raw vibration and acoustical data were gathered from the mechanical system. Features such as spectral and statistical characteristics were extracted from this raw data. Two metrics, gear wear trendiness and monotonicity of wear, were computed. Finally, all data were normalized to ensure consistency on the same scale.
Subsequently, time series input data were constructed, where each time step encompassed features of the raw data, the gear wear trendiness metric, and the monotonicity of wear metric. For predictive purposes, a fixed-length time window could be selected as input. The Bi-directional LSTM layer was utilized to handle this temporal input data. This bidirectional structure enabled the capture of both past and future information. Assuming the LSTM forget gate is represented by dy, the input gate by uy, the output gate by py, the current time input by zy, and the short-term memory output of the previous time series by gy-1, with weight coefficient matrices and bias terms represented by Q and n respectively. Hyperbolic tangent activation functions are represented by tanh and δ, while the activation function is denoted by SM. The calculation formula is:
$\begin{aligned} & d_y=\delta\left(Q_{g d} g_{y-1}+Q_{z d} z_y+n_d\right) \\ & u_y=\delta\left(Q_{g u} g_{y-1}+Q_{z u} z_y+n_u\right) \\ & p_y=\delta\left(Q_{g p} g_{y-1}+Q_{z p} z_y+n_p\right) \\ & v_y=d_y v_{y-1}+u_y \tanh \left(Q_{g v} g_{y-1}+Q_{z v} z_y+n_v\right) \\ & g_y=p_y \tanh \left(v_y\right)\end{aligned}$ (9)
Assuming the traditional LSTM computation process is represented by dE(z), the forward hidden layer state by gEy, the backward hidden layer state by gMy, and the final output of the output layer by gy, with the weight parameters to be allocated to Bi-LSTM represented by q, the Bi-LSTM is defined as:
$\begin{aligned} & g_y^E=d^E\left(q_1 z_y+q_2 g_{y-1}^E\right) \\ & g_y^M=d^M\left(q_3 z_y+q_5 g_{y+1}^M\right) \\ & g_y=d^E\left(q_4 z_y^E+q_6 g_y^M\right)\end{aligned}$ (10)
Following the Bi-LSTM layer, an attention layer was added. This layer could allocate a weight to the output of each time step, highlighting the most crucial time steps for prediction. Figure 4 showcases the introduced attention mechanism network structure. The calculation process of this attention mechanism can be categorized into three stages.
First Stage: For each time step, a hidden state is outputted by the Bi-LSTM layer of the model. This hidden state encompassed information of that time step and its adjacent time steps. Within the attention mechanism, these hidden states served as “Keys” and “Queries”. By employing dot products or other similarity measurement methods, similarity scores between the Query and all Keys are calculated. This means the output of each time step is compared with outputs of all other time steps to ascertain its significance. The aim of this stage is to determine the relationship of the current time step with all other time steps, which is crucial for capturing gear wear patterns in complex mechanical systems, as these patterns might span multiple time steps. The formulas are:
$\begin{aligned} & S L\left(Q, K_u\right)=Q \bullet K_u \\ & S L\left(Q, K_u\right)=\frac{Q \bullet K_u}{\|Q\| \bullet\left\|K_u\right\|} \\ & S L\left(Q, K_u\right)=c^Y \operatorname{TANg}\left(Q \bullet K_u+I \bullet Q\right)\end{aligned}$ (11)
Second Stage: The softmax function is used to process similarity scores, ensuring the sum of all scores be equal to one. This allows each score to be interpreted as a probability value, indicating the relationship of the current time step with other time steps. This stage ensures that the model's output wasn't dominated by a few outliers, and that the model takes into account information from all time steps evenly. The formula is:
$s_u=S M\left(S L_u\right)=\frac{r^{S L_u}}{\sum_{k=1}^{M_z} r^{S L_u}}$ (12)
Figure 3. Structural diagram of the gear wear prediction model in mechanical systems
Third Stage: Normalized scores are used to weight the Value of each time step, which are then summed. This results in a weighted average, weighted based on the importance of each time step. This stage produces a new context vector, providing the model with an overview of the most relevant or significant information for the current time step, aiding in the accurate prediction of gear wear. The formula is:
$A T(Q, S) \sum_{u=1}^{M_z} s_u \bullet V_u$ (13)
Figure 4. Introduced attention mechanism network structure
A detailed investigation into the vibration formation mechanism and vibration signal analysis methods of complex mechanical systems was conducted. Specifically, for gear wear detection, a gear health factor was created, capable of accurately reflecting the wear state of the gear. Analysis was performed on the situation depicted above. From the Figure 5, three prominent frequency peaks can be distinctly observed, identified as 75Hz, 189Hz, and 456Hz. These peaks represent the primary frequency components in gear vibrations and are related to the gear's operating conditions, structural characteristics, and potential wear levels. The 75Hz corresponds to the fundamental operating frequency of the gear, linked with its natural frequency or rotational speed. The frequencies of 189Hz and 456Hz are associated with specific wear patterns or localized damage in the gear. In light of previous discussions, it was understood that gear wear is an irreversible process, encompassing stages from healthy operation, minor wear, severe wear to complete failure. These frequency peaks might serve as explicit indications of the gear entering minor or severe wear stages, offering engineers the prospect of early fault diagnosis. The approach adopted in this study exhibited notable advantages in vibration signal analysis of complex mechanical systems, a claim substantiated by the distinct frequency peaks visible in the spectrum.
Figure 5. Vibration signal spectrum of complex mechanical systems
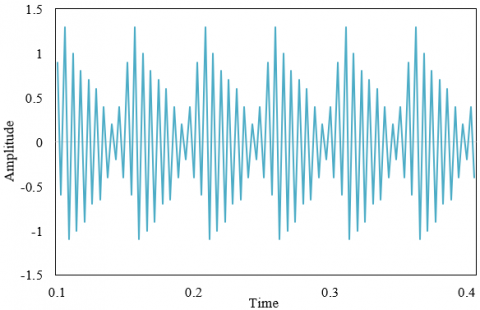
Figure 6 presents the vibration pattern analysis results of complex mechanical system vibration signals. Within the instantaneous frequency chart, a regular vibration frequency pattern can be distinctly discerned. This periodic fluctuation is tied to the inherent or operating frequencies of certain components potentially present within the complex mechanical system. The marked "211Hz" suggests the presence of a primary frequency component in the system, which is the principal cause of such periodicity. The vibration signal chart exhibits vibration signals related to time, revealing patterns that suggest the complex mechanical system might have been subject to external shocks or sudden internal variations during certain periods. Such unconventional vibrations might indicate that some components within the system may not be operating optimally under specific circumstances.
(a) Instantaneous frequency
(b) Vibration signal
Figure 6. Vibration pattern analysis results of complex mechanical systems' vibration signal
(a) Frequency spectrum
(b) Envelope spectrum
Figure 7. Time-frequency analysis results of vibration signals in complex mechanical systems
From the Figure 6 described, vibration signals from complex mechanical systems display conspicuous regularity and periodicity. Such regularity is attributed to specific internal components or external factors of the system. The methodology introduced in this study is adept not only at extracting valuable insights from voluminous data but also at providing engineers and maintenance personnel with intuitive and dependable results, facilitating real-time monitoring and fault prediction for complex mechanical systems.
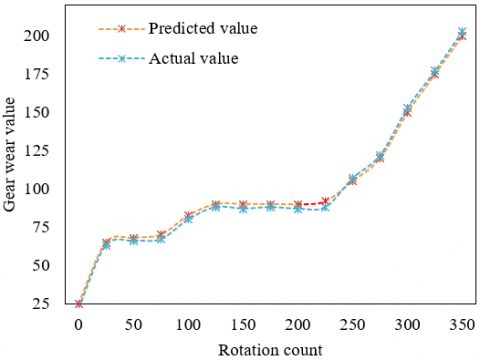
Figure 8. Gear wear prediction results in complex mechanical systems
Upon inspection of the Figure 7, a time-frequency analysis of the vibration signals in complex mechanical systems can be conducted. The preceding figure reveals a prominent peak at the 20Hz position, suggesting a heightened amplitude of vibration at this frequency. It is hypothesized that this peak could relate to the system's fundamental working frequency or be associated with a specific wear pattern. Given previous discussions on gear wear, this pronounced peak might indicate an anomalous operational state of the gear, such as wear or damage. The subsequent figure displays two main peaks: one at the 20Hz position and another at 40Hz. Envelope spectra are often employed in modulating vibration signal analysis, aiding in the early detection of mechanical faults. From this, it is inferred that the 20Hz frequency peak, corresponding to the one in the preceding figure, reaffirms anomalies in some components of the system. The 40Hz peak, potentially being the second harmonic of the 20Hz, further suggests potential nonlinear behaviour or more intricate wear patterns in the system.
Drawing upon the aforementioned Figure 7, certain anomalies or wear in the complex mechanical system are confirmed. Both the frequency spectrum and envelope spectrum disclose specific frequencies related to the abnormal operational state of gears or pertinent components. This finding aligns with prior discussions on gear wear and health factors. A comprehensive, in-depth time-frequency analysis of vibration signals in complex mechanical systems has been exemplified in the above figures.
(a) 32 Neuron count is 32
(b) Neuron count is 64
Figure 9. Comparison of predictive performance between LSTM and the proposed model
To predict gear wear trends more accurately, a novel gear wear prediction model was introduced, incorporating Bi-LSTM and attention mechanisms. The displayed Figure 8 contrasts the wear prediction results of two methods: conventional predictive techniques and the introduced model based on Bi-LSTM with attention mechanisms. As depicted, the predictive curve of the proposed model more closely mirrors the actual wear curve than the conventional method does, particularly within the wear range of 150 to 250. The disparity between the two is particularly pronounced in this region, where predictions by the conventional method seem to underestimate, while the proposed model offers more precision. Additionally, the nonlinear growth trend of gear wear, a common phenomenon in complex mechanical systems, is highlighted.
From the analysis, it is concluded that the predictive model, founded on the Bi-LSTM with attention mechanisms, showcases superior accuracy, especially in instances with substantial gear wear counts. Capable of capturing and learning critical features in vibration signals, this model proves paramount for the health management of complex mechanical systems. By autonomously learning and extracting pivotal features, deeper and more accurate insights into gear wear predictions are provided, facilitating a more profound understanding and resolution of pertinent issues for engineers and researchers.
In Figure 9, a discernible distinction between the performance of LSTM and the proposed model for gear wear prediction can be observed. With 32 neurons, the proposed model most often closely aligns with the actual wear conditions than the standalone LSTM. Particularly between 8 to 14 wear instances, LSTM predictions appear to deviate, whereas the model discussed herein accurately gauges the wear progression. As the neuron count rises to 64, an enhancement in the predictive performance of both models is witnessed. Nonetheless, superior predictive performance of the proposed model remains evident, especially between wear counts 8 to 12, where it mirrors real conditions more closely, contrasting the LSTM which deviates.
From the above, it can be concluded that, irrespective of neuron counts being 32 or 64, the introduced model surpasses the traditional LSTM in predictive performance. As neuron numbers are augmented, while both models see improvements in their predictions, the advantages of the proposed model remain strikingly clear.
Table 1. Parameter comparison between LSTM and the proposed model
|
Model |
RMSE |
MAE |
Run-Time |
FLOPs |
|
LSTM (32) |
5.21 |
3.77 |
4.23 |
987254 |
|
Proposed Model (32) |
4.78 |
3.65 |
0.98 |
4756 |
|
LSTM (64) |
7.52 |
6.34 |
5.45 |
1524256 |
|
Proposed Model (64) |
3.78 |
5.29 |
0.97 |
6124 |
From Table 1, it is evident that with 32 neurons, the RMSE for the model discussed stands at 4.78, in contrast to LSTM's 5.21, signifying a lower predictive error in the aforementioned setting for the proposed model. As neuron count increases to 64, a further decline to 3.78 is observed in the RMSE of the proposed model, while LSTM's RMSE surges to 7.52. This underlines the notable superiority of the proposed model in its predictive capabilities. With 32 neurons, both models display relatively minimal MAE values, yet the proposed model's MAE, at 3.65, remains slightly lower than LSTM's 3.77. With neuron numbers set at 64, even though an increase in MAE for both models is seen, the proposed model records an MAE of 5.29 against LSTM's 6.34, manifesting superior average error performance. In scenarios with 32 or 64 neurons, the runtime for the proposed model is significantly lower than that for LSTM, recorded at 0.98s and 0.97s respectively, in comparison to LSTM's 4.23s and 5.45s. A discernible difference in FLOPs for the proposed model, considerably lower than LSTM, is observed regardless of whether 32 or 64 neurons are employed, indicating a higher computational efficiency for the proposed model.
From the metrics of RMSE and MAE, it can be deduced that, under any neuron setting, the proposed model exhibits higher predictive accuracy than LSTM. Not only is it more accurate in its predictions, the proposed model is also computationally efficient and has a reduced run-time, as validated by its recorded run-time and FLOPs. With an increment in neuron count, while the proposed model maintains consistent performance, a decline in LSTM's performance is perceived. This further corroborates the robustness of the proposed model. Given the aforementioned analysis, it is unequivocally established that in predicting wear in complex mechanical systems' gears, whether from a standpoint of predictive precision, run-time, or computational efficiency, the proposed model undeniably showcases superior efficacy. This emphasizes the efficiency and application value of the methods described herein.
In-depth research into the vibration formation mechanism and signal analysis methods of complex mechanical systems has been conducted, with a particular focus on gear wear detection. The model constructed not only exhibits high detection and prediction accuracy but is also capable of autonomously learning and extracting critical features from vibration signals, offering potent technical support for the health management of intricate mechanical systems.
Through time-frequency analysis of vibration signals from complex mechanical systems, clear frequency spectra and envelope spectra were obtained, providing essential data for subsequent gear wear prediction. When compared with the LSTM model, regardless of whether the neuron count was 32 or 64, the model presented in this research showed superior prediction accuracy, shorter runtime, and higher computational efficiency. Evaluation of this model's performance from various perspectives, including RMSE, MAE, runtime, and FLOPs, has confirmed its significant superiority in predicting gear wear in complex mechanical systems.
For the problem of gear wear prediction in complex mechanical systems, a novel prediction model based on bidirectional long short-term memory networks and an attention mechanism was introduced. Experimental validation has shown that this model not only surpasses the conventional LSTM model in prediction accuracy but also demonstrates a marked advantage in runtime and computational efficiency. With the results of the time-frequency analysis, the model was found to effectively extract key features from vibration signals, granting powerful technical support for the health management of intricate mechanical systems. Overall, this research has introduced an efficient and precise new method to the field of gear wear prediction, possessing high application value and research significance.
This paper is supported by the National Natural Science Foundation of China project (Grant No.: U1804162) and the Henan Institute of Engineering Cultivation Fund (Grant No.: PYXM202019).
[1] Zhang, Y., Wang, Z., Wang, Y. (2021). Reliability Analysis of Complex Mechanical Systems. In International Conference on Electrical and Information Technologies for Rail Transportation, Singapore, pp. 354-361. https://doi.org/10.1007/978-981-16-9913-9_40
[2] Hassan, A.R., Hawas, M.N., Abdullah, A.R., Majdi, H.S., Habeeb, L.J. (2023). High-speed helical gear design parameters effect on the dynamic stress. Mathematical Modelling of Engineering Problems, 10(4): 1189-1198. https://doi.org/10.18280/mmep.100411
[3] Yang, X.P., Liu, X.Y., Kou, G.Y., Xu, C.X., Zhang, W.H., Hu, R., Wang, C., Zhao, Z.Y. (2020). Wind turbine lubrication based on parallel control of multiple factors. Journal Européen des Systèmes Automatisés, 53(5): 653-660. https://doi.org/10.18280/jesa.530508
[4] Vu, M.H., Huynh, N.T., Nguyen, K.N., Tran, A.S., Nguyen, Q.M. (2022). Optimal stress and strain of helical gear and rack in the steering system. Mathematical Modelling of Engineering Problems, 9(3): 697-706. https://doi.org/10.18280/mmep.090316
[5] Li, F., He, A., Song, Y., Wang, Z., Xu, X., Zhang, S., Liu, C. (2023). Deep learning for predictive mechanical properties of hot-rolled strip in complex manufacturing systems. International Journal of Minerals, Metallurgy and Materials, 30(6): 1093-1103. https://doi.org/10.1007/s12613-022-2536-y
[6] Longo, R., Catauro, M., Sorrentino, A., Guadagno, L. (2022). Thermal and mechanical characterization of complex electrospun systems based on polycaprolactone and gelatin. Journal of Thermal Analysis and Calorimetry, 147(9): 5391-5399. https://doi.org/10.1007/s10973-022-11225-7
[7] Jaen-Cuellar, A.Y., Trejo-Hernández, M., Osornio-Rios, R.A., Antonino-Daviu, J.A. (2023). Gear wear detection based on statistic features and heuristic scheme by using data fusion of current and vibration signals. Energies, 16(2): 948. https://doi.org/10.3390/en16020948
[8] Feng, K., Ji, J.C., Ni, Q., Li, Y., Mao, W., Liu, L. (2023). A novel vibration-based prognostic scheme for gear health management in surface wear progression of the intelligent manufacturing system. Wear, 522: 204697. https://doi.org/10.1016/j.wear.2023.204697
[9] Feng, K., Ji, J.C., Ni, Q., Beer, M. (2023). A review of vibration-based gear wear monitoring and prediction techniques. Mechanical Systems and Signal Processing, 182: 109605. https://doi.org/10.1016/j.ymssp.2022.109605
[10] Chin, Z.Y., Borghesani, P., Smith, W.A., Randall, R.B., Peng, Z. (2023). Monitoring gear wear with transmission error. Wear, 523: 204803. https://doi.org/10.1016/j.wear.2023.204803
[11] Zhao, C., Lin, Z., Tan, J., Hu, H., Li, Q. (2022). A new transfer learning ensemble model with new training methods for gear wear particle recognition. Shock and Vibration, 2022: 1-10. https://doi.org/10.1155/2022/3696091
[12] Zhang, F., Peng, X. (2023). Analysis on load-bearing contact characteristics of face gear tooth surface wear with installation errors. Computers and Concrete, 31(2): 163-171. https://doi.org/10.12989/cac.2023.31.2.163
[13] Zeng, G., Ma, C., Pang, D., Li, T., Zhang, N. (2023). Coupling vibration characteristics of high linear speed rotor-planetary gear electro-mechanical transmission system. Binggong Xuebao/Acta Armamentarii, 44(1): 156-164. https://doi.org/10.12382/bgxb.2022.0861
[14] Feng, C., Pang, C. (2022). Research on vibration of mechanical system based on MATLAB. Journal of Physics, 2195(1): 012050. https://doi.org/10.1088/1742-6596/2195/1/012050
[15] Wei, L., Lim, C.W., Liu, H. (2022). Controllability of the elastic modulus and stiffness of magnetostrictive material spring element in a mechanical vibration system. International Journal of Mechatronics and Manufacturing Systems, 15(1): 37-56. https://doi.org/10.1504/IJMMS.2022.122908
[16] Schröder, T., Lindenmann, A., Resch, A., Matthiesen, S., Gwosch, T. (2023). Influence of coupling forces on the mechanical impedance of the hand-arm system during rotational vibration excitation around the xh-axis. International Journal of Industrial Ergonomics, 95: 103427. https://doi.org/10.1016/j.ergon.2023.103427
[17] Zhu, Y., Xu, L., Issah Abubakari, S. (2022). Mechanical vibration monitoring system for electrocardiogram machine based on Hilbert-Huang transformations. Journal of Engineering, 2022(11): 1104-1113. https://doi.org/10.1049/tje2.12189
[18] Zhu, H., Wang, Y., Wu, J., Shi, W., Shang, C. (2022). Numerical Simulation of Vibration Isolating System Based on Parameter Identification of Mechanical Impedance. In Proceedings of the 32nd International Ocean and Polar Engineering Conference, ISOPE 2022, Shanghai, China, pp. 3952-3956.
[19] Zhang, J., Ma, Z., Wang, X., Wu, Q., Zhang, L. (2023). Transient vibration of shafting in coupled hydraulic-mechanical-electrical-structural system for hydropower station during start-up process. Applied Mathematical Modelling, 124: 860-880. https://doi.org/10.1016/j.apm.2023.08.041
[20] You, Z. (2023). Design of automotive mechanical automatic transmission system based on torsional vibration reduction. Journal of Vibroengineering, 25(4): 683-697. https://doi.org/10.21595/jve.2022.22947
[21] Zhang, Z., Ji, W., Yang, B., Huo, J., Li, X. (2022). Dynamic analysis and vibration reduction of mechanical-hydraulic coupled tunnel boring machine (TBM) main drive system. Proceedings of the Institution of Mechanical Engineers, Part C: Journal of Mechanical Engineering Science, 236(1): 115-125. https://doi.org/10.1177/09544062211029330
[22] Mao, Y., Tong, J., Chin, Z.Y., Borghesani, P., Peng, Z. (2023). Transmission-error-and vibration-based condition monitoring of gear wear with contaminated lubricant. Wear, 523: 204760. https://doi.org/10.1016/j.wear.2023.204760
[23] Dhote, N.D., Khond, M.P. (2022). Condition monitoring approach for wear recognition in gear pump. Journal of Failure Analysis and Prevention, 22(4): 1558-1565. https://doi.org/10.1007/s11668-022-01448-z