Safdar Sardar Khan![]() | Nitika Vats Doohan
| Nitika Vats Doohan![]() | Manish Gupta*
| Manish Gupta*![]() | Sakina Jaffari
| Sakina Jaffari![]() | Ankita Chourasia
| Ankita Chourasia![]() | Kriti Joshi
| Kriti Joshi![]() | Bhupendra Panchal
| Bhupendra Panchal![]()
© 2023 IIETA. This article is published by IIETA and is licensed under the CC BY 4.0 license (http://creativecommons.org/licenses/by/4.0/).
OPEN ACCESS
The precise classification of animal breeds from image data is instrumental in real-time animal monitoring within forest ecosystems. Traditional computer vision methods have increasingly fallen short in accuracy due to the rapid progression of technology. To address these limitations, more advanced methodologies have emerged, significantly improving the accuracy of image classification, recognition, and segmentation tasks. The advent of "deep learning" has revolutionized various fields, particularly in object identification and recognition. Animal breed categorization is an important job in the field of image processing, and this research attempts to create a unique deep learning-based model for this purpose. The aim of this research is to devise efficient methodologies for image-based animal breed categorization to achieve superior accuracy levels. A hybrid deep learning model is proposed for animal breed prediction. The animal-10 dataset, obtained from Kaggle, serves as the empirical foundation for this study. The dataset underwent preprocessing, including edge deletion, normalization, and image scaling. Additionally, the animal images were converted into grayscale. Following this preprocessing phase, feature extraction was performed using two deep learning methods, namely VGG-19 and DenseNet121. The performance metrics, including accuracy, F1 score, recall, precision, and loss, were computed for the developed model using the Python simulation tool. Experimental results indicate that the proposed model outperforms existing current models in terms of these metrics. This research outcomes hold promising implications for the advancement of animal breed classification and prediction techniques.
animal breed prediction, image processing classification, deep learning, VGG-19, densenet-121
Throughout human history, the differentiation of distinct species has been systematically cataloged. However, the vast array of species coexisting alongside us presents an additional, substantial classification challenge. Despite the existence of mixed breeds and unidentifiable species, classification has often relied on guesswork. This raises questions regarding the accuracy of such methods, much akin to the categorization of diverse human populations. Animal breeding was the first field to propose Genomic Selection (GS) as a means to estimate the potential breeding value of untested individuals [1]. Animal breeding, in this context, refers to the intentional mating of animals possessing desirable traits in an attempt to enhance the genetic makeup of domesticated animals.
The distinguishing features in animal breeding are, in essence, compatibility scores for a diverse range of traits. These traits encompass increased productivity, resistance to diseases, hardiness, fertility, longevity, and decreased environmental impact. The study of animal genetics can facilitate not only the growth of zoology but also the advancement of modernization initiatives [2].
In the 21st century, as socialist modernization gradually improves, the promotion of molecular breeding theory has become widespread. The term "big data" has emerged as a trend, with Machine Learning (ML) serving as a tool for extracting insights from large datasets [3]. ML's influence has spread across all sectors of society and business, with its recent developments, such as the AlphaGo program, garnering significant attention [4].
Although heterogeneous genetic data is increasingly being used in various biomedical fields, its exploration remains minimal [5]. Historically, animal farming has been decentralized and managed by a small group of individuals. However, in the past decade, conditions have rapidly changed. The growth in demand for animal-based products and meat is predicted to exceed 70% in the next 30 years, necessitating an increase in animal production [6].
Simultaneously, technological advancements have made access to high-speed internet, smartphones, and affordable processing power readily available for most animal farmers. In this context, Artificial Intelligence (AI) plays a crucial role in modern intensive animal farming, promoting "smart farming" and enhancing animal welfare and health [7]. Despite several scientific studies utilizing AI, there is currently a lack of comprehensive literature reviews that cover AI studies across multiple animal breeds.
The recent technological advancements have started to impact the livestock industry, allowing farmers and breeders to use less labor-intensive methods of continuous monitoring and data collection [8]. The inclusion of molecular data from animals brings us closer to "precision animal husbandry," where each animal is monitored and managed based on its unique circumstances [9].
The intensification of livestock farming is a characteristic feature of today's livestock industry. Several criteria have to be satisfied for this development to occur without adverse effects on animals, farmers, or farms. These include the capacity of the farmer to manage more animals and the health and care needs of the animals [10].
Among many neural network types used in ML, feedforward networks are the most intricate. Convolutional Neural Networks (CNNs) are commonly utilized for image recognition and categorization due to their effectiveness. CNNs construct a network in a hierarchical manner, aiming to produce an output value where all neurons are connected and their results are processed. The machine learns to categorize images, words and sounds [11].
In this study, we introduce a hybrid DNN system for breed classification that incorporates VGG19 & Densenet121, two DL methods. The efficiency of this hybrid model may be compared to that of other models because it is trained that used the same data (the Animal-10 dataset). Using the Focal Loss for both the loss function and the dense block improves the model's performance. The model is tested on the Animal-10 datasets, and the findings show that the proposed approach could solve the problems of identifying and classifying animal species.
The outline of this research is as follows: The second part of this paper critically analyses existing research and weighs the merits of various approaches. In the third part, we lay out the framework and methods of the proposed model. The criteria used to evaluate the model's effectiveness and the dataset was using to train it are discussed in the fourth section. In the final section, we talk about the model's outputs, such as accuracy and loss against epoch graphs. A summary and recommendations for further study are included in the concluding section.
In 2021, Borwarnginn et al. [12] present a technique to detect dog breeds from pictures using deep learning techniques. The process begins with transfer learning or the retraining of CNNs that were previously trained on the public dog breed dataset. After that, the training data frame is augmented with images in various ways to boost classification accuracy. Three distinct CNNs are used to evaluate the proposed technique, each with unique augmentation parameters and a large number of experimental configurations. The suggested model achieves an impressive 89.92% accuracy on the publicly available data set of 133 dog breeds.
Chen et al. [13] conducted this research in 2023 to determine if SVR & ANN models might be used to speculate the qualities of broiler meat. One hundred-day-old yellow feathered broilers were employed for the study (86 females and 90 males). Both exterior and B-ultrasound measurements of the body were taken at regular intervals and utilized as input variables. Female broilers' breast muscle mass and male broilers' abdomen fat mass were utilized to calibrate the model. After completing descriptive and correlation studies on the datasets, they were partitioned into training data and a validation dataset with a 7:3 proportion to create the model. In this paper, they show that machine learning techniques may be used to foretell broiler meat quality using measures taken while the birds were still living. SVR performed better than ANN in predicting both breast muscle (R2=0.950 for men and R2=0.955 for women) and abdominal fat (R2=0.802 for men and R2=0.944 for women).
Using machine learning techniques, including multiple regressions, artificial neural networks, and naive bayes assistance vector machines, random forests, partial least squares regression, Hakem et al. [14] examined various studies that sought to solve this issue. These algorithms try to predict how new animals will do based on data they have already collected about fauna’s at various points of development. It is possible to evaluate the precision of a forecast by looking at metrics like its MAPE, accuracy, and RMSE, sensitivity.
Three different ML techniques, NB (Naive Bayes), RF (Random Forest), and MLP (Multilayer Perceptron), were tested by Shahinfar et al. [15] to see how well they could predict lameness cases based on dairy production and conformation features. Regarded as the pinnacle of categorization methods, logistic regression (LR) was used to compare how well these algorithms worked. To determine the prevalence of lameness, they analyzed 2 535 lameness scores (2 248 good, 287 poor) & 29 predictor factors from 9 Australian dairy herds. Each herd's data was split in half, with the first 80% utilized for training & second 20% for validation. Receiver's performance was low for both RF (0.61) and MLP (0.62), whereas LR (0.67) and NB (0.66) showed minimal variance in this metric. But the F1-score in NB (27%) did better than in LR (1%), which suggests that NB could be a better way to predict lameness in practice, as long as enough appropriate information is accessible for correct guidance, which was a weakness of this study.
Jwade et al. [16] say that sheep farmers need to understand the various breeds of sheep to determine how much their flock is worth on the market. But without much experience, it can be hard for farmers to tell the difference between sheep breeds. Another way to determine the breed is to test the dog's DNA. But, evaluating many sheep in real-time in a production setting is impossible. So, it would be good for the industry if self-driving systems could quickly and accurately imitate a sheep breed expert's ability to identify sheep while working on a farm. They made novel achievements by installing a technology demonstrator machine vision system in a sheep farm, amassing 1642 images of four breeds of sheep selected for on-land photography and labelled by a specialist according to species, and training a machine learning (ML) and statistical classification model to classify the breeds of sheep with an accuracy of 95.8% and a standard deviation of 1.7.
Alves et al. [17] looked at the efficacy of numerous linear regression and machine-learning techniques for predicting lamb carcass traits & commercial meat cuts. In addition, Bayesian networks were examined as possible alternative to conventional feature selection techniques. Phenotype data were collected on 74 lambs of an unknown breed. The statistics of prediction ability were computed using a leave-one-out cross-validation method (R2, RMSE). For predicting characteristics of the carcass, R2 values varied from 0.36 to 0.88, and when predicting characteristics of the meat slices, they ranged from 0.65 to 0.84, showing moderate to high prediction accuracies. Evidence suggests that the support vector machine method may one day replace the more popular multiple linear regression strategies. Also, the study discovered that the best technique to pick features might vary depending on the trait and model being used. Pre-selection tools for input variables in non-parametric techniques may come in the form of either stepwise procedures or Bayesian network processes.
The novel containerized directed graph design presented by Hossain et al. [18] is intended to streamline and quicken the processes of managing, monitoring, and debugging whole ML workflows from beginning to finish. The platform enables ML workflow definition and deployment in containers, metadata tracking, in-production behavior verification, and model enhancement based on machine learning and human input. He exemplifies these abilities by integrating two hybrid systems into the framework to monitor the spread of data drift. Samples that fall beyond the current distribution's latent space are flagged, and a human is prompted to either retrain the prototype or encapsulate it in a filter to eliminate the noise of data corruption before an inference is performed. Using human judgment in their trials, they found promising results on the MNIST-C, CIFAR-10-C, and Fashion MNIST-C datasets.
Using information from the 2020 Syngenta Crop Challenge, Sarijaloo et al. [19] apply several machine-learning techniques to make predictions about the yield of corn hybrids. A Decision Tree (DT), XGBoost, Gradient Boosting Machine (GBM), RF (Random Forest), ABM, and Neural Network are all examples of these methods. Participants were tasked with making predictions regarding the yield of untested combinations where no data was available. Their results show that XGBoost's prediction is more accurate than rival models by a factor of 0.0524 (root mean square error). Hence, they use XGBoost model to predict yield performance of inbred as well as tester pairings that haven't been tried before.
This work by Bates and Saldias [20] aimed to evaluate the accuracy with which several machine learning methods predicted the likelihood of service within three weeks after the expected onset of mating. They hypothesized that if the data contained complicated and unexplored connections or non-linearity, many machine learning techniques would generate superior model performance than regression models.
Wu et al. [21] developed a FTAP (Features Transferring Autonomous machine learning Pipeline) to enhance performance as well as efficiency. Proposed FTAP has been rigorously assessed across various media, including audio, visuals, and texts. The experimental results on the ESC-50 dataset for multi-class audio categorization show that proposed FTAP outperforms current techniques for remote domain transfer learning. Also, on learning tasks, FTAP performs better than TPOT, a cutting-edge autonomous machine learning technology. Both theoretical and numeric research indicates that the suggested FTAP may be successfully implemented.
This study, done by Kumar et al. [22] in 2021, was to find SNPs unique to each of India's three commercially important sheep breeds: Garole, Changthangi, and Deccani are all in this group. Genotype information (Ovine 50K SNP array) was collected from 344 sheep representing 8 breeds for use as a reference population (Deccani, Garole, Tibetan, Changthangi, Dorset Horn, Australian Merino, Irish Suffolk, as well as Rambouillet). Researchers in this work analysed a reference population dataset using both pre-selection statistics and the Moderate Allele Frequency-Linkage Disequilibrium (MAF-LD) method. SNPs were selected using an array of 768 markers from 8 breeds with centrally-distributed gene frequencies, and breeds were then allocated. They found 95 SNPs unique to Changthangi, 89 for Deccani, and 92 for Garole.
Using deep learning techniques, Wakholi et al. [23] want to develop an image-analysis system for predicting key aspects of cow output. Twenty-three beef carcass yield factors were modeled and predicted using multiple linear regression, with the help of DL models trained on the image statistics from the carcass samples that extracted essential features. The created models achieved outstanding levels of prediction accuracy for yield indicators like lean meat percentage (R2=0.90, RMSE=1.98 percent) using only a few well-selected features. This research provides data that may be utilized to create an automated online grading system for beef carcasses.
The most recent research on use of computer vision for estimating animal posture is summarized by Jiang et al. [24], who look at articles published between 2013 and 2021. This illustrates the cutting-edge approaches in this area and the challenges that must be overcome. They began by categorizing and listing the many techniques for assessing animal positions based on a handful of keywords. The released annotated pictures, videos, and 3-D models of animal positions are also introduced and arranged, and an optimistic dummy dataset is shown. They also describe how the existing algorithms work and show their results. Lastly, based on previous work, they give a detailed analysis of the problems that keep coming up in this sector and suggest ways to deal with them.
Using a two-stage Image Net pre-trained DL model with a CNN structure, Chen et al. [25] demonstrates its ability to distinguish between three distinct aberrant groupers. The dataset has 7700 images of fish that live underwater, divided into 11 classes. There are nine economically important fish species in Taiwan, as are healthy and diseased grouper. Using real-world data, they check the accuracy of four previously trained Image Net models in this experiment. Experimental results reveal that the InceptionV3 pre-trained model achieves an average accuracy of 98.94% in the phase II task. This requires differentiating from three unique aberrant grouper appearances.
Table 1 provides a comprehensive summary of the diverse techniques and approaches utilised in the field of animal breed prediction. This summary table is a valuable resource for animal breed prediction researchers and practitioners.
Table 1. Review of different methods for animal breed prediction
|
Paper Title |
Authors |
Publication Date |
Methods |
Results |
Conclusion |
|
“Underwater abnormal classification system based on DL: A case study on aquaculture fish farm in Taiwan.” |
Chen et al. [25] |
8 September 2022 |
InceptionV3 pre-trained model. |
98.94% accuracy. |
An automated technique is developed to classify images of anomalous grouper found deep below the surface that uses previously trained deep neural network models. |
|
“Visual identification of individual Holstein-Friesian cattle via deep metric learning” |
Andrew et al. [26] |
30 April 2021 |
Deep metric learning techniques. |
93.8% accuracy. |
A comprehensive method for recognizing Holstein-Friesian cattle in new & old agricultural photographs. Previous SOTA object detectors were found to be suitable for use as a prototype breed-wide cow detector. |
|
“A prediction technique for transport stress in meat sheep based on GA-BPNN.” |
Ma et al. [27] |
15 November 2022 |
GA-BPNN, ant colony algorithm, simulated annealing algorithm, and swarm algorithm. |
89.81% Accuracy. |
It effectively enhances transportation dependability, decreases transportation risk, and resolves issues associated with inefficient meat-sheep transportation monitoring and standard control. |
|
“Breed detection of meat utilizing machine learning and breed tag SNPs”
|
Xu et al. [28] |
14 February 2021 |
Support Vector Machine (SVM), NB (Naïve Bayes), k-NN (k-Nearest Neighbor), RF (Random Forest), ANNs (Artificial Neural Networks), and DTs (Decision Trees) |
99.30 (±0.14%) & 99.13 (±0.11%) accuracy. |
Meat breeds might be reliably identified by using SNPs from breed tags in conjunction with machine learning techniques. Tens of genetic markers specific to each breed allowed for an accurate determination. RF and SVM performed better across the board. By using SNPs as breed tags, detection performance improved with larger training sets but stayed the same for the TIT test set. |
|
“Machine learning techniques for the identification of lameness in dairy cows.” |
Shahinfar et al. [15] |
17 November 2021 |
NB (Naïve Bayes), Multilayer Perceptron (MLP), ML methods, and RF. |
LR-67%, NB-66%, MLP-62%, RF-61% Accuracy. |
findings of this work give supporting evidence for hypothesis that lameness may be predicted with machine learning prediction models. This could make machine learning predictive models a useful decision-making tool for better management of lameness in precision dairy farming. |
|
“The use of machine learning approaches to detect sperm quality in Holstein bulls” |
Hürland et al. [29] |
23 November 2022 |
Gradient Boosting, Lasso, & Group Lasso |
80% Accuracy. |
In the future, such forecasting technologies may assist AI centers in stabilizing bull semen output through better optimization of managerial aspects. |
|
“estimation of the marbling score and carcass traits in Korean Hanwoo beef cattle using ML techniques and SMOTE” |
Shahinfar et al. [30] |
12 November 2019 |
Machine Learning (ML) algorithms |
0.95%, 0.64% Accuracy and precision. |
The study set out to evaluate the efficacy of machine learning algorithms for making predictions about the quality of Hanwoo cow carcasses. The luxury beef market in Korea would benefit greatly from an early-life indication that reliably predicts carcass quality parameters like marbling score and loin weight. Predictions for loin cuts, eye muscle area, carcass weight, and marbling score (sirloin, strip loin, etc.) were effectively taught and evaluated through the use of a variety of machine learning algorithms in this work. |
|
“Application of machine and deep learning algorithms in microscopic optical detection of Plasmodium: A malaria diagnostic tool for the future” |
Ikerionwu et al, [31] |
12 November 2022 |
Machine learning |
99.23% Accuracy. |
Researchers believe that using CNN and other machine learning algorithms to detect malaria parasites at the microscopic level has led to more accurate early diagnosis of the disease. |
|
“Identification of sheep carcass traits from early-life records utilizing ML” |
Shahinfar et al. [32] |
26 November 2018 |
KNN, Gradient Boosting Tree (GBT), RF, and Model Tree (MT) |
IMF-2WT to 88%, HCW-8WT Accuracy. |
The results of this investigation show that machine learning techniques, particularly RF, may accurately predict sheep carcass features. Most carcass forecasts improved when more weight data were utilized, and ultrasound measures were incorporated into the algorithms. |
|
“Automatic ham classification techniques based on SVM model enhance accuracy and benefits compared to manual classification.” |
Masferrer et al. [33] |
25 April 2019 |
SVM |
75.3% Accuracy. |
The results show that SVM-based classification yields higher economic benefits for sorting while being more accurate than human classification. |
Several significant research gaps exist in the subject of animal breed prediction using machine learning despite its evident potential. The lack of suitable evaluation metrics, the inability to distinguish between similar breeds, the lack of interpretability in complex models, and the lack of availability of high-quality and diverse datasets are all examples of these research gaps.
Our research was driven by a desire to address these research gaps and have a constructive effect on application of ML to the problem of predicting animal breeds. Our goal is to develop hybrid deep neural network (DNN) model for breed prediction that outperforms current approaches in terms of both efficiency and interpretability. By addressing difficulties with dataset quality and variety, model bias, assessment metrics, and interpretability, we want to give practical recommendations that may progress animal breed prediction and have substantial consequences for livestock management, conservation initiatives, and veterinary care.
In conclusion, we created a novel hybrid DNN model to solve the gaps in existing research & tackle the challenges of animal breed prediction. The researchers behind the study were driven by a desire to make a significant impact in the field, improve the accuracy and readability of breed prediction models, and address the research gaps and limitations that had been highlighted.
3.1 Dataset collection
The first step of the Animal-10 dataset, gathered from the Kaggle site, is to collect data. It has about 10,000 animal pictures that are of average quality. There are seven types: dog, cat, spider, butterfly, cow, squirrel, and elephant. A sample picture from the collection is demonstrated in Figure 1.
Figure 1. Illustrations from the information
3.2 Data preprocessing
It is the process of turning raw data into text that has been cleaned up. "Preprocessing" generally means changing the data before putting it into algorithm. It's just putting raw data into a format that can be understood. You should study this documentation thoroughly to familiarise yourself with the ML Method's parameters and their meanings before commencing development. Real-world datasets contain artifacts such as noise, missing values, or inconsistent details. This is because the data is large and comes from different data sets from other places. The final set of data is what comes out of the preprocessing. The ways to prepare data for processing are put into different groups.
In the data preprocessing, images are shown in Figure 2, which consist different steps performed, which first read the images from the dataset to provide a Canny detector function to detect the edge from the edge detection process. One of the standard ways to find edges is the Canny edge detection technique. Before finding the edges of an image, the Canny is a very useful technique for separating noise from the Image. The Canny method is better because it doesn't change the side of the picture. Rather, it depends on the inclination to see boundaries and the importance of threshold value. In addition, remove the noise of the Image using Gaussian Blur, resize the image is converted into a 128x128, and assign the label Butterfly as 0, Cat as 1, Cow as 2, Dog as 3, Elephant as 4, Spider as 5, Squirrel as 6.
3.2.1 Edge detection process
There's a photo of the rim. Image compression [34] keeps vital info about the forms of the scene's components while reducing the quantity of data that must be processed. This visual description may be easily included in various machine learning and image processing systems for object recognition. Much has been written in the previous 30 years on edge detection, but the fact that it can locate the true edge line with excellent orientation remains the most crucial aspect of the method. On the other hand, there isn't yet a common performance directory that can be used to judge how well edge detection methods work. The performance of the edge detection technique is always checked on a case-by-case basis and depends on what it is being used for. Edge detection is one of the most important tools for segmenting images. The way grey scales change in an image is used by edge detection methods to make edge images from the original images. Edge detection is used in image processing, especially computer vision, to determine where important differences in a grayscale image are and their physical and geometrical properties. It is a basic process that finds the edges of an object and the boundaries between it and the background in an image. Edge detection is the most common way to find places where intensity values change significantly [34].
Change the Image to grayscale. When turned into a grayscale image, the colour image may lose sharpness, contrast, shadow, and structure. A new algorithm has been made to keep the colour image's shadow, contrast, sharpness, and structure. The new algorithm does an RGB approximation, a reduction, and adds chrominance and luminance to turn a colour image into a grayscale image. Describing the removal of the noise of the Image by using Gaussian Blur from open-CV and then calculating by using Sobel algorithms from open-CV and converting them into the Cartesian coordinates. Set the minimum and maximum thresholds and get the measurements of the input image. Widths, as well as Height, are every pixel of the grayscale Image.
Figure 2. Preprocessed images
3.3 Data augmentation
Data augmentation is the procedure for adding more data to a data set or "augmenting" it. This extra information may range from images to text, and using it in machine learning algorithms helps them to work better. Most of the time, there aren't enough images to train CNN. Data augmentation is a common way to make up for not being able to use label-preserving transformations on available images. For instance, affine transformation (translation, rotation, inversion), changing the brightness, adding Gaussian noise, etc. Data augmentation reduces overfitting and makes a classifier more accurate and stable. In this study case, we just added horizontal flipping to the images. But you could try other things, like random cropping, translations, color scale shifting, etc. In a vertical or horizontal flip, an image flip means that the pixels in the rows or columns are switched around. The Image Data Generator class's function Object () takes a horizontal or vertical flip Boolean argument. This tells the class which flips to do. The image is enhanced by being rotated clockwise by an arbitrary amount (between 0 and 360 degrees) thanks to a rotation enhancement.
3.4 Data splitting
In machine learning, data is often separated into three categories: train set, test set, & validation set. Each procedure created two distinct datasets, one for development and one for verification. The assessment employed the fitted and validated model from the training set. Then, we looked at how well the different algorithms worked at generalization based on the validation and external test sets. Data splitting is divided into 2 parts: training is 80%, and testing is 20%. Training subset has 5600 samples of images, and the testing subset has 1400 samples of images.
3.5 Proposed hybrid deep neural network
At the core of DL techniques is ML, known variously as a neural network, an ANN, or an SNN [35]. To create the hybrid model, we fused the capabilities of two deep neural networks (VGG-19 and DenseNet121) during training. Specifically, the VGG-19 (Visual Geometry Group Network) comprises 19 distinct layers. The architecture consists of 3 dense, fully connected layers and 16 convolutional ones. There's a 5-deep end to the pool. Weights learned on the ImageNet dataset were included in VGG19. The VGG-19 feature extractor used by CoVNet-19 was initially tuned separately for three and two-class classifications, much like DenseNet121. After training, the last SoftMax layer was discarded. The "feature vector" that was fed into the SVM for classification was taken from the output of the 32-node "Dense" layer (the second-to-last layer). DenseNet121 was initially developed for 3-class and 2-class classification before being used as a feature extractor with VGG19. One of its many benefits is that it prevents the gradients from suddenly vanishing. It also has 121 layers. When compared to a CNN model with the same no. of layers, it has much fewer trainable parameters. In DenseNet12, each layer's output activation maps are fed into the subsequent layer.
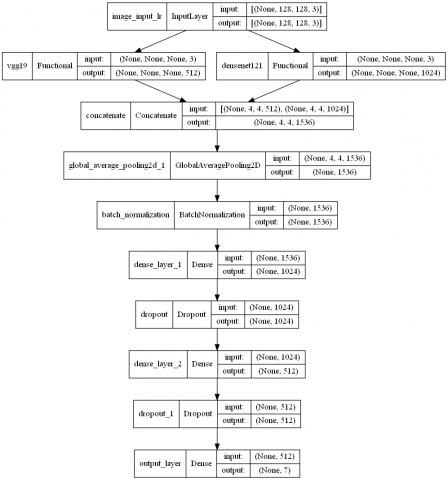
Figure 3. The architecture of the hybrid model
On the other hand, the activation maps of the layer are used by the layers that come after it. The DenseNet-121 DCNN model that had already been trained was brought in, and the ImageNet dataset was utilized for training the weights. Hybrid Models are used in the hyper-parameter in these classified as the learning rate is 0.0001. Below, Figure 3 shows the proposed hybrid model with different layers and sizes.
According to Figure 3, the displayed model is a pre-trained deep neural network architecture that uses VGG19 and DenseNet121 as their base layers. The first base model is VGG19, which uses an image as input and contains 20,024,384 parameters. It generates a feature map of dimensions None by None by 512. The second base model, DenseNet121, has 7,037,504 parameters and accepts image input as well. It generates a feature map with dimensions of none by none by 1024. Combining these two base models with the help of the Concatenate layer yields a feature map that is four by four by 1536 pixels in size. The combined feature map has its size reduced to None by 1536 due to the GlobalAveragePooling2D layer. In this layer, we average the pool over the feature map's spatial dimensions. The outputs of the global average pooling layer are normalized using a Batch Normalization layer with 6,144 parameters. After a Dropout layer with a dropout rate of 0.5, there is Dense layer with 1,573,888 parameters and 1,024 units. After it is a Dropout layer with a dropout rate of 0.5, followed by another Dense layer that also has 512 units and 524,800 parameters. The last layer is the output layer, and it is a Dense layer with 3,591 parameters and seven units, which stand for the seven output classes.
3.5.1 Adam optimizer
Adam has become a standard deep-learning algorithm with its rapid success and widespread use. Adam is a specialized adaptive learning rate optimization method developed to train deep neural networks. Adam is a flexible learning rate method since it calculates individual learning rates for each parameter. "Adaptive moment estimation" (Adam) is a method for training neural networks in which the learning rate of each weight is individually adjusted based on estimates of the first and second moments of the gradient. Adam uses estimates of the first and second moments of the gradient to determine the optimal learning rate for each weight in a NN, resulting in a new weight update.
3.5.2 Loss function
Loss is a numerical value representing all inconsistencies in our simulation model. We can determine how well or badly a model works after every optimization iteration using a model's loss value. Find out how effectively (or badly) the model is performing. It's a sign that the model is not doing a great job if the mistakes are large relative to the loss. Aside from that, our model does better the lower it is.
We need to look at how well the model did on the training and validation sets to determine how big the loss is. The percentage of a loss is not written the same manner as it is in the accuracy assessment. It is the total number of errors made by every instance in validation or training sets for the type of example being looked at [36].
3.6 Proposed algorithm
|
Input: 7000 Images Dataset Output: Classified Images Strategy: Step 1. Collect the Animal-10 dataset from the Kaggle website. Step 2. Preprocess the collected data in which Read the images from the dataset to provide a Canny detector function to detect the edge using the edge detection process.
For Loop (H): Choose the pixels around the target pixel based on the direction of the gradient. X-axis direction Top right (diagonal-1) direction Y-axis direction Top left (diagonal-2) direction Restart the cycle Double thresholding step
Step 3. Enhance the image quality in the data augmentation process with different methods.
Step 4. Divide the data in 2, with training set comprising 80% and the testing set 20%. Step 5. Apply hybrid deep neural network (VGG19+Densenet121) model using different hyper parameters as
Step 6. Accuracy, Recall, F1-Score, and Precision are measures that may be utilized to assess performance of model. Step 7. Get desired results. |
3.7 Proposed flowchart
This section presents a proposed flowchart that shows the overall implementation in Figure 4.
This section describes experiments that can be conducted using Python software technology. This section assesses several experimental outcomes. The Animal-10 dataset is used for this mission, which is collected from the Kaggle website. This section provides different subsections such as dataset description, performance evaluation metrics, and experimental results with their discussions. So, all these topics are discussed below.
Figure 4. Proposed flowchart of hybrid model (https://www.kaggle.com/alessiocorrado99/animals10?select=raw-img)
4.1 Data description
This section discusses detailed information about the dataset. As discussed above, the Animal-10 dataset is used in this research from the Kaggle website. Images of animals found on the internet make up the Dataset. Images of butterflies, cats, cows, dogs, elephants, spiders, and squirrels are included in the dataset. All of the images have been acquired from "Google Images" and manually reviewed. There is erroneous information used to simulate real conditions. There is a total of 7,000 photos in the dataset, which have been segmented into "train," "validation," and "test" groups. Considering the number of animals involved, we have 1,000 pictures. The main directory has folders for each major classification. The number of images in each category ranges from 2,000 to 5,000 units. Each category contains all images associated with a particular class and is designed to work with image data loaders. According to Table 2, out of a total of 1000 7×7 images, 800 are utilized for training, 100 for validation, and 100 for testing.
Table 2. Dataset sample division
|
Species Name |
Total Count |
|
Butterfly |
1000 |
|
Cat |
1000 |
|
Cow |
1000 |
|
Dog |
1000 |
|
Elephant |
1000 |
|
Spider |
1000 |
|
Squirrel |
1000 |
Figure 5. Data distribution graph
The above data distribution graph is shown in Figure 5 for all animal categories. The labels for the collected data are shown along x-axis, while total number of photos is shown along y-axis. From this graph, it is clearly shown that the total count of animal categories is 1000.
4.2 Performance evaluation metrics
Evaluating the efficacy of different techniques is crucial when putting ML into practice. Before using machine learning methods, data is often partitioned into train and test data. Training a model requires access to the labels that are part of the training set. As soon as the model is finished being trained, we put it to use, making accurate predictions on the test data. Our evaluation of the model’s efficacy is completed by comparing the predicted and true labels. Constructing a dependable model that can anticipate new data is essential; there may be areas where the model performs exceptionally well and others where it performs poorly. Thus, it is vital to monitor the success of the strategy using a variety of metrics.
4.2.1 Confusion matrix
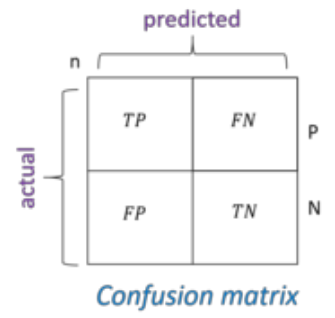
The confusion matrix was a database containing four observed and forecast number combinations. It refers to a categorization author's (or "classifier's") effectiveness on various experimental test data collected. That aids in determining not whether the data has been categorized appropriately. Tables containing predicted and actual values should be display in Figure 6. It calculates the number of instances the algorithm successfully categorized or poorly to visualize progress. This is classified into two rows & two columns, with the amounts of FN, TN, FP, and TP reported in each row or column.
Figure 6. Two classes of a confusion matrix
4.2.2 Accuracy
One of the easiest Classification metrics to implement is "accuracy" metric, which is computed by dividing no. of correct predictions by total no. of predictions; this percentage is illustrated mathematically in Eq. (1).
Accuracy $=\frac{\text { No. of } \text { correct } \text { predictions }}{\text { Total } \text { no. of } \text { predictions }}$ (1)
4.2.3 Precision
The "precision" measure is utilized to get around Accuracy limitation. The accuracy of the model is the metric by which its positive predictions are evaluated. The precision metric is mathematically represented in Eq. (2) as ratio of TPs (i.e., correct predictions) to all positive predictions (i.e., both TP and FP).
Precision $=\frac{T P}{T P+F P}$ (2)
4.2.4 Recall
Similar to the Precision metric, this metric attempts to calculate the proportion of false positives. The ratio of no. of TP (predictions that turned out to be accurate) to total no. of positives (predictions that were either right or erroneous; true positives and false negatives, respectively) may be determined.
In Eq. (3), the formula for computing "Recall" is as follows:
Recall $=\frac{T P}{T P+F N}$ (3)
4.2.5 F1 score
The "F-score" or "F1 Score" is a measure utilized to evaluate binary classification models depends upon predictions made for positive class. Precision & recall are utilized to calculate the value. In this case, Precision and Recall are combined into a single score. Consequently, F1 Score may be calculated as the harmonic mean of accuracy and recall.
Eq. (4) below shows how the F1 score is computed.
$\mathrm{F} 1-$ score $=\frac{2}{\frac{1}{\text { Precision }}+\frac{1}{\text { Recall }}}$ (4)
4.3 Results of proposed hybrid deep neural network
Here, we show the outcomes of experiments with a new model for deep neural networks. This proposed model is built by concatenating two deep learning algorithms, i.e., VGG-19 and DenseNet-121.
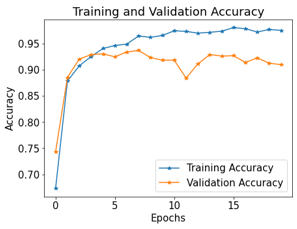
Figure 7. Hybrid model training and validation accuracy
Figure 7 graph shows the validation and training accuracy of image classification using a hybrid model. Training and validation accuracy graphs illustrate accuracy improvement more clearly. There are 20 iterations of this hybrid model. During training, this hybrid model achieved an accuracy of 96%, and during validation, it achieved an accuracy of 91%.
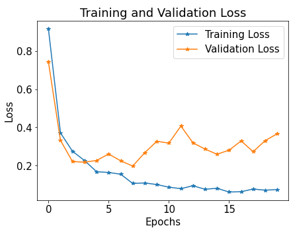
The training and validation loss experienced by the hybrid model during image classification is shown in Figure 8. By showing how the learning performance changes between epochs, this loss curve aids in the detection of learning difficulties that might lead to an underfit or overfit model. There are 20 iterations of the hybrid model. This mixed-reality model has a training loss of 0.1121 and a validation loss of 0.9100.
Figure 8. Validation and training loss of hybrid model
The Confusion Matrix between Predicted and Real Animal Images Generated Using a Hybrid Model is shown in Figure 9. A total of 7 animals, namely, butterfly, cat, cow, dog, elephant, spider, and squirrel, are classified here. The x-axis of the figure displays the anticipated label, while the y-axis displays the actual label. The diagonal of the confusion matrix depicts correctly predicted images, whereas the remaining cells represent incorrectly predicted images.
Figure 9. Hybrid model's confusion matrix
Table 3 shows the performance metrics achieved by the suggested hybrid model. The proposed hybrid model achieves a training accuracy of 96.43 percent, a validation accuracy of 91 percent, a training loss of 0.1121, as well as a validation loss of 0.3669.
Several evaluation methods used to evaluate and contrast the performance of current and proposed algorithms include training accuracy, validation accuracy, training loss, and validation loss. Their findings are shown in Table 4, which may be seen below. The most recent version of the InceptionV3 model obtains the best possible outcomes, with a training accuracy of 0.5723%, a training loss of 1.1514, a validation accuracy of 0.5114 percent, and a validation loss of 1.3438, respectively. The ResNet-50 model has an accuracy during training that is 0.670 percent, an accuracy during validation that is 0.3470 percent, a loss during training that is 0.9176, as a loss during validation that is 56.3838. The MobileNet algorithm achieves an accuracy of 0.915% during training, 0.8414 during validation, 0.3177 during training, and 1.8163 during validation. Training accuracy for the VGG-16 model is 0.8154%, training loss is 0.5505%, validation accuracy is 0.7586%, and validation loss is 0.8066%. For optimal results, go with the proposed hybrid model, which achieves an accuracy of 0.9643 during training and 0.910% during validation, as well as a loss of 0.1211 during training and 0.3669 during validation.
Table 3. Outcome of the proposed hybrid model
|
Model |
Training Accuracy |
Training Loss |
Validation Accuracy |
Validation Loss |
|
Hybrid Model |
96.43 |
0.1121 |
91.00 |
0.3669 |
Table 4. Comparative analysis between base and proposed models
|
Model |
Training Accuracy |
Training Loss |
Validation Accuracy |
Validation Loss |
|
InceptionV3 |
0.5723 |
1.1514 |
0.5114 |
1.3438 |
|
ResNet-50 |
0.6770 |
0.9176 |
0.3471 |
56.3838 |
|
MobileNet |
0.9155 |
0.3177 |
0.8414 |
1.8163 |
|
VGG16 |
0.8154 |
0.5505 |
0.7586 |
0.8066 |
|
Hybrid Model (Proposed) |
0.9643 |
0.1121 |
0.9100 |
0.3669 |
Figure 10. Accuracy comparison of different models
Figure 10 compares the accuracy of many distinct base models and several alternative models. On the x-axis of this graph is the total number of models, while on the y-axis are the respective percentages. As can be seen, the suggested hybrid model outperformed the competition by a wide margin, with a training accuracy of 96.43 percent & a validation accuracy of 91 percent.
Loss comparisons between the base and suggested models are shown in Figure 11. The decimal values of the losses are shown against the number of models on the y-axis. From this graph, it is clearly shown that the proposed approach outperforms the existing models.
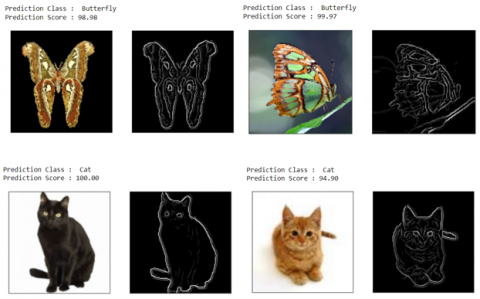
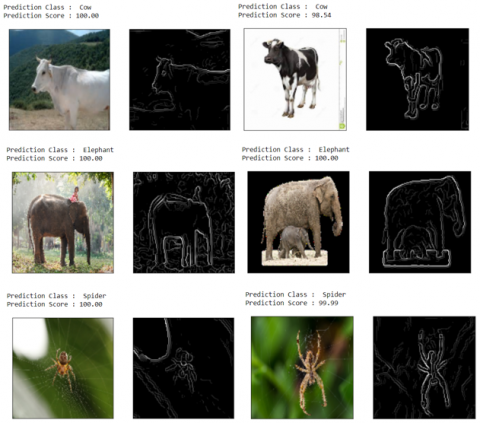
Figure 12 shows the prediction of sample images in which the prediction score is shown for each data class; as for the butterfly class, the prediction score is 98.98. After prediction, the prediction score is 99.97, and so on.
Figure 11. Variance analysis of losses
Figure 12. Prediction of sample images
Deep learning was originally made for use in predictive analytics, but recently it has been used a lot in the field of image classification. This convolution neural network-based deep learning system aims to properly identify the breed of 100 photographs given only those images. Hundreds of unique dog breeds may be represented by a single model thanks to the use of transfer learning. This research aims to learn how to use a deep learning model to classify the images, namely, animal species. By adopting a hybrid model (VGG19 and DenseNet121), this research significantly contributes to the area of animal species image classification. This hybrid model classifies images of diverse animals into their respective species with remarkable accuracy. By combining the strengths of both models, the approach exhibits a significant performance enhancement over using each model separately. Therefore, this study provides a better method for correctly classifying animal species from digital images. This model has demonstrated great performance in successfully classifying photos of different animals into their respective species, with training accuracy of 96% and validation accuracy of 91%, respectively.
This study stands out from others in field of image classification since it uses a hybrid model and narrowly targets the classification of animal species. The training dataset utilized to educate the model was broad and varied, which made it possible for the model to be educated on a wide variety of animal species and variations in lighting and angles. Accuracy, precision, recall, & F1-score were analyzed as measures of model performance. The evaluations showed that the model performed quite well when asked to categorize images of animals. Since this method takes into account differences in lighting and viewing angles, it may be used for working with a wide variety of animal species. This research adds to the existing structure of knowledge about the use of DL for classification of animal species, expanding on previous efforts that may have focused on various image categorization tasks or used alternative models.
Furthermore, the work contributes to the area by emphasizing the possible uses and consequences in a variety of fields, such as wildlife conservation, animal research, and veterinary diagnosis. Improving animal welfare and preserving the natural environment are two potential outcomes of more precise species classification using deep learning methods. The work presents a robust method for image-based species classification that may be used in a variety of contexts.
[1] Granados, A. (2021). What is animal breeding, and why is it important for sustainable farming? In Title of the Book or Journal, pp. 2021.
[2] Ouyang, J. (2016). Research advances in animal genetics breeding method. In 4th International Conference on Management Science, Education Technology, Arts, Social Science and Economics. Atlantis Press, pp. 1367-1369. https://doi.org/10.2991/msetasse-16.2016.293
[3] Dash, S., Shakyawar, S.K., Sharma, M., Kaushik, S. (2019). Big data in healthcare: management, analysis and future prospects. Journal of Big Data, 6(1): 1-25. https://doi.org/10.1186/s40537-019-0217-0
[4] Pérez-Enciso, M. (2017). Animal breeding learning from machine learning. Journal of Animal Breeding and Genetics, 134(2): 85-86. https://doi.org/10.1111/jbg.12263
[5] Leung, M.K., Delong, A., Alipanahi, B., Frey, B.J. (2015). Machine learning in genomic medicine: a review of computational problems and data sets. Proceedings of the IEEE, 104(1): 176-197. https://doi.org/10.1109/JPROC.2015.2494198
[6] Neethirajan, S. (2020). The role of sensors, big data and machine learning in modern animal farming. Sensing and Bio-Sensing Research, 29: 100367. https://doi.org/10.1016/j.sbsr.2020.100367
[7] Bao, J., Xie, Q. (2022). Artificial intelligence in animal farming: A systematic literature review. Journal of Cleaner Production, 331: 129956. https://doi.org/10.1016/j.jclepro.2021.129956
[8] Morota, G., Ventura, R.V., Silva, F.F., Koyama, M., Fernando, S.C. (2018). Big data analytics and precision animal agriculture symposium: Machine learning and data mining advance predictive big data analysis in precision animal agriculture. Journal of Animal Science, 96(4): 1540-1550. https://doi.org/10.1093/jas/sky014
[9] Berckmans, D., Guarino, M. (2017). From the editors: Precision livestock farming for the global livestock sector. Animal Frontiers, 7(1): 4-5. https://doi.org/10.2527/af.2017.0101
[10] Elgersma, G.G., de Jong, G., van der Linde, R., Mulder, H.A. (2018). Fluctuations in milk yield are heritable and can be used as a resilience indicator to breed healthy cows. Journal of Dairy Science, 101(2): 1240-1250. https://doi.org/10.3168/jds.2017-13270
[11] Jakhar, A.K., Singh, M., Shukla, A.K. (2021). Dog breed classification using convolution neural network. International Journal of Swarm Intelligence, 6(2): 130-142. https://doi.org/10.1504/IJSI.2021.118622
[12] Borwarnginn, P., Kusakunniran, W., Karnjanapreechakorn, S., Thongkanchorn, K. (2021). Knowing your dog breed: Identifying a dog breed with deep learning. International Journal of Automation and Computing, 18, 45-54. https://doi.org/10.1007/s11633-020-1261-0
[13] Chen, J.T., He, P.G., Jiang, J.S., Yang, Y.F., Wang, S.Y., Pan, C.H., Zeng, L., He, Y.F., Chen, Z.H., Lin, H.J., Pan, J.M. (2023). In vivo prediction of abdominal fat and breast muscle in broiler chicken using live body measurements based on machine learning. Poultry Science, 102(1): 102239. https://doi.org/10.1016/j.psj.2022.102239
[14] Hakem, M., Boulouard, Z., Kissi, M. (2022). Classification of body weight in beef cattle via machine learning methods: A review. Procedia Computer Science, 198: 263-268. https://doi.org/10.1016/j.procs.2021.12.238
[15] Shahinfar, S., Khansefid, M., Haile-Mariam, M., Pryce, J.E. (2021). Machine learning approaches for the prediction of lameness in dairy cows. Animal, 15(11): 100391. https://doi.org/10.1016/j.animal.2021.100391
[16] Jwade, S.A., Guzzomi, A., Mian, A. (2019). On farm automatic sheep breed classification using deep learning. Computers and Electronics in Agriculture, 167: 105055. https://doi.org/10.1016/j.compag.2019.105055
[17] Alves, A.A.C., Pinzon, A.C., da Costa, R.M., da Silva, M.S., Vieira, E.H.M., de Mendonca, I.B., Viana, V.S.S., Lôbo, R.N.B. (2019). Multiple regression and machine learning based methods for carcass traits and saleable meat cuts prediction using non-invasive in vivo measurements in commercial lambs. Small Ruminant Research, 171: 49-56. https://doi.org/10.1016/j.smallrumres.2018.12.008
[18] Hossain, M.E., Kabir, A., Zheng, L., Swain, D., McGrath, S., Medway, J. (2022). A systematic review of machine learning techniques for cattle identification: Datasets, methods and future directions. Artificial Intelligence in Agriculture. https://doi.org/10.1016/j.aiia.2022.09.002
[19] Sarijaloo, F.B., Porta, M., Taslimi, B., Pardalos, P.M. (2021). Yield performance estimation of corn hybrids using machine learning algorithms. Artificial Intelligence in Agriculture, 5: 82-89. https://doi.org/10.1016/j.aiia.2021.05.001
[20] Bates, A.J., Saldias, B. (2019). A comparison of machine learning and logistic regression in modelling the association of body condition score and submission rate. Preventive Veterinary Medicine, 171: 104765. https://doi.org/10.1016/j.prevetmed.2019.104765
[21] Wu, X., Chen, C., Li, P., Zhong, M., Wang, J., Qian, Q., Ding, P., Yao, J., Guo, Y. (2022). FTAP: Feature transferring autonomous machine learning pipeline. Information Sciences, 593: 385-397. https://doi.org/10.1016/j.ins.2022.02.006
[22] Kumar, H., Panigrahi, M., Rajawat, D., Panwar, A., Nayak, S.S., Kaisa, K., Bhushan, B., Dutt, T. (2021). Selection of breed-specific SNPs in three Indian sheep breeds using ovine 50K array. Small Ruminant Research, 205: 106545. https://doi.org/10.1016/j.smallrumres.2021.106545
[23] Wakholi, C., Kim, J., Nabwire, S., Kwon, K.D., Mo, C., Cho, S., Cho, B.K. (2022). Deep learning feature extraction for image-based beef carcass yield estimation. Biosystems Engineering, 218: 78-93. https://doi.org/10.1016/j.biosystemseng.2022.04.008
[24] Jiang, L., Lee, C., Teotia, D., Ostadabbas, S. (2022). Animal pose estimation: A closer look at the state-of-the-art, existing gaps and opportunities. Computer Vision and Image Understanding, 103483. https://doi.org/10.1016/j.cviu.2022.103483
[25] Chen, J.C., Chen, T.L., Wang, H.L., Chang, P.C. (2022). Underwater abnormal classification system based on deep learning: A case study on aquaculture fish farm in Taiwan. Aquacultural Engineering, 99: 102290. https://doi.org/10.1016/j.aquaeng.2022.102290
[26] Andrew, W., Gao, J., Mullan, S., Campbell, N., Dowsey, A.W., Burghardt, T. (2021). Visual identification of individual Holstein-Friesian cattle via deep metric learning. Computers and Electronics in Agriculture, 185: 106133. https://doi.org/10.1016/j.compag.2021.106133
[27] Ma, R., Li, S., Li, X., Liang, B., Cui, Y. (2022). A prediction method for transport stress in meat sheep based on GA-BPNN. Computers and Electronics in Agriculture, 203: 107476. https://doi.org/10.1016/j.compag.2022.107476
[28] Xu, Z., Diao, S., Teng, J., Chen, Z., Feng, X., Cai, X., Yuan, X., Zhang, H., Li, J., Zhang, Z. (2021). Breed identification of meat using machine learning and breed tag SNPs. Food Control, 125: 107971. https://doi.org/10.1016/j.foodcont.2021.107971
[29] Hürland, M., Kuhlgatz, D.A., Kuhlgatz, C., Osmers, J.H., Jung, M., Schulze, M. (2023). The use of machine learning methods to predict sperm quality in Holstein bulls. Theriogenology, 197: 16-25. https://doi.org/10.1016/j.theriogenology.2022.11.032
[30] Shahinfar, S., Al-Mamun, H.A., Park, B., Kim, S., Gondro, C. (2020). Prediction of marbling score and carcass traits in Korean Hanwoo beef cattle using machine learning methods and synthetic minority oversampling technique. Meat Science, 161: 107997. https://doi.org/10.1016/j.meatsci.2019.107997
[31] Ikerionwu, C., Ugwuishiwu, C., Okpala, I., James, I., Okoronkwo, M., Nnadi, C., Orji, U., Ebem, D., Ike, A. (2022). Application of machine and deep learning algorithms in optical microscopic detection of plasmodium parasites: A malaria diagnostic tool for the future. Photodiagnosis and Photodynamic Therapy, 103198. https://doi.org/10.1016/j.pdpdt.2022.103198
[32] Shahinfar, S., Kelman, K., Kahn, L. (2019). Prediction of sheep carcass traits from early-life records using machine learning. Computers and Electronics in Agriculture, 156: 159-177. https://doi.org/10.1016/j.compag.2018.11.021
[33] Masferrer, G., Carreras, R., Font-i-Furnols, M., Gispert, M., Serra, M., Marti-Puig, P. (2019). Automatic ham classification method based on support vector machine model increases accuracy and benefits compared to manual classification. Meat Science, 155: 1-7. https://doi.org/10.1016/j.meatsci.2019.04.018
[34] Telgad, R.L. (2020). Edge detection methods of Iris based system for Animal Identification. 2: 781-786.
[35] Kedia, P., Katarya, R. (2021). CoVNet-19: A deep learning model for the detection and analysis of COVID-19 patients. Applied Soft Computing, 104: 107184. https://doi.org/10.1016/j.asoc.2021.107184
[36] Tian, Y., Su, D., Lauria, S., Liu, X. (2022). Recent advances on loss functions in deep learning for computer vision. Neurocomputing, 497: 129-158. https://doi.org/10.1016/j.neucom.2022.04.127