Ali Hakan Işık*![]() | Özlem Özmen
| Özlem Özmen![]() | Ömer Can Eskicioğlu
| Ömer Can Eskicioğlu![]() | Nimet Işık
| Nimet Işık![]() | Sadettin Melenli
| Sadettin Melenli![]()
© 2023 IIETA. This article is published by IIETA and is licensed under the CC BY 4.0 license (http://creativecommons.org/licenses/by/4.0/).
OPEN ACCESS
Mammary tumors are commonly found in domestic animals and significantly affect animal health. In this context, the analysis of mammary tumor cells in domestic animals is crucial for the diagnosis, monitoring, and treatment of cancer. These tumors can also lead to the death of animals. Therefore, academic studies are needed to prevent and early diagnose mammary cancer in animals. In this study, an artificial intelligence-supported system for early diagnosis of whether mammary tumor sections taken from domestic dogs will cause cancer was developed. The proposed system consists of image processing and classification stages. The data for the study was provided by the Faculty of Veterinary Medicine at Burdur Mehmet Akif Ersoy University. In the image processing stage, various data preprocessing techniques and deep learning-based convolutional neural networks were used. Then, benign and malignant mammary tumors were classified to diagnose cancer. Data preprocessing techniques such as data augmentation, normalization and image filtering techniques were used to improve the performance of the deep learning-based image processing algorithm. The Xception model achieved a 98.9% success rate in tumor diagnosis. The study is believed to have made a significant contribution to the literature by using current methods and having a unique data set.
mammary tumor, deep learning techniques, mammary tumors classification, Xception, CLAHE
Cancer is today one of the deadliest diseases that affect both human and animal health. It is a disease caused by the uncontrolled growth and proliferation of cells in any organ or tissue in the body. It has more than 200 varieties and is usually named according to the tissue or cell it originates from. The most common types that can also cause death; lung, stomach, liver, colon and breast cancer. Especially breast cancer is a type of cancer that can be found frequently among women. With the advancement of modern medicine, treatment methods of breast cancer have improved. Early diagnosis and rapid detection of the disease are very important. A similar generalization can be made with animals as well as humans.
Breast cancer in domestic animals such as dogs and cats are caused by genetic factors, medications, endocrine system disorders, milk retention in the mammary gland, stress, and dietary deficiencies. Mammary tumors are classified into two types: benign and malignant. The clinical signs of malignant tumors in domestic animals can be anorexia, fatigue, pain and swelling as symptomatic findings. However, most animals with malignant mammary tumors are asymptomatic. Rapid growth is observed in malignant tumors. They are found in irregular and large masses. Benign tumors, on the other hand, have a smooth and round structure.
In our study, it is aimed to detect and diagnose mammary tumors in dogs using deep learning algorithms. We are trying to achieve maximum efficiency with the image preprocessing techniques and optimization methods we will use.
Techniques and methods used for the diagnosis and detection of mammary cancer were examined in studies found in the literature. These studies focus on relatively new and rapidly developing techniques. In the literature review, there are studies on the classification of tumors using artificial intelligence techniques and cancer diagnosis, including:
In Kör’s [1] study, breast cancer classification performance was tested using R and Python languages with a data set consisting of 569 records and 31 columns. 11 different machine learning methods were used in the study. The highest accuracy rate was achieved with SVM with a success rate of 97.66%.
Talo [2] obtained high-performance results using the ResNet-50 deep learning model-based and transfer learning method. In this study, the BreakHis dataset is used and A dual classification has been made as benign and malignant. Classification performance values between 97% and 99% are obtained in the presented study.
Kaya et al. [3] used the Apriori algorithm, which we often see in data mining and is used to extract meaningful rules. Breast Cancer Wisconsin dataset that has 569 patients’ data is used in this study. This dataset has 10 different features and 2 classes. As a result of the study, more than 90% success has been achieved.
In Sevli’s study [4], these algorithms are; SVM, Naive Bayes, Logistic Regression, K Nearest Neighbor and Random Forest. In this study, the performance of each technique mentioned has been compared. ROC curves are plotted and AUC coefficients are stated. Logistic regression is the most successful algorithm in test operations with 98.24% accuracy.
Parlar [5] conducted a literature review between 2012 and 2020 on radiomics and radio genomics models using deep learning methods. The scanned publications have been compared with each other. In her study, she gave information about the difficulties of radiomics models in breast cancer and also touched on research issues.
Kaya et al. [6] focused on early diagnosis methods for the treatment of diseases in the field of health. In the study, a literature study was conducted on the working principles of deep learning methods used in the field of health and which methods are used in diseases. As a result of the study, it is thought that deep learning methods will increase diagnostic performance.
Eyüpoğlu and Yavuz [7] developed a new breast cancer diagnosis method based on principal component analysis and a feed-forward neural network. The proposed method was tested on the Coimbra dataset with classification metrics. The method used and machine learning algorithms were compared. In the experimental results, it is seen that the method is effective and can be used for early diagnosis.
In study of Kılıçarslan et al. [8], principal component analysis and particle swarm optimization were used in the prostate cancer microarray dataset. Genes affecting diseases are detected in the presented study. Effective genes were determined with the processed data and 95.77% success was achieved with 50 features
In study of Kaplan et al. [9], clinical decision support systems that assist healthcare personnel in inpatient evaluations are obtained with the VGG16 deep learning model. In line with the study, revealed model support to physicians in the medical decision-making process. It has been tested and achieved high performance with an accuracy rate of 93.2%.
Okal [10] aimed at early diagnosis and detection of breast cancer. The Classification process was made with 60 images taken from the VisualLab Mastology Research Database with the help of MatLab. After the image pre-processing stages, segmentation and feature extraction were made. Later, with the help of genetic algorithms, it was engaged in the feature selection process. Finally, she completed the work by using support vector machines in the classification process.
In Cengil and Çınar’s [11] study, cancer classification is achieved using the Wisconsin Dataset containing metric data from the biopsy piece with needle aspiration technique. There were two classes in the study. In the classification process, a 3-layer neural network architecture was designed with the Keras library to predict whether it is breast cancer or not. It is seen that the classification performance is 98%.
Varol and İşeri [12] processed a total of 135 images, including 45 digital pathology images from each type of lymph cancer. The classification process was carried out by giving the obtained feature vectors as input to KNN, Naive Bayes, Random Forest, K-Star and Support Vector Machine. Performance metrics are calculated and compared with other algorithms. The best result in the classification process was obtained with the Random Forest algorithm with an accuracy of 89.72%.
Bektaş and Babur [13] used different machine learning algorithms to detect breast cancer. They compared the performance metrics of the algorithms with each other. Using feature selection methods, effective genes in breast cancer were determined, and the random forest algorithm was chosen as the most successful model with 139 features and 90.72% accuracy.
Machine learning techniques were analyzed with studies in the literature of Kourou et al. [14]. Artificial neural networks, Bayes Network, Support Vector Machines and Decision Trees used according to the analysis are among the most preferred models. According to the analysis, combining the integration of multidimensional heterogeneous data with the application of different techniques for feature selection and classification will be promising for cancer detection and diagnosis.
Ahmad et al. [15] provided models for detecting breast cancer by analyzing the data collected from ICBC records. In this study, 3 classification models C4.5 DT, SVM and ANN were evaluated. Performance metrics are compared in the experimental results. With the highest accuracy rate, SVM showed success with 95.7%.
Cruz and Wishart [16] evaluated different machine learning methods, integrated data types and the performance of these methods in cancer prediction and prognosis. It can be used to significantly improve the accuracy (15-25%) of machine learning methods in predicting cancer susceptibility, relapse and mortality. Machine learning can help us improve our basic understanding of the subject.
Based on the current studies, many studies have been conducted using various deep learning methods. However, there are relatively few studies on domestic animals in the literature. Our study thought that diagnosing benign and malignant mammary tumor images of dogs with the help of deep learning algorithms by using a unique dataset will make a significant contribution to the literature.
In our study, a total of 146 raw data were collected from Burdur Mehmet Akif Ersoy University Faculty of Veterinary. Data augmentation was performed on the data. Contrast Limited Adaptive Histogram Equalization (CLAHE) and Histogram Equalization (HE) techniques, as well as different filters, were applied to the images. Median filtering was used to improve the classification performance and reduce the noise in the image. For deep learning methods, the data was brought to the desired image height and width, converted into digital form, and given to algorithms.
3.1 Data set
In this study, 146 data consisting of tumor and non-tumor images of dogs were used in the dataset. Python's Keras library was used for data augmentation. 1460 images were obtained, corresponding to 1 image to 10 images. The dataset consisted of two classes: benign and malignant tumors. As a result of the procedures performed, 750 benign tumor images and 710 malignant tumor images were obtained. The images were preprocessed by increasing the number of images to 1460, and then resized to the dimensions of 224×224 and 299×299, recommended for the input of deep learning algorithms. Then, gray, RGB, CLAHE and HE filters were applied to the images. After the filtering and size reduction stages, it was necessary to reduce the noise in the images. Median filtering method was used to reduce the noise. Figure 1 shows the comparison of gray and RGB filters for the input of deep learning algorithms.
Figure 1. Filtering images process
By using the HE and CLAHE method, the performance of the algorithms with both methods has been tested. The aim was to increase the performance of the deep learning algorithm by getting clearer information from the image. Figure 2 illustrates the application of HE and CLAHE filters on the images.
Figure 2. Comparison of CLAHE and HE methods
The general structure of the study is given in Figure 3. Image preprocessing, batch size, optimizers used and deep learning models are shown.
Figure 3. Architecture of the study
The images used in the study were taken from dog cadavers and no animals were harmed during the research.
3.2 Histogram equalization
Histogram equalization is a commonly used method for adjusting the color contrast in an image by using the image's histogram. This method increases the contrast values of areas in the image that have low contrast. After this adjustment, the brightness in the image is expected to have a better distribution in the image's histogram. This method has been found to be effective in increasing the visibility of regions with low amplitude [17]. Figure 4 shows the results of histogram equalization applied to sample images.
Figure 4. Application of histogram equalization method to images [17]
3.3 Contrast limited adaptive histogram equalization
The Histogram Equalization method is generally used in image enhancement and aims to improve the image quality by expanding the dynamic range of the entire image histogram [17]. Its general purpose is to normalize the intensity distribution of the image in the histogram.
Figure 5. The structure of the 512×512 pixel image divided into 64 square regions [18]
Adaptive histogram equalization, on the other hand, improves the image by processing local data. It applies the histogram equalization method to different regions of the image. The number and size of these regions can vary depending on the image [18]. However, this method can also introduce noise in the image. To solve this problem, the contrast enhancement process is limited to homogenous areas. As a solution to the noise problem, the contrast limited adaptive histogram equalization method was developed. Figure 5 illustrates how the image, which is composed of 512×512 pixels, is divided into 64 equal squares using this method.
3.4 Deep learning models
In our study, we analyzed the output results by giving the images in our dataset to 7 deep learning algorithms. Deep learning algorithms such as VGG16, VGG19, Xception, Inception V3, LeNET, ResNET50 and classical 2-layer Convolutional Neural Network are used in the study.
3.4.1 Convolutional Neural Networks
Convolutional Neural Networks (CNN) are often used in image and video recognition, image analysis, image classification, object recognition, and natural language processing.
Each layer in the CNN architecture performs sequential and regular operations.
3.4.2 VGG16 and VGG19
VGG16 is a basic-level convolutional neural network. The VGG model, proposed by the Oxford University Visual Geometry group in the ImageNet competition, is a deep neural network that achieved an important degree in classification in 2014 [19]. As seen in the VGG model Figure 6, the size of the images in the input layer should be given as 224×224×3.
3.4.3 Xception
Xception is a variation of the Inception architecture found in convolutional neural networks that uses depthwise separable convolutions instead of regular convolutions or the deep convolutions found in Inception. According to research, it has been shown to produce better results than InceptionV3 [20].
3.4.4 InceptionV3
InceptionV3 is a deep neural network [21] that is a more complex model than the standard convolutional neural network [22]. It is commonly used for tasks such as object detection and image analysis, and was designed for GoogleNet. It is the third version of the Inception architecture used in Google's convolutional neural networks. Figure 7 illustrates the architecture of InceptionV3.
Figure 6. VGGNeT model
Figure 7. InceptionV3 model [22]
3.4.5 ResNET50
ResNET50 is a version developed on top of CNN. It stands for Residual Neural Networks. The main purpose of ResNET is to minimize the performance degradation caused by CNN [23]. In the ResNET50 architecture, the error rate has been greatly reduced compared to the previous ResNET architectures, and the computational complexity has been reduced.
3.4.6 LeNET
LeNET was developed in 1998 by Yann LeCun and his team. It is the first successful CNN model. It was run on the MNIST Dataset and various experimental results were obtained. In this architecture, while the depth increases, the information of width and height decreases.
3.5 Performance metrics
In our work, it is necessary for us to evaluate the performance of deep learning models used in order to assess their applicability and usability. The comparison of the results produced by the models with the actual results is made using a confusion matrix. By considering various performance criteria, information can be obtained about the model's performance.
3.5.1 Confusion matrix
A confusion matrix is a table that displays the relationship between the output of a classification model and the actual values, and allows for the measurement of model performance. It is shown in Table 1.
Table 1. Confusion matrix
|
|
Actual Values |
||
|
Positive (1) |
Negative (0) |
||
|
Predicted Values |
Positive (1) |
TP |
FP |
|
Negative (0) |
FN |
TN |
|
According to Table 1:
TP: True Positives (Predicted Positive, Actually Positive)
TN: True Negatives (Predicted Negative, Actually Negative)
FP: False Positives (Predicted Positive, Actually Negative)
FN: False Negatives (Predicted Negative, Actually Positive)
Accuracy: It is a measure of the ability of the model to correctly predict the target variable. It is the ratio of the number of correct predictions to the total number of predictions made by the model.
Accuracy $=\frac{(T P+T N)}{T P+T N+F P+F N}$ (1)
Precision: It is a measure of the correctly predicted values from all available classes.
Precision $=\frac{T P}{T P+F P}$ (2)
Recall: It is a measure that shows the ratio of values that should be predicted positively.
Recall $=\frac{T P}{T P+F N}$ (3)
F- Score: It is a measure showing that the model has a good performance.
$F-$ Score $=\frac{2 * \text { Precision } * \text { Recall }}{\text { Precision }+ \text { Recall }}$ (4)
In our study, deep learning techniques were used to diagnose cancer in dogs' tumors. In our study, we used classic 2-layer Convolutional Neural Network, VGG16, VGG19, ResNET50, Xception, InceptionV3 and LeNET deep learning models. Each of the mentioned deep learning models were tried one by one with different image processing techniques and performance results were obtained. In the image pre-processing stage, filtering, scaling, noise reduction techniques as well as histogram equalization and contrast limited adaptive histogram equalization were used. Image augmentation was performed when image filtering techniques were applied. From 146 raw images, 1460 amplified images were obtained. In the image augmentation stage, rotation, translation, zooming, and scaling operations have been applied. After pre-processing, the data set was reviewed again, median filtering was done on noisy images to increase the model's performance. Our data was re-scaled to suitable inputs for the architecture and converted to numerical format and given as input to our model. In the training stage, optimization algorithms were tried one by one for each model and results were obtained. Adam, SGD, RMSProp, Nadam, Adadelta, Adamax and Adagrad optimization algorithms were used. In addition to these parameters, the batch size was tried by 8, 16 and 32 for each optimization and deep learning architecture. Our dataset, which has completed the preprocessing stage, has been trained in 294 different configurations with 25 epochs, and their performances have been compared.
The performance results of the deep learning methods we applied in our study are shown in Table 2 and Table 3. As seen in Table 2, 7 different types of deep learning models were applied to images with CLAHE.
The performance of Xception and InceptionV3 was remarkable. Although the highest performance was not achieved with InceptionV3, most of its results were acceptable. A classical 2-layer Convolutional Neural Network architecture and LeNET failed to classify the tumor. The ResNET50 architecture performed at an acceptable level when using the Adagrad optimization algorithm. The 16 and 19 layer architectures in VGGNet achieved high performance, particularly when using the SGD and Adagrad optimization algorithms. From the optimization perspective, RMSProp did not perform well in any of the architectures except for InceptionV3. Therefore, it is not recommended for use in this classification task. Similarly, the Adadelta optimization algorithm also did not produce the desired results. Adagrad, Adamax, and SGD optimization algorithms are predicted to be useful for classification, as they have high acceptable values. The Adam optimization algorithm achieved the desired results, but it was not stable. It was suggested that the data be given in 8 batch size. Although higher results were obtained with 16 and 32 batch size, it was understood from Table 2 that the data with 8 batch size was more intense. Therefore, by applying CLAHE, the Xception deep learning architecture achieved 97.4% accuracy with the Adagrad optimization algorithm and 8 batch size, achieving the highest performance in Table 2.
As shown in Table 3, various results were obtained using 7 deep learning models, 7 optimization algorithms, and 3 batch size (8, 16, 32) on HE-applied images. When considering the results obtained, InceptionV3 and ResNET50 achieved high performance by producing the most stable results. As seen in Table 3, LeNET and the classical 2-layer Convolutional Neural Network failed to achieve the desired values and were insufficient for classifying images with tumors. In the VGGNet architecture, the 16 and 19 layer VGG models produced acceptable high results. In terms of optimization algorithms, RMSProp and Adadelta were less effective than other optimization methods. Notably, Adam, SGD, Adagrad, Adamax and Nadam achieved high and acceptable results. Although Xception reached the highest value, InceptionV3 was the most stable across all optimizations, showing a high accuracy graph. The Xception deep learning architecture achieved 98.9% accuracy with the Adam optimization algorithm and a 16 batch size, achieving the highest performance in Table 3.
In Table 4, there are deep learning architectures with different parameters that are trained on these outputs after CLAHE and HE preprocessing steps. The classification report table of the specified architectures is given in Table 4.
Table 2. Performance of CLAHE applied images on deep learning architectures
|
25 Epochs |
Image Preprocessing Method: |
Contrast-Limited Adaptive Histogram Equalization |
||||||||||||||||||||
|
Optimizer |
Adam |
SGD |
RMSprop |
Nadam |
Adadelta |
Adamax |
Adagrad |
|||||||||||||||
|
Batch Size |
8 |
16 |
32 |
8 |
16 |
32 |
8 |
16 |
32 |
8 |
16 |
32 |
8 |
16 |
32 |
8 |
16 |
32 |
8 |
16 |
32 |
|
|
Deep Learning Methods |
CNN (2 Layer) |
69.2 |
75.2 |
69.6 |
73.5 |
74.7 |
72.6 |
75.6 |
70.9 |
67.9 |
71.3 |
69.2 |
73.5 |
57.2 |
58.9 |
59.4 |
50.8 |
56.0 |
52.8 |
72.6 |
70.5 |
67.0 |
|
VGG16 |
82.0 |
84.6 |
90.6 |
88.0 |
97.0 |
84.1 |
52.1 |
54.2 |
58.7 |
84.1 |
85.8 |
82.4 |
67.5 |
68.3 |
56.4 |
94.0 |
81.2 |
53.8 |
82.4 |
89.7 |
62.3 |
|
|
VGG19 |
73.7 |
75.6 |
94.1 |
85.0 |
87.6 |
89.7 |
58.9 |
72.6 |
66.4 |
63.6 |
85.9 |
85.4 |
61.5 |
61.9 |
55.5 |
87.2 |
85.8 |
62.8 |
92.3 |
90.1 |
49.1 |
|
|
Xception |
90.5 |
81.1 |
51.7 |
83.3 |
87.6 |
68.3 |
51.6 |
58.1 |
52.9 |
75.2 |
52.6 |
80.3 |
91.4 |
74.5 |
65.4 |
85.8 |
92.3 |
77.7 |
97.4 |
80.2 |
62.3 |
|
|
InceptionV3 |
92.3 |
91.8 |
91.4 |
92.3 |
91.4 |
90.6 |
91.8 |
91.4 |
90.5 |
91.0 |
92.3 |
91.8 |
83.3 |
83.7 |
77.9 |
92.7 |
91.4 |
89.3 |
90.6 |
91.8 |
89.3 |
|
|
ResNet50 |
71.7 |
85.4 |
81.6 |
82.4 |
82.4 |
82.0 |
78.2 |
79.9 |
76.9 |
85.4 |
84.1 |
83.8 |
82.5 |
62.4 |
65.4 |
75.2 |
83.3 |
85.5 |
70.9 |
89.3 |
88.5 |
|
|
LeNet |
61.1 |
60.2 |
58.5 |
58.5 |
60.1 |
60.1 |
59.8 |
59.8 |
59.4 |
58.5 |
58.9 |
59.0 |
59.4 |
59.4 |
59.4 |
59.3 |
59.8 |
60.0 |
59.8 |
59.8 |
59.8 |
|
Table 3. Performance of HE applied images on deep learning architectures
|
25 Epochs |
Image Preprocessing Method: |
Histogram Equalization |
|||||||||||||||||||||||
|
Optimizer |
Adam |
SGD |
RMSprop |
Nadam |
Adadelta |
Adamax |
Adagrad |
||||||||||||||||||
|
Batch Size |
8 |
16 |
32 |
8 |
16 |
32 |
8 |
16 |
32 |
8 |
16 |
32 |
8 |
16 |
32 |
8 |
16 |
32 |
8 |
16 |
32 |
||||
|
Deep Learning Methods |
CNN (2 Layer) |
83.3 |
78.2 |
74.7 |
87.6 |
84.1 |
76.0 |
74.7 |
74.8 |
72.2 |
80.3 |
81.6 |
70.5 |
55.9 |
57.6 |
54.7 |
78.2 |
77.3 |
67.5 |
71.7 |
74.3 |
70.0 |
|||
|
VGG16 |
75.2 |
89.7 |
91.4 |
92.3 |
97.4 |
94.4 |
71.8 |
75.6 |
55.1 |
86.3 |
93.1 |
92.3 |
62.8 |
68.3 |
60.2 |
96.5 |
91.4 |
58.5 |
94.8 |
92.7 |
76.4 |
||||
|
VGG19 |
76.4 |
88.4 |
81.6 |
95.3 |
95.7 |
96.1 |
72.6 |
52.9 |
51.7 |
87.1 |
96.1 |
70.9 |
70.5 |
70.9 |
66.2 |
96.1 |
88.8 |
72.2 |
94.8 |
93.5 |
71.3 |
||||
|
Xception |
86.3 |
98.9 |
87.1 |
81.1 |
94.0 |
55.5 |
77.3 |
66.2 |
92.3 |
88.0 |
95.3 |
91.0 |
70.9 |
68.8 |
45.3 |
95.3 |
93.1 |
57.2 |
85.0 |
62.8 |
50.4 |
||||
|
InceptionV3 |
96.5 |
95.7 |
95.7 |
96.1 |
93.5 |
94.0 |
95.7 |
94.8 |
94.4 |
95.2 |
97.0 |
96.1 |
85.4 |
83.7 |
81.1 |
96.5 |
96.1 |
95.2 |
93.1 |
91.4 |
91.8 |
||||
|
ResNet50 |
88.8 |
92.3 |
92.3 |
91.8 |
91.8 |
91.8 |
91.4 |
85.8 |
91.0 |
88.8 |
88.4 |
88.0 |
87.6 |
87.1 |
87.1 |
87.6 |
88.0 |
88.0 |
87.6 |
87.6 |
87.6 |
||||
|
LeNet |
62.8 |
59.4 |
60.6 |
60.6 |
60.6 |
60.7 |
59.8 |
59.8 |
60.2 |
60.2 |
59.8 |
59.8 |
59.8 |
59.9 |
59.8 |
60.2 |
60.2 |
59.9 |
59.8 |
59.8 |
59.8 |
||||
Table 4. Classification report of the best models in HE and CLAHE
|
HE -Xception (Adam – 16Bs) 98.9% |
CLAHE -Xception (Adagrad – 8Bs) 97.4% |
||||||||
|
Classes |
Precision |
Recall |
F1 Score |
Support |
Classes |
Precision |
Recall |
F1 Score |
Support |
|
0 |
0.98 |
1.00 |
0.99 |
137 |
0 |
0.97 |
98.0 |
97.0 |
143 |
|
1 |
1.00 |
0.98 |
0.99 |
155 |
1 |
0.98 |
97.0 |
97.0 |
149 |
Figure 8. Comparison of the best model of CLAHE and HE
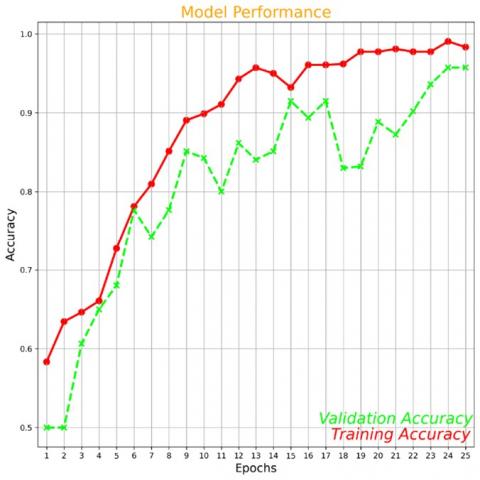
Figure 9. CLAHE Xception Adagrad 8bs training/validation-accuracy graph
Figure 10. HE Xception Adam 16Bs training/validation-accuracy graph
Figure 8 shows the performance comparison of deep learning models in CLAHE and HE filters.
Training/Validation - Accuracy graphs are shown in Figure 9 and Figure 10.
Cancer not only affects human life, but also has significant impacts on animal health. All types of cancer are dangerous, but according to research [24], lymph node cancer, skin cancer, and mammary cancer are much more deadly and have a high level of effectiveness. In the study presented, mammary tumors from dogs are classified as benign or malignant to diagnose cancer. The findings of the study reveal that high classification performance obtained from deep learning models can be used for the detection and diagnosis of cancer in dogs in a subclinical stage. Some improvements can be made for the practical application of the study. The existing study's mobile interface can be developed by consulting with veterinary faculties, research units, animal hospitals, and veterinarians.
In our study, image preprocessing steps were applied to our dataset, and a Xception deep learning architecture with the Adam optimization algorithm was used to achieve an accuracy rate of 98.9%. All algorithms, except for the LeNet architecture, have achieved high results. It can be observed that the accuracy rates of the Xception, InceptionV3, VGG16, and VGG19 architectures are close to each other. The performances of the architectures with different filters have been compared using the HE and CLAHE methods. It is anticipated that the study can be further developed with different models. To enhance efficiency on mobile devices, improvements can be made by using algorithms with lower depth and parameters but high performance. It is anticipated that contributing to the improvement of the accuracy rate can be achieved by generating synthetic data under expert control or creating a high-quality dataset with more original data. By using different artificial intelligence tools, it is possible to increase the resolution of the dataset, train with higher quality data, and aim to improve performance.
A mobile application can be developed according to the requests of expert, and the dataset can be continuously updated to ensure a more consistent outcome from the model. Additional images obtained will be an academic data source for further studies. In addition to mobile applications, web-based applications can also be developed. In addition to cancer diagnosis, visual and written information about animal health can also be provided through the web application.
Cancer is a prevalent disease that plays a significant role in our lives and can lead to fatal outcomes in both humans and pets. Early diagnosis is crucial for preventing this disease. In this study, 146 images were obtained from the Department of Pathology at Burdur Mehmet Akif Ersoy Faculty of Veterinary Medicine, and the classification of canine images with mammary tumors was attempted through the use of hyperparameter optimization with various image processing techniques and different deep learning architectures. The results of the study showed that the classification process was successful at 98.9% with the use of the Xception model. The study compared different deep learning models to identify the best model, with the 2-layer Convolutional Neural Network, VGG16, VGG19, InceptionV3, Xception, ResNET50 and LeNET architectures being examined. The most suitable models were determined to be Xception, InceptionV3 and VGG16. According to the findings, InceptionV3 produced more stable results across different parameters. VGGNet models also met the desired accuracy. The Xception architecture was determined to be the most suitable solution based on the images in the dataset. If the quality and quantity of images are increased, it is expected that the algorithms will produce even higher performance.
Financial support and contribution were provided by the study, Burdur Mehmet Akif Ersoy University project (Grant No.: 0713-MP-21). We would like to thank you for your contributions.
[1] Kör, H. (2019). Classification of breast cancer by machine learning methods. In 4th International Symposium on Innovative Approaches in Engineering and Natural Sciences, pp. 508-511. https://doi.org/10.36287/setsci.4.6.145
[2] Talo, M. (2019). Meme kanseri histopatalojik görüntülerinin konvolüsyonal sinir ağlari ile siniflandirilması. Fırat Üniversitesi Mühendislik Bilimleri Dergisi, 31(2): 391-398. https://doi.org/10.35234/fumbd.517939
[3] Kaya, Z., Sözmen, Ş., Usta, C., Elbaşı, E. (2018). Kanser Teşhisinde Otomatik Karar Verme. https://www.academia.edu/36301102/Kanser_Te%C5%9Fhisinde, accessed on January 27, 2023.
[4] Sevli, O. (2019). Göğüs Kanseri Teşhisinde Farklı Makine Öğrenmesi Tekniklerinin Performans Karşılaştırması. Avrupa Bilim ve Teknoloji Dergisi, (16): 176-185. https://doi.org/10.31590/ejosat.553549
[5] Parlar, T. (2020). Meme Kanseri Teşhis ve Prognozunda Radiomics ile Yapay Zeka Yöntemleri Kullanımı Hakkında Bir İnceleme . Avrupa Bilim ve Teknoloji Dergisi, Ejosat Özel Sayı 2020 (HORA), pp. 300-306. https://doi.org/10.31590/ejosat.780052
[6] Kaya, U., Yılmaz, A., Dikmen, Y. (2019). Sağlık Alanında Kullanılan Derin Öğrenme Yöntemleri. Avrupa Bilim ve Teknoloji Dergisi, (16): 792-808. https://doi.org/10.31590/ejosat.573248
[7] Eyüpoğlu, C., Yavuz, E. (2020). Kanser Teşhisi için Makine Öğrenmesi Tekniklerine Dayalı Yeni Bir Sınıflandırma Metodu. Bilecik Şeyh Edebali Üniversitesi Fen Bilimleri Dergisi, 7(2): 1106-1123. https://doi.org/bseufbd.742456
[8] Kılıçarslan, S., Adem, K., Cömert, O. (2019). Parçacık sürü optimizasyonu kullanilarak boyutu azaltilmiş mikrodizi verileri üzerinde makine öğrenmesi yöntemleri ile prostat kanseri teşhisi. Düzce Üniversitesi Bilim ve Teknoloji Dergisi, 7(1): 769-777. https://doi.org/10.29130/dubited.464092
[9] Kaplan, A., Güldogan, E., Arslan, A.K. (2019). Prediction of melanoma from dermoscopic images using deep learning-based artificial intelligence techniques. In 2019 International Artificial Intelligence and Data Processing Symposium (IDAP), Malatya, Türkiye, pp. 1-5. https://doi.org/ 10.1109/IDAP.2019.8875970
[10] Okal, G. (2019). Meme kanseri riskinin termal görüntüleme ve makine öğrenmesi ile saptanması. MS thesis. Pamukkale Üniversitesi Fen Bilimleri Enstitüsü, Denizli, Türkiye.
[11] Cengil, E., Çınar, A. (2020). Göğüs verileri metrikleri üzerinden kanser siniflandirilmasi. Dicle Üniversitesi Mühendislik Fakültesi Mühendislik Dergisi, 11(2): 513-519. https://doi.org/10.24012/dumf.578606
[12] Varol, A.B., İşeri, İ. (2019). Lenf kanserine ilişkin patoloji görüntülerinin makine öğrenimi yöntemleri ile siniflandirilmasi. Avrupa Bilim ve Teknoloji Dergisi, 2019: 404-410. https://doi.org/10.31590/ejosat.638372
[13] Bektaş, B., Babur, S. (2016). Machine learning based performance development for diagnosis of breast cancer. In 2016 Medical Technologies National Congress (TIPTEKNO), Antalya, Türkiye, pp. 1-4. https://doi.org/10.1109/TIPTEKNO.2016.7863129
[14] Kourou, K., Exarchos, T.P., Exarchos, K.P., Karamouzis, M.V., Fotiadis, D.I. (2015). Machine learning applications in cancer prognosis and prediction. Computational and Structural Biotechnology Journal, 13: 8-17. https://doi.org/10.1016/j.csbj.2014.11.005
[15] Ahmad, L.G., Eshlaghy, A.T., Poorebrahimi, A., Ebrahimi, M., Razavi, A.R. (2013). Using three machine learning techniques for predicting breast cancer recurrence. Journal of Health & Medical Informatics, 4(124): 3. https://doi.org/10.4172/2157-7420.1000124
[16] Cruz, J.A., Wishart, D.S. (2006) Applications of machine learning in cancer prediction and prognosis. Cancer Inform. 2: 59-77. https://doi.org/10.1177/117693510600200030
[17] Arısoy, M.Ö., Dikmen, Ü. (2014). Manyetik belirti haritalarinin histogram eşitleme yöntemi kullanilarak iyileştirilmesi. Yerbilimleri, 35(2): 141-168. https://doi.org/ 10.17824/huyuamd.23614
[18] Kurt, B., Nabiyev, V.V. (2010). Dijital mamografi görüntülerinin kontrast sınırlı adaptif histogram eşitleme ile iyileştirilmesi. Proceedings of the VII. Ulusal Tıp Bilişimi Kongresi, Gazimağusa, KKTC, 14-17.
[19] Qassim, H., Verma, A., Feinzimer, D. (2018). Compressed residual-VGG16 CNN model for big data places image recognition. In 2018 IEEE 8th Annual Computing and Communication Workshop and Conference (CCWC), Las Vegas, Nevada, USA, pp. 169-175. https://doi.org/10.1109/CCWC.2018.8301729
[20] Chollet, F. (2017). Xception: Deep learning with depthwise separable convolutions. In Proceedings of the IEEE Conference on Computer Vision and Pattern Recognition, pp. 1251-1258. https://doi.org/10.48550/arXiv.1610.02357
[21] Xia, X., Xu, C., Nan, B. (2017). Inception-v3 for flower classification. In 2017 2nd international conference on image, vision and computing (ICIVC), Chengdu, China, pp. 783-787. https://doi.org/10.1109/ICIVC.2017.7984661
[22] Zorgui, S., Chaabene, S., Bouaziz, B., Batatia, H., Chaari, L. (2020). A convolutional neural network for lentigo diagnosis. In The Impact of Digital Technologies on Public Health in Developed and Developing Countries: 18th International Conference, ICOST 2020, Hammamet, Tunisia, pp. 89-99. https://doi.org/10.1007/978-3-030-51517-1_8
[23] Theckedath, D., Sedamkar, R.R. (2020). Detecting affect states using VGG16, ResNet50 and SE-ResNet50 networks. SN Computer Science, 1: 1-7. https://doi.org/10.1007/s42979-020-0114-9
[24] Ferrucci, L.M., Cartmel, B., Turkman, Y.E., Murphy, M.E., Smith, T., Stein, K.D., McCorkle, R. (2011). Causal attribution among cancer survivors of the 10 most common cancers. Journal of Psychosocial Oncology, 29(2): 121-140. https://doi.org/10.1080/07347332.2010.548445