Bui Huy Hai![]()
© 2023 IIETA. This article is published by IIETA and is licensed under the CC BY 4.0 license (http://creativecommons.org/licenses/by/4.0/).
OPEN ACCESS
A common problem in ECG signal acquisition is the removal of artifacts and undesirable components to obtain a clean ECG signal, which helps to increase the accuracy of the clinical diagnosis process. However, with expecting received ECG in the high accuracy, the basic filters are not enough, because the ECG signal recording's often affected from differential sources with varying amplitudes and frequencies; furthermore, the recording process needs to be implemented via electrodes on the skin, which not only record the electrical activity of the heart, but also many other participating components such as Respiratory, Electroencephalogram (EEG), electrooculography (EOG), electromyography (EMG) with many artifact from outside. Therefore, conventional filters didn't meet the requirements of removing most of the impacting artifact components. In this study, the author has proposed a new method, that is to apply the independent component analysis (ICA) - combining wavelet transforms on each independent components to remove the abnormal noise, especially EMG to improve the accuracy of ECG signal recording with a correlation value of up to 0.971 compared to the desired.
artifact removal, biomedical signals, ECG recording, independent component analysis, ICA, wavelet transform
ECG is the variable electrical signal, emitted during the contractions of the heart; when the body has pathological phenomena, many diseases showed that they change the ECG value in terms of shape, amplitude and frequency. The acquisition of this accurate ECG signal has great significance for the patient's health care and clinical diagnosis, if the ECG signal used in the diagnosis is not accurate, it can lead to erroneous assessments of patient's condition, thereby giving the wrong treatment regimen. The research aimed at obtaining high-accuracy ECG signals is increasingly becoming a potential area of application; in addition, they also create a premise for automated device studies in the clinical diagnosis.
ECG is always affected by many interference components, such as the components of muscle artifact, electroencephalograms, white noise, etc., which cause abnormal variations of the received signal from frequency to amplitude [1]. The reason is that during the ECG recording process, the electrode not only records the signal emitted from the patient's heart, but also has to receive electrical signals from many different sources; The recording is performed through electrodes on the skin, which not only records the electrical activity of the heart, but is also affected by electrical signals from other parts of the body and is also affected by the emission sources from the outside; this is also the reason why the number of transmitters exceeds the number of signal receiver channels.
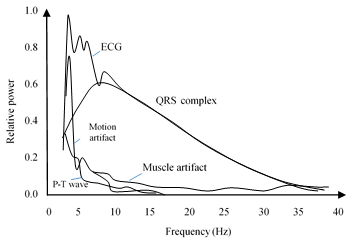
The energy distribution diagram of the components participating in the signal recording process is shown in Figure 1.
The common frequencies of the important components on the ECG [2]:
·Heart rate: 0.67–5 Hz (i.e., 40–300 bpm)
·P-wave: 0.67–5 Hz (corresponds to the cardiac rhythm)
·QRS: 10–50 Hz
·T-wave: 1–7 Hz
·High frequency potentials: 100–500 Hz
Figure 1. Amplitude-frequency distribution graph in ECG recording signal
Relative power spectra of QRS complex, P and T wave, muscle and motion artifacts based on an average value of 150 heart beats.
The energy distribution diagram of the components participating in the signal recording process is shown in Figure 1.
The common frequencies of the artifact and unwanted interferences on the recording signal (ECG):
·Muscle: 5–50 Hz
·Respiratory: 0.12–0.5 Hz (e.g., 8–30 bpm)
·External electrical: 50 or 60 Hz (A/C mains or line frequency)
·Other electrical: typically>10 Hz (muscle stimulators, strong magnetic fields, pacemakers with impedance monitoring)
The skin-electrode interface requires special note, as it is the largest source of interference, producing a DC component of 200-300 mV. Compare this to the electrical activity of your heart, which is in the range of 0.1 to 2 mV. The interference seen from this component is magnified by motion, either patient movement, or respiratory variation. In addition, the ECG signal (raw recording) also exhibits abnormal forms that have sudden changes in amplitude and shifts in frequency due to interference from unwanted components. Thus, in order to use the ECG signal in clinical assessment and diagnosis, we need to eliminate the effects of unwanted sources to obtain a clean ECG signal to accurately assess the patient's condition.
Many studies have focused on ECG recognition from multi-source signal combination with many different approaches such as canonical correlation analysis (CCA), principal component analysis (PCA) [3], maximum noise fraction (MNF), independent component analysis (ICA) [4], singular value decomposition (SVD)/ICA [5, 6], periodic component analysis, parallel linear predictor (PLP) filters [6], adaptive filter, support vector regression (SVR) [7]. However, an effective tool often used by researchers in recent years is ICA, because biomedical signals are always a complex combination of many components with ambiguous origins that are difficult to determine, ICA will analyze the independent components in the received signal combination to separate those sources.
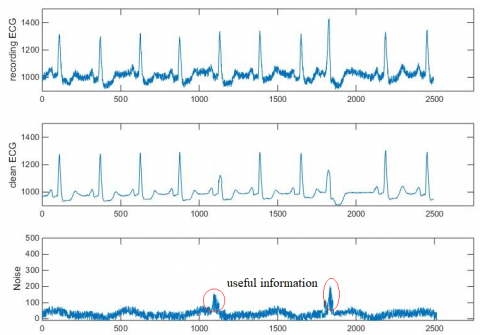
Although ICA's operation is relatively efficient, but its working depends on the size of the database system; if the number of signal sources on the body exceeds the number of data recording channels, the ICA separation process will not bring the desired accuracy; In many cases, components that are considered noisy and discarded still contain useful information as in Figure 2, causing information loss and signal distortion.
Figure 2. A component that are considered noise and discarded still contain useful information
On the other hand, an effective technique used in signal analysis and survey is wavelet transform (WT), which allows multi-resolution decomposition on different scales into wavelet coefficients, it also allows accurately positioning of frequency over time. Because noise components are often concentrated on certain frequency bands, eliminating ECG's artifact using thresholding on each wavelet coefficients would be a possible solution, because it offsets the limitations of ICA if we combine the two tools.
2.1 Database
ECG data from PhysioBank Database available at www.physionet.org were used for this investigation and in our experiments.
ECG recordings were randomly selected from 20 people (7 females and 13 males) of the 92-person dataset in the data bank. The data of each subject is fully recorded on the traditional ECG signal channels, including nine true unipolar leads: three limb potentials (LA, RA, LL) and six unipolar precordial leads (UV1: UV6); The received signal is filtered in the frequency range 0.5 to 150Hz; the sampling frequency of 800Hz is used in the artifact suppression experiments.
Each record is segmented into multiple 10-second data segments. Because the duration of recording data on each patient is different in the data bank, so we randomly selected 30 10-second data segments on each subject in our experiments; Thus, the dataset participating in the experiment is 600 data segments.
The subjects participating in the experiment were between 20 and 60 years old with an average age of 45.23 years; Most patients had a history of heart disease and were hospitalized.
The research team applied a 0.5Hz low-pass filter and a 50/60Hz band-pass filter to clean up the original database and improve the signal-to-noise ratio. A clean database of 20 subjects was also used to correlate the ECG signal after artifact suppression.
2.2 ICA and artifact suppression application
The operation of ICA is based on the following three assumptions:
(a) experimental data are stable combinations of biomedical signals and other interference sources.
(b) the recording signal originating from body sources is linear at the electrodes, the time delay of the signal from the source to the electrodes is negligible.
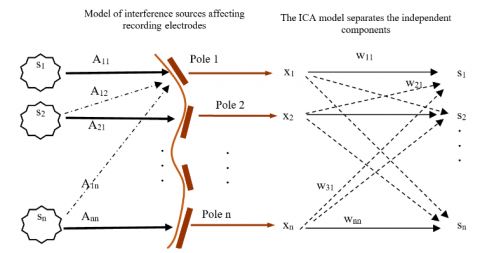
(c) the number of signal sources is not too much greater than the number of electrodes [8]. The ICA method is based on the principle depicted in Figure 3.
The recorded signal can be modeled as a linear combination of signals from different sources that have a statistically independent and non-Gaussian distribution according to the formula x=A.s; A (matrix n x n) is the matrix corresponding to the matrix mixing of independent signals from different sources; so x is the observed values only; the value of s is calculated by s=W.x with W=A−1. However, we cannot compute A−1 directly because we don't really have information about A và s.
Signal sources “si” needs to contain at least Gaussian components. Therefore, the measurement for maximize non-Gaussianity is the key to evaluating the tap weights of A matrix or the independent components. The sources are assumed to be independent but when mixed (add together) they become closer to Gauss. If the mixing is reversed somehow then the received signals will be less Gaussian. Hence the ICA estimation aims to minimize Gaussian i.e., maximize non-Gaussian because this will give us independent components.
Figure 3. Model of interference sources affecting recording electrodes and ICA's operating model
For s1, s2, …, sn: basic signal sources; electtrodes 1~ n: the electrodes that record the ECG signal; x1, x2, …, xn: the unipolar leads for data logging; A is the signal combination matrix and W is the inverse of the A matrix.
Negentropy J(Y) is used as a measure for Non-Gaussian Maximization. Negentropy is a quantity based on information theory called differential entropy $J(Y)=H\left(Y_{\text {gauss }}\right)-H(Y)$; where Y is a random variable, H(Ygauss) is the entropy value of a Gaussian variable corresponding to the correlation matrix Y. Because negentropy is a little difficult to calculate, so a number of approximation methods have been developed. $J(y)=\left\{E[G(Y)]-E\left[G\left(Y_{\text {gauss }}\right)\right]\right\}^2$ with nonlinear function G(.) can be selected according to one of the following two expressions: $G(u)=\frac{1}{a} \log \cos a u$ with 1≤a≤2 and $g(u)=u e^{-\frac{u^2}{2}}$; where g(.) is the derivative of functions G(.); corresponding to g(u)=tanh(au) and $G(u)=-e^{-\frac{u^2}{2}}$; calculate the weight “wi” described in the formula $w_i^{+}=E\left\{X g\left(w_i^T X\right)\right\}-E\left\{g^{\prime}\left(w_i^T X\right)\right\} w_i$. [9]
After separating the independent components, the components evaluated as the interference will be removed; the recombination of independent components (ICA inverse) will give us the final obtain as a clean signal.
2.3 Combining ICA and wavelet transform in artifact suppression
The operation of the ICA is based on the separation of the information source and the removal of independent components (ICs) that are appreciated to be interference, but with received signal, this can cause loss of useful information for diagnosis. To overcome this phenomenon, we perform interference removal in certain frequency bands on each independent component obtained. Thus, we will not completely remove an independent component, but will continue to split them into many different subbands, the process of sub-band decomposition will be based on the frequency spectrum of the important components in the ECG recording signal [10].
2.3.1 Frequency spectrum of the received signal
The spectrum varies with different arrhythmia phenomena; the power spectrum of the primary ECG components observed in the frequency range from 1 to 20 Hz; amplitude decreases as frequency increases and rapidly disappears above 12 Hz. Frequency components from 1 to 12 Hz are selected to recognize multiple ECG beats. These spectra are not disturbed by high frequency components above 20 Hz such as power line artifact (50/60 Hz) and muscle artifact, nor by very low frequency components (<0.5 Hz) such as baseline drift and respiratory [2].
Therefore, power line noise, very low frequency and high frequency components are eliminated without affecting the frequency domain performance.
As analyzed above, the common frequencies of important components on ECG: Heart rate and P wave in the range of 0.67~5Hz, T wave in the range of 1~7Hz, QRS component in the QRS range: 10 - 50 Hz. Therefore, Muscle artifacts in the range of 5~50Hz is a component that has a great influence on the ECG recording signal; in addition, there are many other components (>10Hz) such as muscle stimulator [11], strong magnetic interference, pacemaker and impedance monitoring… also have a significant influence on the ECG signal. So, we will analyze wavelet coefficients on each independent component of the ICA to eliminate unexpected components.
2.3.2 Wavelet transform
The traditional signal processing method is Fourrier transform, which is still performing the task of bandwidth frequency decomposition; the short time Fourier transform (STFT) is used to separate the signal into frequency components different; they use a window function for a sufficiently short time interval, such that the portion of the signal in the window function can be treated as a stationary signal, and Fourier transform is used for frequency analysis.
Determining the frequency of the signal appearing in this very short time interval will give us ability to locate the signal frequency at each instant. However, as we know, in order to obtain exactly a frequency component, each frequency component must correspond to individual window width (w=1/f), or window size corresponds to a signal period. For a signal with the wide spectrum band, the fixed window size is the limitation of STFT. Because when analyzing all frequency components over a wide frequency range, in order to achieve high accuracy, the window size must change flexibly according to the occurrence of different frequencies.
A wavelet is a mathematical function used to divide a given function or continuous-time signal into different scale components. The wavelets are scaled and translated copies (known as daughter wavelets) of a finite-length or fast-decaying oscillating waveform (known as the mother wavelet). The wavelet transform overcomes the limitation of the windowed Fourier transform by scaling the bandwidth of the filter inversely to the frequency. While each box of the windowed Fourier transform has the same bandwidth, each level of the wavelet transform has the same Q as defined as Q=∆f/f0. This gives the transform the desired time resolution for the higher frequency portions of the signal and the desired frequency resolution for lower frequency portions.
Discrete wavelet transform (DWT) based on subband coding was developed to obtain fast computation of wavelet transform. We can understand the DWT transform as applying a set of high-pass and low-pass filters, The DWT decomposes the signal into details and approximation parts, at some scale the details contain mostly the insignificant noise and can be removed or zeroed out using thresholding without affecting the signal.
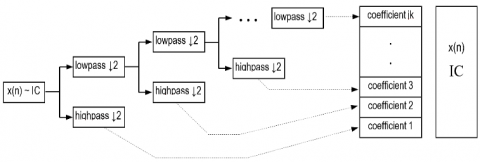
The signal through the high-pass filters we get the detail coefficients and through the low-pass filters we get the approximation coefficients, then they must be down-sampled by a factor of 2. Wavelet decomposition at level 5 as depicted in the Figure 4 [12].
Figure 4. Wavelet decomposition at level 5
With signal frequency in the range of 0~150Hz, wavelet decomposition will be performed at level 5. From this, we can obtain wavelet coefficients (aij) corresponding to the important bands of the ECG signal, such as T-wave, P-wave, QRS set, etc., to eliminate concentrated interference in each area, increasing the efficiency of the solution. Six bands obtained after the wavelet transform are follows as: a7 frequency band have range of 0.5~4.7Hz; a6 frequency band have range of 4.7~9.4Hz; a5 frequency band have range of 9.4~18.8 Hz; a4 frequency band have range of 18.8~37.5 Hz; a3 frequency band have range of 56.5~75Hz; a2 frequency band have range of 37.5~56.5Hz and a1 frequency band have range of 75~150Hz.
The input signal (ECG) passes through the ICA system and is analyzed into independent components; unlike with the traditional artifact suppression method by ICA, the independent components are not removed but are further decomposed by wavelet transform. The process after wavelet decomposition, we will obtain the coefficients (aij), as depicted in Figure 5.
Figure 5. The basic structure of the wavelet decomposition in each Independent Component (IC)
Soft threshold level will be performed on each coefficient aij; the threshold value was set according to the formula as below $T=\sigma \sqrt{2 \log (k)}$ [13].
With a sampling rate of 800Hz, a value of k (a 1.5-second segment of data) corresponds to 1200 samples. $T=\sigma \sqrt{2 \log (k)} \sim 2,48 \sigma ;$ with $\sigma^2=\frac{\text { mean }\left(\left|a_{\mathrm{ij}}\right|\right)}{c}$ is the mean value of analyzed coefficient aij, c is the constant coefficient (c was bằng 0.825).
Thus, T will be a soft threshold, its value depends greatly on the magnitude of σ; in other words, the value of T depends mainly on the amplitude of the coefficients (aij). When there are anomalous components impacting, the amplitude (aij) will change suddenly; The T value also immediately changes dramatically making to block out the impact of the interference. Threshold T limit the amplitude values of the coefficients (aij) according to the following:
${{\hat{a}}_{jk}}=\left\{ \begin{align} & sign({{a}_{jk}})(\left| {{a}_{jk}} \right|-T)\begin{matrix} {} & if & \left| {{a}_{jk}} \right|>T \\\end{matrix} \\ & \begin{matrix} {} & {} & {} & 0 & {} & {} & {} \\\end{matrix}if\begin{matrix} {} \\\end{matrix}\left| {{a}_{jk}} \right|<T \\\end{align} \right.$ (1)
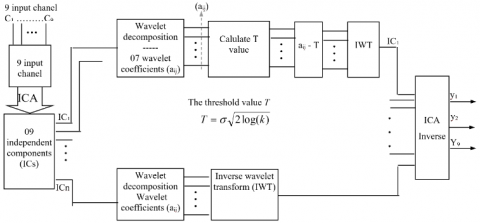
After removing the mutant signal components from the wavelet coefficients (aij), the next step to perform the inverse wavelet transform (IWT) to obtain the clean IC components. The inverse ICA transform will give us a clean signal with artifact components removed. The system implementation model is shown in Figure 6.
Figure 6. Artifact removal model based on combination of ICA and wavelet decomposition
Artifact suppression for the ECG signal has been experimentally implemented on the basis of the biomedical data bank, available at www.physionet.org. The participants in the experiment were patients being monitored at Campbelltown hospital - Australia [14], the new approach gave relatively positive results. Before being put into the wICA system to eliminate artifacts, the data is put through a bandpass filter with a cutoff frequency from 0.5 ~ 150Hz to eliminate some of the basic noise components such as sweat noise, electrode noise, skin surface noise … so that the system can focus mainly on eliminating complex, high-mutant noise components such as muscle artifact. A clean signal system on all subjects participating in the experiment is used as a reference signal to evaluate the correlation value with the noise cancellation signal after artifact removal through the wICA model.
A correlation coefficient is a numerical measure of some type of correlation, meaning a statistical relationship between two variables. In our study, the correlation value will be used to evaluate the correspondence of the signal after artifact suppression and the reference signal. The efficiency of the artifact suppression process will be based on the correlation value between the output signal of the wICA system and desired response (the reference signal), the optimal artifact suppression determined when Rmax=1. The window width k is set to 1200 corresponding to 1.5 second of data and the wavelet function used is Daubechies. The new approached method will be evaluated based on the comparison with the traditional method ICA on all of 9 channels. The correlation coefficient between the signal after denoising in the both of methods ICA, wICA and the reference signal (desired signal) [15] on 9 channels is described in Table 1.
Table 1. Correlation values between the output signal of the ICA, wICA system and the reference signal
|
No |
Chanel |
ICA |
wICA |
|
R value |
R value |
||
|
1 |
I |
0.924 |
0.959 |
|
2 |
II |
0.914 |
0.963 |
|
3 |
III |
0.928 |
0.976 |
|
4 |
V1 |
0.911 |
0.965 |
|
5 |
V2 |
0.928 |
0.971 |
|
6 |
V3 |
0.938 |
0.978 |
|
7 |
V4 |
0.921 |
0.981 |
|
8 |
V5 |
0.898 |
0.967 |
|
9 |
V6 |
0.902 |
0.981 |
|
Mean |
0.918 |
0.971 |
According to the study of Chiu et al. [16], we have the following calculated values, for:
$R=\frac{C_{x y}}{\sigma_x \sigma_y}$; Cxy is the covariance of x & y, R ≤ 1
$\begin{gathered}C_{x y}=E\left\{\left(x-\eta_x\right)\left(y-\eta_y\right)\right\} ; E\{x\}=\eta_x, E\{y\}=\eta_y ; \\ \sigma_x=\sqrt{E\left\{\left(x-\eta_x\right)^2\right\}} ; \sigma_y=\sqrt{E\left\{\left(y-\eta_y\right)^2\right\}} .\end{gathered}$
In this paper, the author has presented a new artifact suppression method that combines the strengths of two signal processing tools, which are independent components analysis and wavelet transform, this method is also called is "Wavelet enhanced ICA" or (wICA). Instead of completely removing the independent components, we have implemented the decomposition of ICs based on wavelet transform into different coefficients and given a soft threshold level to remove artifacts on each wavelet coefficient.
The proposed method has proved to have many advantages over the traditional methods used previously based on the positive data of experimental results. Specifically, the correlation coefficient between the reference signal (the desired signal) with the suppressed artifact signal from the wICA method proved to be superior to that of the ICA method, based on correlation coefficient 0.9690 vs 0.9186.
This noise suppression model can be effectively applied to the noise cancellation of the ECG signal in particular, or the biomedical signal in general; It is also effective in applying noise suppression to multi-channel data acquisition system similarly. However, the data are only taken from the biomedical data bank to apply in the experimental process, many specific pathological states of cardiovascular problems have not been mentioned. In fact, there are many different cardiovascular conditions that greatly influence the recording of ECG signals. So a more comprehensive assessment will be the task of the future research team, with the number of participal subject and the number of data segments per each subject also increasing significantly in the next experiments.
The author gratefully acknowledges the University of Economics – Technology for Industries for supporting this work.
[1] Buendía-Fuentes, F., Arnau-Vives, M.A., Arnau-Vives, A., Jiménez-Jiménez, Y., Rueda-Soriano, J., Zorio-Grima, E., Osa-Sáez, A., Martínez-Dolz, L.V., Almenar-Bonet, L., Palencia-Pérez, M.A. (2012). High-bandpass filters in electrocardiography: Source of error in the interpretation of the ST segment. International Scholarly Research Notices, 2012: 706217. https://doi.org/10.5402/2012/706217
[2] Lin, C.H. (2008). Frequency-domain features for ECG beat discrimination using grey relational analysis-based classifier. Computers & Mathematics with Applications, 55(4): 680-690. https://doi.org/10.1016/j.camwa.2007.04.035
[3] Shoker, L., Sanei, S., Chambers, J. (2005). Artifact removal from electroencephalograms using a hybrid BSS-SVM algorithm. IEEE Signal Processing Letters, 12(10): 721-724. https://doi.org/10.1109/LSP.2005.855539
[4] Zhang, Z., Li, H., Mandic, D. (2016). Blind source separation and artefact cancellation for single channel bioelectrical signal. In 2016 IEEE 13th International Conference on Wearable and Implantable Body Sensor Networks (BSN), pp. 177-182. https://doi.org/10.1109/BSN.2016.7516255
[5] Ziani, S., Jbari, A., Bellarbi, L., Farhaoui, Y. (2018). Blind maternal-fetal ECG separation based on the time-scale image TSI and SVD–ICA methods. Procedia Computer Science, 134: 322-327. https://doi.org/10.1016/j.procs.2018.07.179
[6] Taha, L., Abdel-Raheem, E. (2020). A null space-based blind source separation for fetal electrocardiogram signals. Sensors, 20(12): 3536. https://doi.org/10.3390/s20123536
[7] Zheng, W., Hongxing, L., Jianchun, C. (2012). An adaptive filtering in phase space for fetal ECG estimation from an abdominal ECG signal and a thoracic ECG signal. IET Signal Process, 6(3): 171-177. https://doi.org/10.1049/iet-spr.2010.0263
[8] Chiu, C.C., Hai, B.H., Yeh, S.J., Liao, K.Y.K. (2014). Recovering EEG signals: Muscle artifact suppression using wavelet-enhanced, independent component analysis integrated with adaptive filter. Biomedical Engineering: Applications, Basis and Communications, 26(05): 1450063. https://doi.org/10.4015/S101623721450063X
[9] Zhou, W. (2002). Removal of ECG artifacts from EEG using ICA. In Proceedings of the Second Joint 24th Annual Conference and the Annual Fall Meeting of the Biomedical Engineering Society Engineering in Medicine and Biology, pp. 206-207. https://doi.org/10.1109/IEMBS.2002.1134458
[10] Foresta, F.L., Mammone, N., Morabito, F.C. (2005). Artifact cancellation from electrocardiogram by mixed wavelet-ICA filter. In Neural Nets, pp. 78-82. https://doi.org/10.1007/11731177_12
[11] Panda, R., Pati, U.C. (2012). Removal of artifacts from electrocardiogram using digital filter. In 2012 IEEE Students' Conference on Electrical, Electronics and Computer Science, pp. 1-4. https://doi.org/10.1109/SCEECS.2012.6184767
[12] Chiu, C.C., Hai, B.H., Yeh, S.J. (2014). Recognition of sleep stages based on a combined neural network and fuzzy system using wavelet transform features. Biomedical Engineering: Applications, Basis and Communications, 26(02): 1450029. https://doi.org/10.4015/S101623721450029X
[13] Chiu, C.C., Hai, B.H., Yeh, S.J. (2014). Recognition of sleep stages based on a combined neural network and fuzzy system using wavelet transform features. Biomedical Engineering: Applications, Basis and Communications, 26(02): 1450029. https://doi.org/10.1016/j.jneumeth.2006.05.033
[14] Gargiulo, G.D., McEwan, A.L., Bifulco, P., Cesarelli, M., Jin, C., Tapson, J., Thiagalingam, A., Van Schaik, A. (2013). Towards true unipolar ECG recording without the Wilson central terminal (preliminary results). Physiological Measurement, 34(9): 991. https://doi.org/10.1088/0967-3334/34/9/991
[15] Berwal, D., Vandana, C.R., Dewan, S., Jiji, C.V., Baghini, M.S. (2019). Motion artifact removal in ambulatory ECG signal for heart rate variability analysis. IEEE Sensors Journal, 19(24): 12432-12442. https://doi.org/10.1109/JSEN.2019.2939391
[16] Chiu, C.C., Lin, T.H., Liau, B.Y. (2005). Using correlation coefficient in ECG waveform for arrhythmia detection. Biomedical Engineering: Applications, Basis and Communications, 17(03): 147-152. https://doi.org/10.4015/S1016237205000238