Qiuwen Wang![]() | Pengxiang Wang
| Pengxiang Wang![]() | Yongzhi Chang*
| Yongzhi Chang*![]()
© 2023 IIETA. This article is published by IIETA and is licensed under the CC BY 4.0 license (http://creativecommons.org/licenses/by/4.0/).
OPEN ACCESS
The financial technology service industry involves a large number of image and text information processing tasks. By automatically processing images and text information, financial institutions can greatly reduce labor costs, improve overall operational efficiency, and help financial institutions identify and predict risks more accurately, thereby improving risk management capabilities. The existing image symbol recognition and scene text detection methods may be affected in terms of recognition accuracy when processing complex scenes, low-resolution images or texts affected by obstacles, distortions and other factors. To this end, this study conducts an in-depth study on the application of deep learning-based intelligent image recognition in financial technology services. It elaborates the application scenarios of image symbol recognition and scene text detection in financial technology services. The ASTER model is improved, and the combination of attention mechanism sequential decoding can effectively capture local information and global dependencies in the feature sequence, thereby improving the recognition accuracy of the image symbol recognition model. By focusing on the center point position information of the text, pixels with the same center point are aggregated to reduce the interference between adjacent texts to some extent, achieving more accurate text segmentation. Experimental results validate the effectiveness of the method in this study.
deep learning, intelligent image recognition, financial technology services
With the rapid development of technologies such as the Internet, big data, and artificial intelligence, the financial technology service industry is undergoing unprecedented changes [1-4]. In this process, deep learning-based intelligent image recognition technology has attracted widespread attention as an important computer vision technology [5-11]. The financial technology service industry involves a large number of image and text information processing tasks, such as customer identity verification, loan approval, and credit evaluation. By automatically processing images and text information, financial institutions can greatly reduce labor costs, improve overall operational efficiency, and help financial institutions identify and predict risks more accurately, thereby improving risk management capabilities [12-23]. Therefore, the application of deep learning technology will bring tremendous changes to the financial technology service industry. Studying the application of deep learning-based intelligent image recognition in the financial technology service industry is conducive to promoting the development of the entire industry and improving the popularity and accessibility of financial services.
In recent years, deep convolutional neural networks have shown superior performance in visual tasks such as image classification. Based on the deep architecture. Zhu et al. [24] designed a new method to deal with automated financial recognition problems, namely identifying value-added tax invoices, financial-related documents and other financial-related images. The method includes three steps: First, the original image is preprocessed, and the enhanced image is separated into four patches for further processing; therefore, the resulting image blocks will be the input for the deep convolutional neural model used for training purposes; In the last step, the final classification is determined using the four predicates obtained from the previous step. The experimental results show that this method can perform high-performance financial image classification. Financial notes are promissory notes or bills issued to obtain money financing without reason. Financial study identification system is a hot issue in the current document analysis and recognition system. It covers a series of processes such as study classification, image processing, character segmentation and recognition, file image compression, etc. Tian et al. [25] studied multiple aspects of the financial bill recognition system. On this basis, a financial bill recognition system with application value has been established. Through substantial experimental testing and actual application, this method has better classification performance and higher processing efficiency. It has been widely used in bank note recognition processing systems. Zhang et al. [26] first analyzed the different characteristics of 482 kinds of financial bills, divided various financial bills into three categories, and proposed different recognition modes for each category. These recognition modes can meet almost all types of financial bill recognition needs. Secondly, for the fixed format types of financial bills (accounting for 68.27% of the total bill types), a simple and efficient network called Faster R-CNN-based Financial Bill Fast Detection Network (FTFDNet) is proposed. In addition, in order to obtain higher recognition accuracy based on the characteristics of financial bill text, improvements were made to the loss function, region proposal network (RPN) and non-maximum suppression (NMS) to make FTFDNet pay more attention to text.
Although image symbol recognition and scene text detection have achieved some success in financial technology services, there are still some deficiencies and challenges. The existing image symbol recognition and scene text detection methods may be affected in terms of recognition accuracy when processing complex scenes, low-resolution images or texts affected by obstacles, distortions and other factors. This may lead to errors in financial business processing, thereby affecting customer satisfaction and business efficiency. The images and text data in financial business processing are often affected by factors such as noise, blur, and illumination. The existing recognition methods have limited robustness to these interference factors, which may lead to reduced recognition performance. To this end, this study conducts an in-depth study on the application of deep learning-based intelligent image recognition in financial technology services. Chapter 2 of the article elaborates the application scenarios of image symbol recognition and scene text detection in financial technology services. The ASTER model is improved, and the combination of attention mechanism sequential decoding can effectively capture local information and global dependencies in the feature sequence, thereby improving the recognition accuracy of the image symbol recognition model. Chapter 3 of the article aggregates pixels with the same center point by focusing on the center point position information of the text, reducing the interference between adjacent texts to some extent, achieving more accurate text segmentation. Experimental results validate the effectiveness of the method in this study.
Image symbol recognition and scene text detection have many application scenarios in financial technology services. These technologies enable financial institutions to process various types of data more effectively, improve service quality and customer satisfaction. Banks can use image symbol recognition technology to automatically identify and process information on checks, such as date, amount, signature, etc. This automated processing can improve efficiency, reduce errors and lower labor costs. Financial institutions can use scene text detection technology to identify and process key information on invoices, such as invoice numbers, purchase dates, amounts, etc. This helps to improve the processing speed and accuracy of reimbursement, auditing and other businesses. Image symbol recognition and scene text detection technologies can help financial institutions automatically process information on credit card bills, such as transaction details, fees, etc. This can help improve the accuracy and efficiency of bill processing. These technologies can also be used to automatically identify and process key terms and conditions in contracts, thereby improving the efficiency of contract review and management.
In the application scenarios of financial technology services, high requirements are placed on the accuracy and speed of image symbol recognition. Figures 1 and 2 show the encoding and decoding processes of the ASTER model. This study improves the ASTER model. The combination of attention mechanism sequential decoding can effectively capture local information and global dependencies in the feature sequence, thereby improving the recognition accuracy of the model. The optimized decoding process is shown in Figure 3. At the same time, by introducing the connectionist temporal classification (CTC) decoding process, the feature sequence can be aligned and corrected during the training process, which helps to accelerate the convergence of the model. This is of great significance for financial technology service scenarios that require rapid response and processing. By combining the attention mechanism and CTC decoding process, the improved ASTER model can better deal with factors such as noise, occlusion, and distortion in the image, and improve the recognition performance of the model in complex scenes.
In this study, the mapping from the attention sequence to the sequence model is realized by constructing a unidirectional recursive network. The network model continuously iterates to generate a symbol sequence with an interval of Y, represented by (t1,...,ty). The decoder first needs to calculate the attention depth. Assuming that the variable weights that can be used for model training are represented by μ, Q, and C, $s_y \in E^b$, the attention mechanism is given by the following formula:
$r_{y, u}=\mu^Y \operatorname{Tanh}\left(Q_{A_{y-1}}+C g_u+n\right)$ (1)
$\beta_{y, u}=\exp \left(r_{y, u}\right) / \sum_{u^{\prime}=1}^b \exp \left(r_{y, u^{\prime}}\right)$ (2)
Taking the above variable weights as the basic parameters, the calculation process of the decoder can continuously linearly convert the G column vector into glimpse value encoding:
$h_y=\sum_{u=1}^b \beta_{y, u} g_u$ (3)
The converted glimpse value encoded vector is input into the recursive unit as a whole. The algorithm outputs a new state vector as shown in the following formula.
$\left(Z_y, A_y\right)=\Omega\left(A_{y-1},\left(h_y, d\left(t_{y=1}\right)\right)\right)$ (4)
In CTC, for any sequence $Z=\left[z_1, z_2, z 3, \ldots z_Y\right\}$ mapping sequence represented by $T=\left[t_1, t_2, t_3, \ldots, t_B\right]$, where $O_y(\beta \mid Z)$ is the distribution value representing its distribution on [t1,t2,t3,...,tB,γ]. The following formula gives the loss function calculation formula when the input sequence is z and the true value sequence is m.
$L_{E T}=-\ln o(m \mid z)=-\ln o(t \mid m)$ (5)
Let the variable learning parameters be represented by β. The composite loss function combining CTC classification and attention decoding mechanism is given by the following formula:
$L=(1-\beta) \times L_{A T}+\beta \times L_{E T}$ (6)
Figure 1. Model encoding process
Figure 2. Model decoding process
Figure 3. Optimizing the decoding process
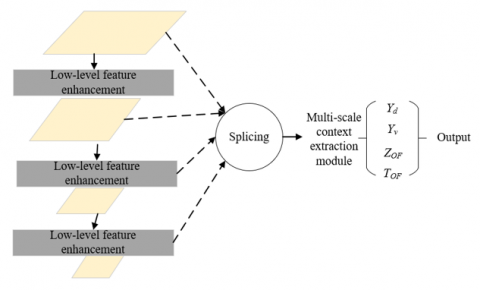
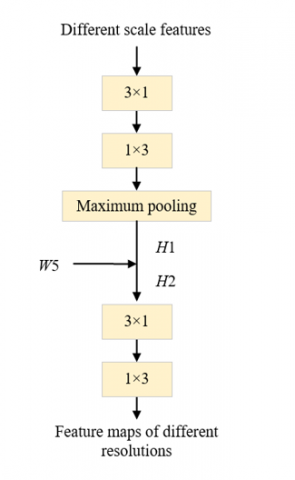
In the application scenario of scene text detection in financial technology services, the existing methods for detecting adjacent texts may not be able to accurately distinguish between adjacent texts, especially in financial statements or bills, leading to recognition errors. When the size, shape and orientation of the text are irregular, existing methods may be difficult to accurately detect the text boundary, thereby affecting the subsequent recognition and processing. Existing methods may be more sensitive to noise and background interference in the image, leading to false positives and missed detections. In some complex scenarios, such as low contrast, blurry or uneven illumination, existing methods may perform poorly. This study focuses on the center point position information of the text, aggregates pixels with the same center point to a certain extent to reduce the interference between adjacent texts, and achieves more accurate text segmentation. This method can adapt to texts of different sizes, shapes and orientations, and therefore has better performance in processing complex text scenarios in financial technology services. Figure 4 shows the principle of the text detection algorithm based on the center point position information, and the low-level feature enhancement network framework adopted is shown in Figure 5.
Specifically, the text detection application network uses two branches to segment the complete text area segmentation map $y_d$ and the text center area segmentation map $Y_v$, as well as regression ZOF and TOF. Subsequently, $y_d$ and $y_v$ are binarized by thresholds $y_d$ and $y_v$, respectively, and the output obtained is the background or text in the text image. Then, connected domains with an area less than 200 pixels and noise in $y_v$ are filtered. Because $y_v$ is a subset of $y_d$, there is:
$Y_v=Y_d \times Y_v$ (7)
Further, the connected domains in $y_v$ are labeled. First, all unlabeled text boundary pixels in the text image are obtained by the following formula. These pixels can be considered as pixels outside $y_v$ but inside $y_d$:
$Y_n=Y_d-Y_v$ (8)
The text detection algorithm proposed in this study mainly uses the predicted text center point as a guide to differentiate between adjacent texts. Therefore, it is necessary to first calculate the text center point $p\left(z_p, t_p\right)$ of the text boundary element $o(z, t)$:
$z_p=Z_{O F}(z, t)+z$ (9)
$t_o=T_{O F}(z, t)+t$ (10)
In order to solve the problem of pixel adhesion at adjacent text boundaries, this study assigns the instance of p(zp,tp) to o(z,t), indicating that o(z,t) belongs to the text where p(zp,tp) is located.
In order to enhance the model's ability to distinguish between adjacent texts, a lightweight multi-scale context extraction module is introduced in scene text detection. This module can adaptively extract different context information according to the background and text length. This enables the model to flexibly adjust the feature extraction strategy according to the actual scene, thereby improving detection performance. By extracting context information at multiple scales, the model can better deal with interference factors such as noise, occlusion, and illumination changes in the image, while helping to distinguish between densely arranged or adjacent texts of different sizes, further improving the text detection accuracy of the model. At the same time, this module adopts a lightweight design to reduce the computational complexity and memory consumption of the model. This enables the model to have a faster running speed and wider applicability in practical applications, especially in financial technology services, rapid response and processing capabilities are crucial. Figure 6 shows the network framework of the multi-scale context extraction module.
In order to suit the scene text detection application scenarios in financial technology services, the network structure of this study adopts a feature pyramid network (FPN) equipped with ResNet50. FPN extracts multi-scale features in a top-down structure, which can capture information at different levels. This enables the model to better handle various text scenarios in financial technology services, such as texts of different sizes, orientations and shapes. Using the bottom-up feature fusion method, high-level semantic information and low-level detail information can be effectively combined. This helps to improve the accuracy and robustness of scene text detection in financial technology services.
This study needs to generate 4 types of labels: text area labels, text center area labels, X coordinate offset labels, and Y coordinate offset labels according to the given bounding box coordinates to train the model. Among them, the text area label initializes a matrix with the same size as the input image filled with all zeros according to the given text vertex coordinates. Then, the values in the polygon area formed by the text vertices are set to 1, and the background area values are set to 0. For the text center area label, first, calculate the area and perimeter of the polygon. Then, shrink the polygon formed by the text vertices by 0.75*4/P pixels. Then, in a matrix with the same size as the input image filled with all zeros, set the values in the shrunk polygon area to 1 and the background area values to 0. For the X coordinate offset label, select 2 adjacent vertices in the middle of the top and bottom of the text area to form a quadrilateral ABCD. Calculate the distance from each pixel to quadrilaterals AB and CD, and use these distances as the X coordinate offset label. For the Y coordinate offset label, select 2 adjacent vertices in the middle of the top and bottom of the text area to form a quadrilateral ABCD. Calculate the distance from each pixel to quadrilaterals BC and DA, and use these distances as the Y coordinate offset label. Through the above steps, 4 types of labels can be generated, representing text areas, text center areas, X coordinate offsets and Y coordinate offsets.
The center point of the text instance is the midpoint P of ABCD, and the calculation formula of P(Zp,Tp) of P point is given by the following formula:
$z_p=\frac{z_s+z_n+z_v+z_f}{4}$ (11)
$t_p=\frac{t_s+t_n+t_v+t_f}{4}$ (12)
The X coordinate offset and Y coordinate offset of o(z,t) from p(zp,tp) can be obtained by the following formula:
$Z_{O F}(z, t)=z_o-z$ (13)
$T_{O F}(z, t)=t_o-t$ (14)
The scene text detection method proposed in this study includes multiple tasks, and the loss function expression is given by the following formula:
$L=\eta_1 L_d+\eta_2 L_v+\eta_3 L_{R E}$ (15)
$L_{R E}=L_z+L_t$ (16)
Assuming that the loss of the area segmentation map, text center area segmentation map, X coordinate offset map, and Y offset map areLd, Lv, Lz, and Lt respectively, and the hyperparameters are η1, η2, η3. Yd and Yv, and ZOF and TOF functions are implemented by dic loss and smoothL1loss respectively. Assuming that the predicted text area and the corresponding label are A and H respectively, the loss functions of Lv and Ld are the same. The predicted values and labels of the X coordinate offset map are $\mu_z$ and $\mu^* z$ respectively, defined as follows:
$L_d(A, H)=1-\frac{2 \sum_{z, t}\left(A_{z, t} \times H_{z, t}\right)}{\sum_{z, t} A_{z, t}^2+\sum_{z, t} H_{z, t}^2}$ (17)
$L_z\left(\mu_z, \mu_z^*\right)=S M_{M 1}\left(\mu_z, \mu_z^*\right)$ (18)
$S M_{L 1}(z)=\left\{\begin{array}{l}0.5 z^2, \ { if }|z|<1 \\ |z|-0.5, { others }\end{array}\right.$ (19)
Figure 4. Principle of text detection algorithm based on center point position information
Figure 5. Low-level feature enhancement network framework
Figure 6. Network framework of multi-scale context extraction module
Table 1 shows a comparison of image character recognition model results. According to the data in the above table, it can be seen that the method in this study exceeds the other four methods in accuracy, recall rate and F1-measure, indicating that the method in this study performs well in the image character recognition task. In terms of accuracy, the accuracy of this study's method reaches 0.98, which is the highest of all methods. This means that the method in this study has the lowest probability of recognition errors when recognizing characters. In contrast, the accuracy of other methods is below 0.98, the lowest of which is DNNs, at 0.90. In terms of recall rate, the recall rate of this study's method reaches 0.89, which is also the highest of all methods. This means that the proportion of characters that can be recognized out of all characters that should be recognized is the highest in this study's method. In contrast, the recall rates of other methods are below 0.89, the lowest of which is LSTM, at 0.72.
The F1-measure of this study's method reaches 0.93, which is also the highest of all methods. F1-measure is the harmonic mean of accuracy and recall rate. It comprehensively considers accuracy and recall rate, and is a relatively comprehensive evaluation index. In contrast, the F1-measure of other methods is below 0.93, the lowest of which is LSTM, at 0.72.
In summary, the performance of this study's method in the image character recognition task is better than other methods.
Table 1. Comparison of image character recognition model results
|
Algorithm name |
Accuracy |
Recall rate |
F1-measure |
|
CNN |
0.91 |
0.81 |
0.81 |
|
LSTM |
0.92 |
0.72 |
0.72 |
|
DNNs |
0.90 |
0.82 |
0.81 |
|
CRNN |
0.97 |
0.85 |
0.84 |
|
This study’s method |
0.98 |
0.89 |
0.93 |
Table 2. Comparison of image character recognition model ablation results
|
Model |
Accuracy |
Recall rate |
F1-measure |
|
Traditional ASTER |
0.91 |
0.81 |
0.86 |
|
Only introduce attention mechanism |
0.93 |
0.82 |
0.93 |
|
Only introduce CTC |
0.92 |
0.82 |
0.95 |
|
This study’s method |
0.94 |
0.86 |
0.97 |
Figure 7. Loss function curve
Figure 7 shows the change in loss function value with the increase of the number of iterations before and after improvement. It can be observed that after improvement, the value of the loss function is significantly lower than before improvement at each iteration stage, indicating that the performance of the model has been significantly improved. Before improvement, the model only used an attention-based feature sequence encoding mechanism, while after improvement, the model introduced the CTC decoding process and attention mechanism. The CTC decoding process can align the feature sequence during the decoding process and correct it continuously, which effectively improves recognition accuracy and model calculation convergence speed. At the same time, the attention mechanism can help the model focus on the most important part when processing sequence data, which is particularly important in character recognition tasks. Therefore, introducing the CTC decoding process and attention mechanism is effective for improving model performance. This improvement enables the model to have higher accuracy and faster convergence speed when processing complex character recognition tasks, and therefore has great value for image character recognition tasks in financial technology services.
Table 2 presents the results of ablation experiments. It can be seen that the accuracy of the traditional ASTER is 0.91, the recall rate is 0.81, and the F1-measure is 0.86. This is the performance of the benchmark model, and the performance of other models will be compared with this. After introducing only the attention mechanism, the accuracy of the model is 0.93, the recall rate is 0.82, and the F1-measure is 0.87. Compared with the traditional ASTER, this model has improved performance in all performance indicators, indicating that the introduction of the attention mechanism can help the model focus on important information better and improve model performance.
The model with only CTC introduced has an accuracy of 0.92, a recall rate of 0.82, and an F1-measure of 0.88. Compared with the traditional ASTER, this model has improved performance in all performance indicators, indicating that the introduction of CTC can help the model better align the feature sequence during the decoding process and improve model performance.
This study's method: the accuracy is 0.94, the recall rate is 0.86, and the F1-measure is 0.90. This is the best performance of all models. This shows that introducing attention mechanisms and CTC together can further improve model performance.
Table 3 shows the ablation experiment results of the scene text detection model, including the performance of the benchmark model, Faster R-CNN and the method in this study under different configurations. For each model, three characteristics are examined: center point position perception, multi-scale context extraction module and local feature enhancement module. The benchmark model does not use any of these three characteristics, while the method in this study uses all three of these characteristics. By comparing the performance of these two models, it can be seen that the method in this study has significantly improved recall rate, precision and F-value, indicating that the introduction of these three characteristics is helpful for improving model performance.
Furthermore, it can be observed that models 1 to 4 introduce different characteristics. Model 1 only introduces the center point position perception, model 2 further introduces the multi-scale context extraction module, models 3 and 4 further introduce the local feature enhancement module, but model 4 uses a 3×3 local feature enhancement module. By comparing the performance of these models, it can be seen that the introduction of each feature can improve performance, and the performance of this study's method (introducing all features) is the best.
In addition, it can be seen that the performance of Faster R-CNN changed after introducing these characteristics. By comparing the performance of Faster R-CNN under different configurations, it can be seen that these characteristics can also improve the performance of Faster R-CNN. In summary, it can be concluded that the method of this study significantly improves the performance of the model by introducing the center point position perception, multi-scale context extraction module and local feature enhancement module. At the same time, these characteristics have a certain generalization ability for other models such as Faster R-CNN and can improve their performance.
Figure 8 shows the image symbol recognition accuracy under different number of training samples. It can be seen that as the number of training samples increases, the accuracy of image symbol recognition gradually increases. This is consistent with the common law in machine learning that the more data, the better the performance of the model. When the number of training samples is small (for example, 5000), the accuracy of image symbol recognition is already quite high, reaching 0.95. However, as the number of training samples increases, the accuracy of image symbol recognition continues to increase. For example, when the number of training samples increases to 23,000, the accuracy of image symbol recognition increases to 0.98.
This is because as the number of training samples increases, the model can learn more sample features and patterns, which helps the model better understand and recognize image symbols. At the same time, more training samples can also make the model more stable and robust, reducing the possibility of overfitting.
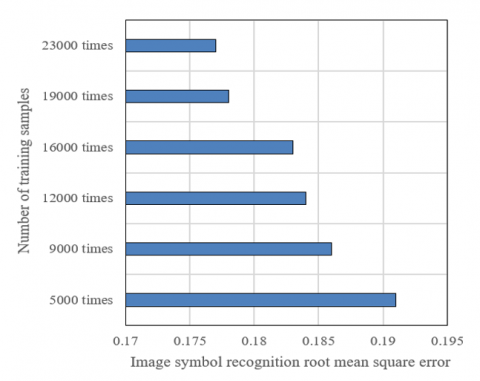
Figure 9 shows the RMSE of image symbol recognition under different number of training samples. It can be seen that as the number of training samples increases, the RMSE of image symbol recognition gradually decreases. For example, when the number of training samples increases from 5,000 to 23,000, the RMSE decreases from 0.191 to 0.177. This shows that increasing the number of training samples can effectively reduce the prediction error of the model and improve the performance of the model. This is because more training samples allow the model to learn more sample features and patterns, which helps the model more accurately predict image symbols. At the same time, more training samples can also make the model more stable and robust, reducing the possibility of overfitting and thus reducing prediction error.
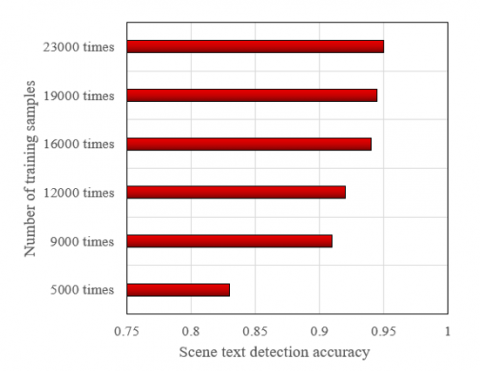
Figure 10 shows the scene text detection accuracy under different number of training samples. It can be seen that as the number of training samples increases, the accuracy of scene text detection gradually increases. For example, when the number of training samples increases from 5,000 to 23,000, the accuracy increases from 0.83 to 0.95. This shows that increasing the number of training samples can effectively improve the performance of the model. This is because more training samples can provide more information and richer scenes, which helps the model learn and understand the features and patterns of scene text better. In this way, when the model encounters new, unseen scene text, it can identify and detect more accurately. At the same time, more training samples can also make the model more stable and robust, reducing the possibility of overfitting.
Table 3. Comparison of scene text detection model ablation results
|
Method |
Center point position perception |
Multi-scale context extraction module |
Local feature enhancement module |
Recall rate |
Precision |
F value |
|
Benchmark model |
- |
- |
- |
71.4 |
68.3 |
70.6 |
|
Model 1 |
√ |
- |
- |
81.2 |
80.5 |
81.5 |
|
Model 2 |
√ |
√ |
- |
87.4 |
86.9 |
82.4 |
|
Model 3 |
√ |
3×3 |
- |
89.2 |
84.5 |
87.3 |
|
This study’s method |
√ |
√ |
√ |
89.4 |
89.2 |
88.9 |
|
Model 4 |
√ |
√ |
3×3 |
82.2 |
83.6 |
83.5 |
|
Faster R-CNN |
- |
- |
- |
82.1 |
72.5 |
81.7 |
|
Faster R-CNN |
√ |
- |
- |
84.7 |
73.2 |
84.4 |
|
Faster R-CNN |
√ |
√ |
- |
85.5 |
75.7 |
85.6 |
|
Faster R-CNN |
√ |
√ |
√ |
86.8 |
77.4 |
86.6 |
Figure 8. Image symbol recognition accuracy under different number of training samples
Figure 9. Root mean square error of image symbol recognition under different number of training samples
Figure 10. Scene text detection accuracy under different number of training samples
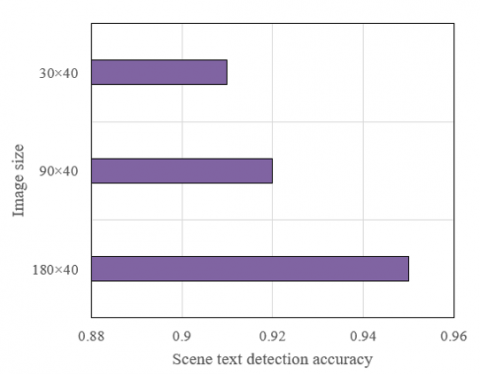
Figure 11. Scene text detection accuracy under different image sizes
Figure 11 shows the effect of different image sizes on the accuracy of scene text detection. From this table, it can be seen that as the image size decreases, the accuracy of scene text detection also decreases slightly. In larger images (180×40), the accuracy of scene text detection is the highest, reaching 0.95. This may be because in larger images, the text detail information is richer, which can provide more useful information for the text detection algorithm, thus improving the detection accuracy. However, when the image size is reduced to 90×40 and 30×40, the accuracy of scene text detection drops to 0.92 and 0.91 respectively. This may be because as the image size decreases, the text information in the image becomes more sparse, making it difficult for the text detection algorithm to accurately detect the location of the text, resulting in a decrease in accuracy. However, even at the smallest image size (30×40), the accuracy of scene text detection remains at a relatively high level (0.91), indicating that the scene text detection method in this study has good robustness in processing images of different sizes. In general, although image size has a certain impact on the accuracy of scene text detection, the method in this study can still maintain high detection accuracy in processing images of different sizes, showing good robustness.
This study conducts an in-depth study on the application of intelligent image recognition based on deep learning in the financial technology service industry. It elaborates the application scenarios of image symbol recognition and scene text detection in the financial technology service industry. And the ASTER model is improved. By combining the attention mechanism and sequence-to-sequence decoding, local information and global dependencies in the feature sequence can be effectively captured, thereby improving the recognition accuracy of the image symbol recognition model. By focusing on the center point position information of the text, pixels with the same center point are aggregated to reduce interference between adjacent texts to a certain extent, achieving more accurate text segmentation. Combining experiments, comparison results of image character recognition model results are given. Further comparison of image character recognition model ablation results and scene text detection model ablation results verify that the performance of the method in this study is better than other methods in the image character recognition task. The image symbol recognition accuracy, image symbol recognition root mean square error, scene text detection accuracy and scene text detection accuracy under different image sizes under different number of training samples are statistically analyzed and the results are given.
The authors gratefully acknowledge financial support from Hebei Social Science Foundation Project (Grant No.: HB20YJ014); The Doctoral Foundation of North China Institute of Aerospace Engineering (Grant No.: BKY-2020-04); Humanities and Social Science Research Project of Colleges and Universities in Hebei Province (Grant No.: SQ2022088).
[1] Zhang, H., Zheng, Q., Dong, B., Feng, B. (2021). A financial ticket image intelligent recognition system based on deep learning. Knowledge-Based Systems, 222: 106955. https://doi.org/10.1016/j.knosys.2021.106955
[2] Zhang, H., Dong, B., Zheng, Q., Feng, B., Xu, B., Wu, H. (2022). All-content text recognition method for financial ticket images. Multimedia Tools and Applications, 81(20): 28327-28346. https://doi.org/10.1007/s11042-022-12741-2
[3] Sabatelli, M., Kestemont, M., Geurts, P. (2020). On the transferability of winning tickets in non-natural image datasets. arXiv preprint arXiv:2005.05232. https://doi.org/10.48550/arXiv.2005.05232
[4] Liang, T.C., Pi, Y.G., Peng, J., Zhu, Z.H. (2007). Skew correction of railway ticket images based on hough transform. Huanan Ligong Daxue Xuebao/Journal of South China University of Technology (Natural Science), 35(5): 35-40.
[5] Wu, X., Liu, C. (2022). X-ray security check image recognition based on attention mechanism. In Journal of Physics: Conference Series, 2216(1): 012104. https://doi.org/10.1088/1742-6596/2216/1/012104
[6] Sinhal, R., Ansari, I.A. (2022). Multipurpose image watermarking: ownership check, tamper detection and self-recovery. Circuits, Systems, and Signal Processing, 41(6): 3199-3221. https://doi.org/10.1007/s00034-021-01926-z
[7] Sun, X., Liu, Y., Xie, L., He, X., Ma, X. (2022). Single check method of relay protection fixed value based on OCR image recognition. In 2022 Power System and Green Energy Conference (PSGEC), 1101-1105. https://doi.org/10.1109/PSGEC54663.2022.9881172
[8] Tan, Y. (2022). Application research on face image evaluation algorithm of deep learning mobile terminal for student check-in management. Computational Intelligence and Neuroscience, 2022: Article ID: 3961910. https://doi.org/10.1155/2022/3961910
[9] Han, Z., Liu, K., Li, Z., Luo, P. (2022). A pre-check operator for reducing algorithmic optimisation time in image processing applications. Enterprise Information Systems, 16(10-11): 1543-1555. https://doi.org/10.1080/17517575.2020.1864022
[10] Chang, Z., Jiang, J. (2022). Experimental investigation of the steady-state flow field with particle image velocimetry on a nozzle check valve and its dynamic behaviour on the pipeline system. Energies, 15(15): 5393. https://doi.org/10.3390/en15155393
[11] Shree, S., Shantanu, A., Simon, R., Rana, A. (2021). Smart farming and image analysis of agriculture through deep learning resulting in land quality check. In 2021 9th International Conference on Reliability, Infocom Technologies and Optimization (Trends and Future Directions) (ICRITO), pp. 1-5. https://doi.org/10.1109/ICRITO51393.2021.9596546
[12] Li, S., Xiong, L., Hu, G., Dang, W., Tang, G., Strobl, J. (2021). Extracting check dam areas from high-resolution imagery based on the integration of object-based image analysis and deep learning. Land degradation & development, 32(7): 2303-2317. https://doi.org/10.1002/ldr.3908
[13] Patel, D.J., Engineer, P., Bhatt, N.S. (2021). Image communication using quasi-cyclic low-density parity-check (QC-LDPC) code. In Advances in VLSI and Embedded Systems: Select Proceedings of AVES, 2019: 211-221. https://doi.org/10.1007/978-981-15-6229-7_17
[14] Thakur, A., Gill, G.S., Saxena, S. (2020). Analysis of image steganography performance check using bit selection. In 2020 7th International Conference on Signal Processing and Integrated Networks (SPIN), pp. 1-5. https://doi.org/10.1109/SPIN48934.2020.9071251
[15] Nie, J., Zheng, C., Zeng, P., Zhou, B., Lei, L., Wang, P. (2020). Using the theory of planned behavior and the role of social image to understand mobile English learning check-in behavior. Computers & Education, 156: 103942. https://doi.org/10.1016/j.compedu.2020.103942
[16] Suga, S., Otomo, A., Jeong, H., Ohno, Y. (2019). Image similarity check of nailfold capillary by template matching. In 2019 IEEE 8th Global Conference on Consumer Electronics (GCCE), pp. 799-803. https://doi.org/10.1109/GCCE46687.2019.9015453
[17] Cui, Y., Ji, X. W., Xu, K., Wang, L.G. (2019). A double-strategy-check active learning algorithm for hyperspectral image classification. Photogramm. Eng. Remote Sens, 85(11): 841-851. https://doi.org/10.14358/PERS.85.11.841
[18] Pramanik, A., Maity, S.P., Sethia, A.K. (2019). On CS image reconstruction by high rate non-binary low density parity check code over GF(q). Microsystem Technologies, 25(5): 1731-1742. https://doi.org/10.1007/s00542-017-3351-7
[19] Garg, S., Mishra, N. (2018). Pollution check control using license plate extraction via image processing. In Soft Computing: Theories and Applications: Proceedings of SoCTA, 2: 133-146. https://doi.org/10.1007/978-981-10-5699-4_14
[20] Giri, A.A., Suresh, T. (2018). An approach of secure image transmission using low density parity check codes. In 2018 International Conference on Communication and Signal Processing (ICCSP), pp. 0970-0973. https://doi.org/10.1109/ICCSP.2018.8524546
[21] Chen, Z., Liu, F., Kong, X., Li, G. (2018). Technique of polarization remote sensing on GEO and quick check method of polarization image. In 4th International Symposium of Space Optical Instruments and Applications: Delft, The Netherlands, 209: 208-214. https://doi.org/10.1007/978-3-319-96707-3_23
[22] Dewi, R., Zainuri, M., Anggoro, S., Winanto, T., Endrawati, H. (2018). Spatio-temporal distribution of chlorophyll-a using multitemporal Landsat image and ground check in Segara Anakan Lagoon. In E3S Web of Conferences, 47: 03007. https://doi.org/10.1051/e3sconf/20184703007
[23] Pramanik, A., Maity, S.P., Sarkar, S. (2018). Compressed sensing image reconstruction by low density parity check codes and soft decoding of space time block codes. Computers & Electrical Engineering, 72: 553-565. https://doi.org/10.1016/j.compeleceng.2018.01.014
[24] Zhu, X., Liu, Y., Liu, X., Li, C. (2019). Convolutional neural networks for finance image classification. In Artificial Intelligence on Fashion and Textiles: Proceedings of the Artificial Intelligence on Fashion and Textiles (AIFT) Conference 2018, Hong Kong, pp. 237-245. https://doi.org/10.1007/978-3-319-99695-0_29
[25] Tian, M.W., Yan, S.R., Tian, X.X., Liu, J.A. (2019). Research on image recognition method of bank financing bill based on binary tree decision. Journal of Visual Communication and Image Representation, 60: 123-128. https://doi.org/10.1016/j.jvcir.2018.12.016
[26] Zhang, H., Dong, B., Zheng, Q., Feng, B. (2022). Research on fast text recognition method for financial ticket image. Applied Intelligence, 52(15): 18156-18166. https://doi.org/10.1007/s10489-022-03467-7