Saif Al-jumaili*![]() | Adil Deniz Duru
| Adil Deniz Duru![]() | Abdullahi Abdu Ibrahim
| Abdullahi Abdu Ibrahim![]() | Osman Nuri Uçan
| Osman Nuri Uçan![]()
© 2023 IIETA. This article is published by IIETA and is licensed under the CC BY 4.0 license (http://creativecommons.org/licenses/by/4.0/).
OPEN ACCESS
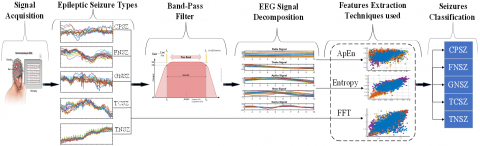
Epilepsy is one of the earnest neurological disorders that require further social attention. Based on the International League Against Epilepsy (ILAE), which classifies the epilepsy term as a number of several seizures that occur in the brain. Electroencephalography (EEG) is considered our brain window to the electrical activity. It is a significant device used for diagnosing multiple brain disorders such as Epilepsy. Moreover, this study used data from Temple University Hospital Seizure Corpus (TUH), which represents an accurate description of the clinical cases for five types of epileptic seizures. Initially, to extract information from EEG signals, three types of feature extraction have been used namely Fast Fourier Transform, Entropy, and Approximate Entropy. Due to the high degree of variance of EEG signals, we implemented a band-pass filter to divide the signals into sub-bands called delta rhythm (0.1 - 4Hz), theta rhythm (5 -9Hz), alpha rhythm (10 - 14Hz), beta rhythm (15- 31Hz), and gamma rhythm (32-100). The feature extraction outcome underwent normalization techniques and was used as input for the classifiers. Support Vector Machine (SVM), Decision Tree (DT), Naive Bayes (NB), and K-Nearest Neighbor (KNN) classifier have implemented in order to classify (1) second epoch length window. In the first scenario, we applied the FFT features to the classifiers, the results showed that SVM obtained the highest value compared to the other classifiers with 96% accuracy, whereas KNN was 92% and the DT and NB were 76% and 67%, respectively. The second scenario was applying entropy features to the classifiers, the results of classification were 91% for SVM and 88% for KNN, while the DT and NB were 76% and 67%, respectively. The last scenario was ApEn, which shows that SVM still gains the highest value, which was 83%, and 76% for KNN, where the DT and NB were 65% and 69%, respectively. From the aforementioned results, we deduced that SVM achieved the best accuracy when applied with the three feature extractions.
electroencephalogram (EEG), fast fourier transform (FFT), K-nearest neighbor (KNN), support vector machine (SVM), classification epileptic seizure
Neural cells activities of the human brain begin during the 17th to 23rd week of prenatal and the electrical signals generated by the brain indicate not only the brain activity, but the overall condition of the body from infancy to old age [1]. The brain consists of interconnected neurons, and the nervous system is divided into two parts; the central nervous system and the peripheral nervous system, which travels through a network of connections between all parts of the body as an integrated system [2, 3]. The activity that the human performs must pass through the neuron cells. The nervous system controls all the activities and processes of the body, and there are numerous messages circulating all the time between the brain and all parts of the body about the expression of feelings, in addition to the thought process. Two neural mechanisms, the central nervous and autonomous systems operate to maintain the neural activities, simultaneously. The former one is mainly responsible from the cognitive domain activity while the latter one manages the involuntary processes such as digestion [4], heart work [5], breathing [6], body temperature [7], and the activity of the glands that maintain the human body.
In the brain, various electrical signal types generated are related to the whole body [1]. This presumption provides such a good reason for the researchers to apply several signal processing techniques using (EEG) signals that are measured from the scalp surface. EEG is considered one of the supreme devices in our modern era which can collect signals non-invasively [8, 9]. EEG used to diagnose different types of diseases such as stroke [10], sleep disorder [11], alzheimer’s, epilepsy [12-14], and memory loss [12].
Epilepsy is one of the common diseases in neurology that affect neural cells. EEG is the golden standard measurement that helps researchers to diagnose epilepsy based on abnormal brain signals "epileptic seizures". Seizures cause unusual routines on the person’s behavior [15]. According to the international league against epilepsy (ILAE), epilepsy is defined as the presence of unprovoked recurrent seizures [16].
The seizure can come from infinitesimal to severe muscle twitching, which is a general and long-lasting spasm. In clinical services and neurology, if two or motiveless seizures happen, that leads to suspicion that might be epilepsy. However, there are two types of epileptic seizures depending on the brain occurrence part, the first called focal seizures when occurring in one part of the brain which is very hazardous, whereas the second one called generalized non-specific seizures when is happens in the whole brain. Distinguish between these two types is difficult due to the similarity of their characteristics.
The purpose of this study is to find the best effective classification technique (algorithm) for classification EEG signals for epileptic seizures. Thus, we implemented three types of feature extraction applied on EEG signals to extract the hidden information. Features that extracted by FFT, approximate entropy, and Entropy values were from 1-second epoch length window. Hence, these features undergo normalization methods used as input for the four classifiers namely K-nearest neighbor (KNN), support vector machine (SVM), naive bayes (NB), and decision tree (DT). The software used to implement these algorithms was MATLAB (R2021a).
Due to the accuracy in prior studies achieved fairly acceptable results as shown in the literature review section and this gives us the motivation to conduct this study, we summarize it in three main points: 1) To provide a method that can help the health sector to identify epileptic seizures with accurate results. 2) To develop a method with low computational complexity which can save the time to diagnose seizures accurately. 3) To achieve the best effective classification algorithm for identifying the type of epileptic seizures from EEG signals, whereas usually (in previous studies) the classification is performed based on the signals not on the type of epilepsy but just to decide whether it is normal or epilepsy.
Based on our obtained results, our method achieved higher accuracy results when compared to the previous studies. From the three scenarios, the highest accuracy results obtained by using the FFT feature method with SVM, compared to the other types of classifiers using the same features. Whereas by using the entropy family for feature extraction, the SVM classifier has a clear superiority over the other three used classifiers. Based on the results, we concluded that SVM attained the highest accuracy when used with the three features.
The paper concepts discussed as follows: Section I, is the introduction, wherein Section II, describes the literature review. While Section III described the used dataset. The methods and classification techniques were both discussed in sections IV and V. The results are reported in Section VI. The conclusion is set in section VII.
Various studies implemented machine learning techniques to classify epilepsy using EEG dataset. One of these studies done by Kumar et al. [17], used spectral, wavelet entropy, and sample entropy as feature extraction and used as input for both types of neural network (NN), which are radial basis network (RBN) and elman neural network (ENN) for classification. Whereas [18], proposed a classification technique that relies on entropy feature extraction by empirical mode decomposition (EMD) technique and discrete wavelet transform domains. They applied low-energy entropy, shannon entropy, and renyi entropy, the results used as input to the KNN. Similar to the aforementioned study, the authors [19] used one of the most important databases: the Temple University Hospital EEG Seizure Corpus (TUH). They applied the signal decomposed method by empirical mode decomposition (EMD) on four seizures namely focal non-specific seizure (FNSZ), simple partial seizure (SPSZ), tonic seizure (TNSZ), and generalized non-specific seizure (GNSZ). Their statistical features were mean-variance, skewness, kurtosis, standard deviation, and interquartile range used as features input dataset for the classification using support vector machine (SVM) classifier with different types of kernels, which is linear, quadratic, and cubic, the implementation done based on 5-folds. They achieved the best accuracy by using quadratic SVM which was 95%. In the study [8], researchers used the same dataset (TUH) for seizure classification. The authors selected three types of seizures: tonic-clonic seizure (TCSZ), generalized non-specific seizure (GNSZ), and focal non-specific seizure (FNSZ), and applied three techniques of signal processing which were independent component analysis (ICA), mel frequency cepstral coefficients (MFCC), and hjorth descriptor (HD), with support vector machine (SVM) classifier. Similar to the above study, [17], used EEG signals to detect epilepsy using fast fourier transform (FFT) to extract the hidden features. Then applied these outputs as input to the decision tree (DT) classification algorithm. Based on the aforementioned studies, researchers used statistical feature extraction techniques to extract information from EEG time series. A variety of studies applied different types of entropies to classify epilepsy; among the different types of entropies, wavelet entropy features achieved a higher accuracy of 94.5%, which is fairly acceptable. On the other hand, different studies have utilized the same dataset with multiclass but with diverse classification techniques, whereas the highest value was 95%.
In the study [20], EEG signals used to diagnose neurological disorders for autism spectrum disorder (ASD) and epilepsy. EEG signals that collected from a patient's brain have different types of noise that are unwanted and called artifacts. Therefore, they eliminated the artifacts and applied independent component analysis (ICA) techniques. Later, they applied the discrete wavelet transform (DWT) to analysis the signal into sub-band delta (δ), theta (θ), alpha (α), beta (β), and gamma (γ). Then, five feature extraction types are implemented on these rhythms: logarithmic band power (LBP), variance, kurtosis, standard deviation (SD), and shannon entropy (SE). The classification techniques used were linear discriminant analysis (LDA), artificial neural networks (ANNs), K-nearest neighbor (KNN), and support vector machine (SVM). The results obtained were for two-classes as 99.9% using DWT + LBP feature extraction with SVM and 97% using DWT + LBP feature extraction with ANN for three-classes.
Similar to above studies, in the study [12], author used EEG signals that had been collected from 15 volunteers with three different conditions; rest with closed eyes states, opened eyes states, and mental workload. The EEG signal was collected from the scalp using 16 channels, which later became an input to the power spectrum for feature extraction. Next, three classification types of techniques used: decision tree (DT), support vector machine (SVM), and K-nearest neighbor (KNN). The highest accuracy result achieved was 94% for KNN, while the DT and SVM obtained the same accuracy of 88%. Whereas [21], used EEG signal to classify two epileptic seizures (focal and non-focal) by using four types of feature techniques using probability density function (PDF), energy and pattern spectrum entropy (PSE), mutual information (MI), and characteristic feature vector (CFR). Further, the outcome of feature techniques used as input for the adaptive neuro-fuzzy inference system classification technique, which is a kind of artificial neural network (ANN). The accuracy obtained was 99.4%, specificity 99.7%, and sensitivity 99.7%. In addition to this, an approximate entropy algorithm (improved approximate entropy: IAPE) was developed which can overcome the problem of fixed window length to improve feature extraction and lead to increase the accuracy [22]. The authors proposed a combination of two classification technique types which are multi-wavelet transform and ANN. The accuracy obtained from this method was 90%. In the above studies, the authors used several types of techniques to classify EEG signals. They proposed methods that were particularly useful for classifying two or three classes of epileptic seizures. We attempted to improve the accuracy further by our proposed new method using several types of feature extraction and supervised machine learning algorithms. As a result, we obtained an increased accuracy value when compared with the previous research.
One of the most critical obstacles to developing machine learning (ML) is the lack of availability of big data resources that can support the training of complex deep-learning (DL) systems [23, 24]. Therefore, researchers and scientists try to solve these obstacles by providing different types of dataset for EEG signals such as Bonn [25], Freiburg [26], CHB-MIT [27], and Temple University Hospital Seizure Corpus (TUH). Where the last one was used in this study, which is one of the hugest open-source available for the researchers that represents an accurate description of the clinical case [28-30].
EEG Signals at TUH dataset collected by using 10-20 standard electrode position (channels) which contains different types of the brain activities (epileptic seizures). Thus, we selected just 16 channels which were (FP1, FP2, F3, F4, C3, C4, P3, P4, O1, O2, F7, F8, T3, T4, T5, T6) as shown in Figure 1. In addition, we selected three sampling frequency types from the dataset that we used: 250HZ, 256HZ, and 400HZ [31-33].
Table 1 shows the dataset that holds 5 different types of seizures which are generalized non-specific seizure "GNSZ", complex partial seizure "CPSZ", tonic-clonic seizure "TCSZ", focal non-specific seizure "FNSZ", and tonic seizure "TSNZ". GNSZ is a seizure type that there is not enough evidence to be classified as a specific one, therefore, it is defined as "generalized non-specific". Whereas FNSZ can happen in the brain hemispheric or focal, Therefore, it cannot be determined in specific. TCSZ has two phases; tonic or stiffening and then the whole body starts jerking or clonic [34]. CPSZ is a type of seizure that originates in a single lobe of the brain. The seizure could affect the patient and cause a loss of consciousness or awareness. TSNZ seizure causes unexpected stiffness or tension of the muscles for both legs and arms or even the trunk. Most seizures happen during sleep and stiffness and last about 20 seconds. When a seizure occurs, it may cause a fall situation for the patient if he stood and when the seizure is finished the patient feels confused and very tired [35].
Preprocessing is one of the essential steps to forward in processing signals, which is used to make the data clearer to use. Therefore, there are different types of filters that are widely used to decrease noise (artifacts) from the data as much as possible and a meliorate the quality of the data that get from the brain [36]. Due to the high degree of variance of EEG power observed between 0.3-30Hz during the implementation of epilepsy seizures [37, 38]. Hence, the band-pass filter is applied as a preprocessing technique for the signals, which eliminate redundant frequencies (artifacts) and concentrate just on the spectrum that corresponds with the sub-band of EEG rhythms which are δ rhythm (0.1 - 4Hz), θ rhythm (5 -9Hz), α rhythm (10 - 14Hz) and β rhythm (15- 31Hz), γ rhythm (32-100).
Figure 1. The location of each electrode on the scalp is based on standard 10-20 within 22 channel TCP montage [31]
It is imperative to point out that the data collected from the brain by an EEG device contains a significant amount of information. Thus, to classify data time-series, we need to extract hidden information from the signals. Feature extraction is considered a significant part of EEG signal processing and an indispensable task. Since there are a lot of techniques used to extract features from frequency-domain (FD), therefore, we used three different types of features namely the entropy, approximate entropy and fast fourier transform (FFT) [20, 39].
Table 1. Dataset description
|
Class Names |
Event Name |
Description |
|
FNSZ |
Focal Non-Specific Seizure |
FNSZ is the type of seizure that cannot be able to specify through the seizure effect on the muscles, which clear show on the sensations |
|
GNSZ |
Generalized Non-Specific Seizure |
GNSZ is the seizures that involve different symptoms such as tonic-clonic, tonic, atonic and febrile seizures as well as loss the consciousness in some cases |
|
CPSZ |
Complex Partial Seizure |
CPSZ is the kind of seizure that occurs in the one lobe of the brain, it may make awareness and in some cases the peoples loss consciousness |
|
TNSZ |
Tonic Seizure |
TNSZ is the type of seizure that clearly affects the muscles, arms, trunk, or legs. |
|
CNSZ |
Clonic Seizure |
CNSZ is the type of seizure that makes an effect in the face, legs, and arms, and then becomes very fast and intense, after three minutes it begins to slow down, and the body will relax. |
Figure 2. EEG signals classification steps involve feature extraction and filter processing
In literature, different entropy types have been used to extract features from complex data since they have the ability to provide estimations of complexity [40]. Among these, fuzzy entropy (FuzzyEn) [41, 42], permutation entropy [43], approximate entropy (ApEn) [44], symbolic dynamics based entropy [45], and sample entropy (SampEn) [46] are used in various studies. The most common entropy used in biological data is approximate entropy (ApEn) [47, 48], especially for detection of epilepsy [49, 50]. Thus, we used ApEn in this study as a second technique as feature extraction from EEG signals. It is defined as the predictability or measurement of regularity or randomness in a time-series of data. Since the ApEn technique is less sensitive to noise, it is used for short-length data [51]. Besides, the most critical input parameters that affect the algorithm are r (similarity criterion), e (length of the data segment being compared) and N (length of data). Regularity can affect on the values; therefore, the high regularity provides a small value and vice versa. Where the low regularity provides a high value. Accordingly, the mathematical formula for ApEn equation was done by the scientists [52], as it is shown below in Eq. (1).
$\begin{gathered}\operatorname{ApEn}(E, r, N)=\frac{1}{(N-e+1)} \sum_{i-1}^{N-e+1} \log C_i^e(r) -\frac{1}{N-e} \sum_{i=1}^{N-e} \log C_i^{e+1}(r)\end{gathered}$ (1)
Fast fourier transform (FFT) considered as a development for discrete a fourier transformation (DFT) algorithm. The FFT algorithm has the ability to calculate transformations faster than DFT by reducing the looping process [53]. One of the most crucial parts of feature extraction is the capability to convert the EEG signals from the time domain to the frequency domain, which we applied in this study. The mathematical formulation of FFT is shown in Eq. (2).
$\begin{gathered}X(K)=\sum_{n=0}^{N-1} X[n] W_N^{k n}=\sum_{n \text { even }} x(n) n w_N^{k n}+\sum_{n \text { odd }} x(n) w_N^{k n} \\ K=0,1 \ldots \ldots, N-1\end{gathered}$ (2)
As aforementioned in the equation, the X(K) represents the fourier coefficients of x(n), which assumed it has a complex value (which mean a sample of time series that made up of N samples), the odd n and even n compatible with odd-numbers and even-numbers with the frequency of K, respectively.
The number of features achieved were 6267 and 5990 for entropy and FFT while ApEn were 5653. Before fed the features to the classifiers the extracted features performed to normalization (L2-Norm). Figure 2 shows the processes that had been applied as a method used to classify five epileptic seizures that we obtained from the source (TUH).
5.1 Support vector machine (SVM)
In the last few years, many different types of clustering and classification methods have been used in machine learning, where each one has its own advantages. Among them, linear discriminant analysis (LDA), K-means clustering, artificial neural networks (ANNs), fuzzy logic, hidden markov modelling (HMM), decision tree (DT) [54], naive bayes, and SVM which is the most common ones.
Where SVM has the ability to classify dataset using both non-linear and linear methods by using kernels. Therefore, SVM is used primarily within linear dataset due to its ability to effectively split data. However, SVM was developed by [55]. In SVM, a hyperplane is considered the most significant part, where it utilizes mathematical functions to determine an optimal hyperplane that can split into two classes in training dataset within the maximum margin. Then the space between the closest train data points increased to find the boundaries of the classes which represents the optimal hyperplane. Which eliminates some of the inconsequential data from the training dataset to minimize the classification error [56]. However, when dataset is organically non-linear the SVM uses a kernel function to transform the data to the high-dimensional to provide a separating hyperplane. The most common kernel functions utilized in SVM are sigmoid, polynomial, radial basis function (RBF), gaussian kernel, and linear [57-59], which is called a (kernel trick). However, in order to obtain perfect achievement, there are two critical parameters that affect the efficacy of SVM accuracy which are W and b. Where W is the data vector that converts the hyperplane and b is the displacement of that vector. Thereafter, the decision function D for input z can be defined by a mathematical expression as shown in Eq. (3) as well as the space between z to the hyperplane shown in Eq. (4).
$\begin{aligned} & D(z)=W \cdot z-b, \text { where } Z \in\left\{\begin{array}{l}A \text { if } D(z)>0 \\ B \text { if } D(z)<0\end{array}\right.\end{aligned}$ (3)
$\frac{D(z)}{\|w\|}$ (4)
5.2 Decision tree (DT)
Decision tree (DT) is a technique used for classification and has the ability to deal with a huge dataset and convert the data to useful knowledge. The mechanism of the DT algorithm works top-down and break-down the datasets into smaller subsets during the construction of the tree. DT is composed of three main nodes which are root, internal, and leaf. The topmost node acts as a root, which is a start point and non-contain any incoming edges, but it has outgoing edges, whereas internal nodes represented by dataset are an attribute, for each attribute, there is just one incoming branch, and it has at least two branches. The leaf nodes (or terminal node) denote the classes. DT can deal with numerical and categorical data.
5.3 Naive bayes (NB)
On the other hand, the naive bayes classifier was built entirely on bayes theorem [60]. It is a well-known algorithm in supervised classification. One of the advantages of the naive bayes classifier is decreasing the amount of the training data. Moreover, naive bayes classifier has the ability to perform very fast. The gaussian process can be used for both big data and normal data [61], In Eq. 5, factors σy and μy are estimated by maximum likelihood [62].
$P\left(\chi_i \mid y\right)=\frac{1}{\sqrt{2 \pi \sigma_y^2}} \exp \left(-\frac{\left(x_i-\mu_y\right)^2}{2 \pi \sigma_y^2}\right)$, (5)
5.4 K-nearest neighbors (KNN)
KNN is a non-parametric classification method initially developed in 1951 [63]. The classifier technique is based on a similarity measurement that can find the closest neighbors. In order to classify a new data point (X) the algorithm during the training phase checks the distance between the dataset and gives a particular label (K) that indicates its class, after checking all the training data, KNN specify the new point (X) to repeat the same process with all data in order to classify the data to their classes. The K number used in the classifier can be determined experimentally by searching for the minimum error rate. The KNN used euclidean distance to determine the distance, the mathematical formula shown below in Eq. (6).
${dis}(x 1, x 2)=\sum_{i=1}^n \sqrt{(x 1 i-x 2 i)^2},$ (6)
where, x1 indicate to the fold x1 and x2 indicate to the fold x2 where the X11, X12, X13...Xi represents the number of features that are associated to fold 1 while the X21, X22, X23...Xi represent the features numbers that are linked to fold 5.
We used different types of performance rating scales to validate each model individually, using a confusion matrix from four types of outcomes, namely true positive (TP), true negative (TN), false positive (FP), and false negative (FN). Accuracy, sensitivity, and specificity were used to evaluated classifiers performance by using the equations listed below.
$\begin{gathered}{ Sensitivity }=\frac{T P}{T P+F N} \\{ Specificity }=\frac{T N}{T N+F N} \\ { Accuracy }=\frac{T P+T N}{T P+F P+T N+F N}\end{gathered}$
This section presents the outcomes achieved by implementing the features derived using three different methods and four types of classifiers. After the feature extraction process, normalization is utilized to the data. The number of training data sets for the three feature extractions were: entropy (6267), FFT (5990), and ApEn (5653), and normalized before applied them in the classification. These data consist of 5 seizure types (GNSZ, CPSZ, TCSZ, FNSZ, and TSNZ). It is considered as an input to the classifier. Table 2 shows the accuracy of each classifier which is related to each type of feature extraction. Entropy feature implemented for the classification models which gave a higher result in SVM (91%) and KNN (88%), whereas the other two classification techniques show the lowest value in DT (69%), and NB (53%) respectively. Once again, SVM achieved the highest value when compared to the other techniques by implementing the FFT features for the classification. The accuracy values were: SVM (96%), KNN (92%), DT (76%) and NB (67%) respectively. Finally, when ApEn was applied for classification models, SVM classifier got the highest values when compared to other classifier types. The accuracy values were: SVM (83%), KNN (76%), DT (65%), and NB (69%) respectively.
It also worth mentioning that all results we obtained by using 5-fold cross-validation to be ensured that there are no unbiased during implement classification, where the n-fold separated the data into N equal to fold and training the data, this process repeated until getting the all 5-fold, and then the average computes to all n-fold.
Table 2. Accuracy of each classifier instated feature extraction types using K-Fold cross-validation
|
Feature Extraction |
Classifiers |
|||
|
KNN (%) |
SVM (%) |
DT (%) |
NB (%) |
|
|
FFT |
92.1 |
96.5 |
76.0 |
67.6 |
|
Entropy |
88.7 |
91.0 |
69.4 |
53.3 |
|
ApEn |
76.0 |
83.2 |
68.6 |
69.0 |
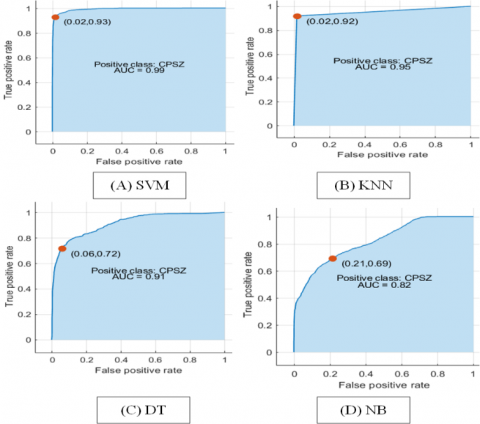
To ensure our results, we used receiver operating characteristics curves (ROC) as a graphical plot that represents the ability of the classifier's performance (the bigger area under the curve refers to the better performance of the classifiers). As shown in Figure 3, which represents the implementation of the entropy feature. While Figure 4 depicts the FFT feature's implementation. Finally, Figure 5 depicts the ApEn functionality in action. It is very clear that SVM is the highest compared to the other classifiers in all scenarios.
Figure 3. ROC curve of using different types of classifiers for Entropy features
Figure 4. ROC curve of using several types of classifiers for FFT features
Figure 5. ROC curve of using diverse types of classifiers for ApEn features
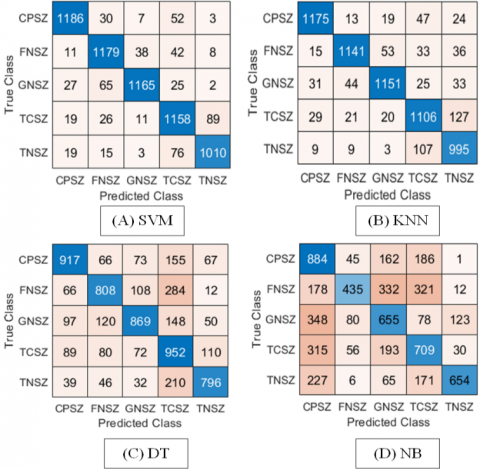
In addition to accuracy, sensitivity, and specificity that used together to measure the predictive performance of the classifier model. Figure 6 shows the confusion matrix for four types of classifiers based on FFT feature extraction. Moreover, Table 3 shows the sensitivity and specificity that obtained from the confusion matrix where the SVM obtained the highest specificity and sensitivity compared to other types of classifiers.
Figure 6. Confusion matrix for different types of classifiers based on the FFT feature extraction. These results obtained by using 5-fold cross-validation
Table 3. The average sensitivity and specificity results using FFT feature extraction, where CM refers to Classifiers Model, FT refers to Feature Type, G refers to GNSZ, C refers to CPSZ, TC refers to TCSZ, F refers to FNSZ, and TN refers to TNSZ
|
CM |
FT |
Specificity/Sensitivity |
G |
C |
TC |
F |
T |
|
KNN |
FFT |
Specificity (%) |
97 |
97 |
98 |
97 |
99 |
|
Sensitivity (%) |
94 |
95 |
96 |
87 |
87 |
||
|
SVM |
Specificity (%) |
98 |
98 |
99 |
98 |
99 |
|
|
Sensitivity (%) |
95 |
95 |
97 |
94 |
97 |
||
|
DT |
Specificity (%) |
93 |
92 |
94 |
94 |
97 |
|
|
Sensitivity (%) |
71 |
74 |
76 |
70 |
89 |
||
|
NB |
Specificity (%) |
83 |
88 |
90 |
78 |
96 |
|
|
Sensitivity (%) |
77 |
61 |
69 |
57 |
79 |
Table 4. The average sensitivity and specificity results using ApEn feature extraction where CM refers to Classifiers Model, FT refers to Feature Type, G refers to GNSZ, C refers to CPSZ, TC refers to TCSZ, F refers to FNSZ, and TN refers to TNSZ
|
CM |
FT |
Specificity/Sensitivity |
G |
C |
TC |
F |
T |
|
KNN |
ApEn |
Specificity (%) |
91 |
95 |
90 |
93 |
98 |
|
Sensitivity (%) |
62 |
85 |
81 |
69 |
82 |
||
|
SVM |
Specificity (%) |
94 |
96 |
94 |
95 |
98 |
|
|
Sensitivity (%) |
76 |
90 |
84 |
75 |
93 |
||
|
DT |
Specificity (%) |
90 |
92 |
89 |
90 |
96 |
|
|
Sensitivity (%) |
61 |
753 |
58 |
61 |
92 |
||
|
NB |
Specificity (%) |
91 |
93 |
82 |
93 |
96 |
|
|
Sensitivity (%) |
50 |
73 |
73 |
56 |
90 |
Table 5. The average sensitivity and specificity results using Entropy feature extraction, where CM refers to Classifiers Model, FT refers to Feature Type, E refers to Entropy, G refers to GNSZ, C refers to CPSZ, TC refers to TCSZ, F refers to FNSZ, and TN refers to TNSZ
|
CM |
FT |
Specificity/Sensitivity |
G |
C |
TC |
F |
T |
|
KNN |
E |
Specificity (%) |
97 |
97 |
96 |
96 |
97 |
|
Sensitivity (%) |
92 |
93 |
83 |
92 |
81 |
||
|
SVM |
Specificity (%) |
97 |
98 |
97 |
98 |
97 |
|
|
Sensitivity (%) |
94 |
94 |
85 |
90 |
91 |
||
|
DT |
Specificity (%) |
91 |
92 |
92 |
91 |
93 |
|
|
Sensitivity (%) |
76 |
75 |
55 |
67 |
82 |
||
|
NB |
Specificity (%) |
87 |
90 |
87 |
85 |
91 |
|
|
Sensitivity (%) |
46 |
45 |
48 |
71 |
79 |
Table 6. Comparison of our results with studies that classify epileptic seizures, where References (Ref.), accuracy (Acc), sensitivity (Sen), specificity (Spe)
|
Ref. |
Dataset |
Classes |
Feature Extraction Techniques |
Classifier |
Acc % |
Spe % |
Sen % |
|
[8] |
TUH |
4 |
ICA, Hjorth Descriptor and MFCC |
SVM |
90 |
97 |
88 |
|
[19] |
TUH |
4 |
Mean, Variance, Skewness, Kurtosis, Std |
SVM |
95 |
NA |
NA |
|
[64] |
CHB-MIT |
3 |
DWT |
SVM |
94.8 |
NA |
NA |
|
[65] |
CHB-MIT |
2 |
Root Mean Square, Entropy, Power Spectral Density |
KNN |
93 |
88 |
88 |
|
[66] |
CHB-MIT |
2 |
Std, Mean, Variance, Median, Kurtosis, Skewness, Entropy, Moment, Maximum, Minimum, power |
KNN |
84.8 |
NA |
NA |
|
[67] |
CHB-MIT |
2 |
Spectral power |
KNN |
80.87 |
NA |
NA |
|
[68] |
CHB-MIT |
2 |
DWT |
SVM |
92.30 |
91.71 |
92.89 |
|
[69] |
CRCNS |
2 |
HFO stacked denoising frequency autoencoder (SDAE) |
SWAF-ABSVM |
92.4 |
NA |
NA |
|
[70] |
Bonn |
3 |
DWT |
Radial basis function neural networks (RBFNN) |
82.3 |
95.6 |
68 |
|
[71] |
UCI |
2 |
Mean, Std |
SVM |
80.30 |
73.74 |
86.85 |
|
[72] |
UCI |
2 |
WT |
ANN |
95.2 |
92.12 |
98.17 |
|
[73] |
Private |
2 |
Entropies |
The adaptive neuro- fuzzy inference system (ANFIS) |
92.2 |
NA |
NA |
|
[74] |
Bern Barcelona |
2 |
EWT |
LS-SVM |
90.5 |
88 |
92 |
|
[75] |
Bern Barcelona |
2 |
Delay permutation entropy |
SVM |
84 |
NA |
NA |
|
[76] |
Bern Barcelona |
2 |
Entropy |
KNN |
84 |
84 |
84 |
|
Ours |
TUH |
5 |
FFT |
SVM |
96.5 |
98.4 |
95.6 |
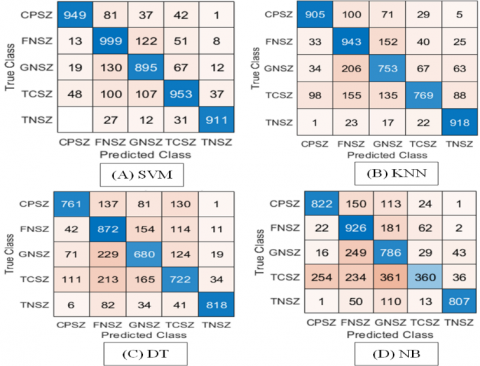
Figures 7 and 8 show the confusion matrix of the four types of classifiers by applying the two types of feature extraction, which are ApEn and entropy. Table 4 illustrates the confusion matrix results obtained for both sensitivity and specificity after implementing the ApEn feature. While Table 5, represented the confusion matrix results that got by implementing the last feature which is entropy. It is clear that SVM classifier outperforms again with the highest value for both (sensitivity and specificity) for the five class types (GNSZ, GPZS, TCS, FNSZ, TZSZ), in terms of comparison to another classifier (KNN, DT, NB).
Figure 7. Confusion matrix for different types of classifiers based on the ApEn feature extraction. These results obtained by using 5-fold cross-validation
Figure 8. Confusion matrix for different types of classifiers based on the Entropy feature extraction. These results obtained by using 5-fold cross-validation
Finally, as shown in Table 6, we compared our results with a lot of papers using several types of methods aimed to classify epileptic seizures. Obviously from that table our method is superior to the published papers.
Brain-computer interface (BCI) may have various names such as brain-machine interface (BMI), mind-machine interface (MMI), direct neural interface (DNI), and neural control interface (NCI) all these terms pour into one goal which provides the communication channel between the human brain and computer. BCI is considered a significant part of machine learning since it has the capability to measure the activity of the central nervous system (CNS) through the EEG device. Also, it assists to enhance the people life who have neuromuscular disorders such as spinal cord injury, cerebral palsy, amyotrophic lateral sclerosis, stroke, etc. The brain-computer interface (BCI) is related to the brain which is responsible for human behavior and control all the perceptual and voluptuous functions. However, the main objective of BCI is to build models that can reduce the amount of training data and the number of sensors used. For instance, epilepsy disease used the BCI techniques for detection and classification, using EEG signals which were our main objective in this study. EEG signal analysis is deemed as one of the most critical parts that can reflect the activity of the brain.
In this study, we used machine learning classification techniques to classify five types of epileptic seizures namely (GNSZ, GPZS, TCS, FNSZ, TZSZ), with three types of feature extraction namely FFT, entropy, and ApEn. Thus, in order to apply our proposed method, we have three major steps: First, we applied a band-pass filter to remove the noise and divide the signal into sub bands. Afterwards, normalized features extracted. Finally, four types of classification techniques used in the study, namely (SVM, KNN, NB, and DT).
We compared it with 16 studies that used different types of data to classify epileptic seizures. There are different types of factors that play a significant role in the results, such as the number of electrodes, length of the window, number of patients, and so on. To be more accurate and reassuring, we compared studies using the same data. In studies [8, 19], used different types of feature extraction methods on the raw data excluding the noise removal process and the final results they obtained were less than the ones that we achieved.
The CHB-MIT was utilized in several studies to classify two or three types of epileptic seizures [64-68]. Feature extraction methods are critical for final accuracy, in aforementioned studies, statistical feature approaches in the time domain utilized, as well as two types of classifiers (KNN and SVM). Our findings were superior in all criteria compared to them. Since previous research were used various sorts of data sources. The disparity in data impacts accuracy because there are some factors influencing the outcome. Only two or three kinds of seizures classified in the investigations [69-73], in contrast to TUH. Researchers [74-76], employed Bern Barcelona, a small data set consisting of just 50 pairings and two classes (focal and non-focal). Based on the results obtained in the previous studies, the results were fairly acceptable. But in our study, more exhaustive EEG data that consist of several types of seizures adopted. In terms of performance, the accuracy that we obtained was pretty satisfactory and proves the ability to classify various forms of epileptic seizures using machine learning approach. Furthermore, due to the simplicity of these calculations, it may be incorporated into software programs for the classification of five types of epileptic seizures using EEG signals and therapeutically utilized in the doctor's office, which can save time and provide an accurate diagnosis of seizures.
The main contributions of this paper stated as follows:
1. To improve the accuracy of seizure classification, which is substantially beneficial for epileptic patients who intend to undergo remedy.
2. To prove that even one second length of the time window was showing to be adequate duration to achieve the acceptable accuracy.
3. To increase the number of classification seizures compared to the papers published in literature.
4. To improve feature extraction by removing EEG artifacts by using band-pass filtering to subset signals into sub-bands
The results we obtained based on three scenarios as follows: the first scenario was using the FFT feature method combined with the four used classifiers, where the training data were (5990). The best-obtained accuracy results were for the SVM classifier which achieved 96%. Whereas KNN achieved accurate results up to 92%, and 76%, and 67% for the last two classifiers which are NB and DT, respectively. Moreover, SVM shows the highest sensitivity and specificity for all seizure types compared to the other three classifiers.
In the second scenario, after applying the ApEn features with (5653) of training data as an input to the classifier’s models, SVM having a clear superiority over the other three classifiers with 83% while it was 76% for KNN, where the last two classifiers DT and NB obtained 65% and 69% respectively. On the same side, the sensitivity and specificity results showed that SVM clearly outperformed the other three classifiers.
Finally, for the last scenario, the number of entropy features with training data were (6267), SVM classifier again outperforms on other three classifier with accuracy value up to 91% where the second accuracy observed with KNN classifier with 88% while DT classifier solves in third place with 69% and last classifier was NB with 53%. Whereas sensitivity and specificity the highest value observed with SVM as well.
[1] Kumar, Y., Dewal, M.L., Anand, R.S. (2012). Features extraction of EEG signals using approximate and sample entropy. In 2012 IEEE Students' Conference on Electrical, Electronics and Computer Science, pp. 1-5. https://doi.org/10.1109/SCEECS.2012.6184830
[2] Bazira, P.J. (2021). An overview of the nervous system. Surgery (Oxford), 39(8): 451-462.
[3] Catala, M., Kubis, N. (2013). Gross anatomy and development of the peripheral nervous system. Handbook of Clinical Neurology, 115: 29-41. https://doi.org/10.1016/B978-0-444-52902-2.00003-5
[4] Browning, K.N., Travagli, R.A. (2014). Central nervous system control of gastrointestinal motility and secretion and modulation of gastrointestinal functions. Comprehensive Physiology, 4(4): 1339. https://doi.org/10.1002/cphy.c130055
[5] Gordan, R., Gwathmey, J.K., Xie, L.H. (2015). Autonomic and endocrine control of cardiovascular function. World Journal of Cardiology, 7(4): 204. https://doi.org/10.4330/wjc.v7.i4.204
[6] Bordoni, B., Purgol, S., Bizzarri, A., Modica, M., Morabito, B. (2018). The influence of breathing on the central nervous system. Cureus, 10(6): e2724. https://doi.org/10.7759/cureus.2724
[7] Tan, C.L., Knight, Z.A. (2018). Regulation of body temperature by the nervous system. Neuron, 98(1): 31-48. https://doi.org/10.1016/j.neuron.2018.02.022
[8] Saputro, I.R.D., Maryati, N.D., Solihati, S.R., Wijayanto, I., Hadiyoso, S., Patmasari, R. (2019). Seizure type classification on EEG signal using support vector machine. In Journal of Physics: Conference Series, 1201(1): 012065. https://doi.org/10.1088/1742-6596/1201/1/012065
[9] Subasi, A. (2005). Epileptic seizure detection using dynamic wavelet network. Expert Systems with Applications, 29(2): 343-355. https://doi.org/10.1016/j.eswa.2005.04.007
[10] Garg, P., Kumar, P., Shakya, K., Khurana, D., Chowdhury, S.R. (2019). Detection of Brain Stroke using Electroencephalography (EEG). In 2019 13th International Conference on Sensing Technology (ICST), pp. 1-6. https://doi.org/10.1109/ICST46873.2019.9047678
[11] Subha, D.P., Joseph, P.K., Acharya U, R., Lim, C.M. (2010). EEG signal analysis: A survey. Journal of Medical Systems, 34(2): 195-212. https://doi.org/10.1007/s10916-008-9231-z
[12] Duru, A.D. (2019). Determination of increased mental workload condition from EEG by the use of classification techniques. International Journal of Advances in Engineering and Pure Sciences, 31(1): 47-52. https://doi.org/10.7240/jeps.459420
[13] Cassani, R., Estarellas, M., San-Martin, R., Fraga, F.J., Falk, T.H. (2018). Systematic review on resting-state EEG for Alzheimer's disease diagnosis and progression assessment. Disease markers, 2018: 5174815. https://doi.org/10.1155/2018/5174815
[14] Tsolaki, A., Kazis, D., Kompatsiaris, I., Kosmidou, V., Tsolaki, M. (2014). Electroencephalogram and Alzheimer’s disease: clinical and research approaches. International Journal of Alzheimer’s Disease, 2014: 349249. https://doi.org/10.1155/2014/349249
[15] Fisher, R.S., Boas, W.V.E., Blume, W., Elger, C., Genton, P., Lee, P., Engel Jr, J. (2005). Epileptic seizures and epilepsy: Definitions proposed by the International League Against Epilepsy (ILAE) and the International Bureau for Epilepsy (IBE). Epilepsia, 46(4): 470-472. https://doi.org/10.1111/j.0013-9580.2005.66104.x
[16] Hirtz, D., Thurman, D.J., Gwinn-Hardy, K., Mohamed, M., Chaudhuri, A.R., Zalutsky, R. (2007). How common are the “common” neurologic disorders? Neurology, 68(5): 326-337. https://doi.org/10.1212/01.wnl.0000252807.38124.a3
[17] Kumar, S.P., Sriraam, N., Benakop, P.G., Jinaga, B.C. (2010). Entropies based detection of epileptic seizures with artificial neural network classifiers. Expert Systems with Applications, 37(4): 3284-3291. https://doi.org/10.1016/j.eswa.2009.09.051
[18] Das, A.B., Bhuiyan, M.I.H. (2016). Discrimination and classification of focal and non-focal EEG signals using entropy-based features in the EMD-DWT domain. Biomedical Signal Processing and Control, 29: 11-21. https://doi.org/10.1016/j.bspc.2016.05.004
[19] Wijayanto, I., Hartanto, R., Nugroho, H.A., Winduratna, B. (2019, August). Seizure type detection in epileptic EEG signal using empirical mode decomposition and support vector machine. In 2019 International Seminar on Intelligent Technology and Its Applications (ISITIA), pp. 314-319. https://doi.org/10.1109/ISITIA.2019.8937205
[20] Alturki, F.A., AlSharabi, K., Abdurraqeeb, A.M., Aljalal, M. (2020). EEG signal analysis for diagnosing neurological disorders using discrete wavelet transform and intelligent techniques. Sensors, 20(9): 2505.
[21] Srinath, R., Gayathri, R. (2021). Detection and classification of electroencephalogram signals for epilepsy disease using machine learning methods. International Journal of Imaging Systems and Technology, 31(2): 729-740. https://doi.org/10.1002/ima.22486
[22] Sharanreddy, P., Kulkarni, P.K. (2013). EEG signal classification for epilepsy seizure detection using improved approximate entropy. Int J Public Health Sci, 2(1): 23-32.
[23] Rasheed, K., Qayyum, A., Qadir, J., et al. (2020). Machine learning for predicting epileptic seizures using EEG signals: A review. IEEE Reviews in Biomedical Engineering, 14: 139-155. https://doi.org/10.1109/RBME.2020.3008792
[24] Natu, M., Bachute, M., Gite, S., Kotecha, K., Vidyarthi, A. (2022). Review on epileptic seizure prediction: machine learning and deep learning approaches. Computational and Mathematical Methods in Medicine, 2022: 7751263. https://doi.org/10.1155/2022/7751263
[25] Hussein, R., Palangi, H., Ward, R.K., Wang, Z.J. (2019). Optimized deep neural network architecture for robust detection of epileptic seizures using EEG signals. Clinical Neurophysiology, 130(1): 25-37. https://doi.org/10.1016/j.clinph.2018.10.010
[26] Zhou, M., Tian, C., Cao, R., et al. (2018). Epileptic seizure detection based on EEG signals and CNN. Frontiers in Neuroinformatics, 12: 95. https://doi.org/10.3389/fninf.2018.00095
[27] Shoeb, A.H., Guttag, J.V. (2010). Application of machine learning to epileptic seizure detection. in Proceedings of the 27th International Conference on Machine Learning (ICML-10), pp. 975-982.
[28] Obeid, I., Picone, J. (2016). The temple university hospital EEG data corpus. Frontiers in Neuroscience, 10: 196. https://doi.org/10.3389/fnins.2016.00196
[29] Shah, V., Von Weltin, E., Lopez, S., et al. (2018). The temple university hospital seizure detection corpus. Frontiers in Neuroinformatics, 12: 83. https://doi.org/10.3389/fninf.2018.00083
[30] Ferrell, S., von Weltin, E., Obeid, I., Picone, J. (2018). Open source resources to advance EEG research. In 2018 IEEE Signal Processing in Medicine and Biology Symposium (SPMB), pp. 112-116. https://doi.org/10.1109/SPMB.2018.8615622
[31] Ferrell, S., Mathew, V., Refford, M., Tchiong, V., Ahsan, T., Obeid, I., Picone, J. (2020). The temple university hospital eeg corpus: Electrode location and channel labels. Institute for Signal and Information Processing Report, 1(1): 1-9. https://doi.org/10.1109/SPMB50085.2020.9353623
[32] Acharya, J.N., Acharya, V.J. (2019). Overview of EEG montages and principles of localization. Journal of Clinical Neurophysiology, 36(5): 325-329. https://doi.org/10.1097/WNP.0000000000000538
[33] Satapathy, S.K., Dehuri, S., Jagadev, A.K., Mishra, S. (2019). EEG brain signal classification for epileptic seizure disorder detection. Academic Press.
[34] Engel Jr, J. (2006). Report of the ILAE classification core group. Epilepsia, 47(9): 1558-1568. https://doi.org/10.1111/j.1528-1167.2006.00215.x
[35] Roy, S., Asif, U., Tang, J., Harrer, S. (2020). Seizure type classification using EEG signals and machine learning: Setting a benchmark. In 2020 IEEE Signal Processing in Medicine and Biology Symposium (SPMB), pp. 1-6. https://doi.org/10.1109/SPMB50085.2020.9353642
[36] de Cheveigné, A., Nelken, I. (2019). Filters: when, why, and how (not) to use them. Neuron, 102(2): 280-293. https://doi.org/10.1016/j.neuron.2019.02.039
[37] Nayak, C.S., Anilkumar, A.C. (2020). Eeg normal waveforms. StatPearls [Internet].
[38] Bhattacharyya, A., Pachori, R.B. (2017). A multivariate approach for patient-specific EEG seizure detection using empirical wavelet transform. IEEE Transactions on Biomedical Engineering, 64(9): 2003-2015. https://doi.org/10.1109/TBME.2017.2650259
[39] Nussbaumer, H.J. (1981). The fast Fourier transform. In Fast Fourier Transform and Convolution Algorithms, pp. 80-111. https://doi.org/10.1007/978-3-662-00551-4_4
[40] Lipsitz, L.A., Goldberger, A.L. (1992). Loss of'complexity'and aging: potential applications of fractals and chaos theory to senescence. Jama, 267(13): 1806-1809. https://doi.org/10.1001/jama.1992.03480130122036
[41] Xiang, J., Li, C., Li, H., Cao, R., Wang, B., Han, X., Chen, J. (2015). The detection of epileptic seizure signals based on fuzzy entropy. Journal of Neuroscience Methods, 243: 18-25. https://doi.org/10.1016/j.jneumeth.2015.01.015
[42] Li, P., Karmakar, C., Yearwood, J., Venkatesh, S., Palaniswami, M., Liu, C. (2018). Detection of epileptic seizure based on entropy analysis of short-term EEG. PloS one, 13(3): e0193691. https://doi.org/10.1371/journal.pone.0193691
[43] Ferlazzo, E., Mammone, N., Cianci, V., et al. (2014). Permutation entropy of scalp EEG: A tool to investigate epilepsies: Suggestions from absence epilepsies. Clinical Neurophysiology, 125(1): 13-20. https://doi.org/10.1016/j.clinph.2013.06.023
[44] Zhang, Z., Chen, Z., Zhou, Y., Du, S., Zhang, Y., Mei, T., Tian, X. (2014). Construction of rules for seizure prediction based on approximate entropy. Clinical Neurophysiology, 125(10): 1959-1966. https://doi.org/10.1016/j.clinph.2014.02.017
[45] Lehnertz, K., Dickten, H. (2015). Assessing directionality and strength of coupling through symbolic analysis: An application to epilepsy patients. Philosophical Transactions of the Royal Society A: Mathematical, Physical and Engineering Sciences, 373(2034): 20140094. https://doi.org/10.1098/rsta.2014.0094
[46] Song, Y., Zhang, J. (2016). Discriminating preictal and interictal brain states in intracranial EEG by sample entropy and extreme learning machine. Journal of Neuroscience Methods, 257: 45-54. https://doi.org/10.1016/j.jneumeth.2015.08.026
[47] Yentes, J.M., Hunt, N., Schmid, K.K., Kaipust, J.P., McGrath, D., Stergiou, N. (2013). The appropriate use of approximate entropy and sample entropy with short data sets. Annals of Biomedical Engineering, 41(2), 349-365. https://doi.org/10.1007/s10439-012-0668-3
[48] Pincus, S.M. (1991). Approximate entropy: a complexity measure for biological time series data. In Proceedings of the 1991 IEEE Seventeenth Annual Northeast Bioengineering Conference, pp. 35-36. https://doi.org/10.1109/NEBC.1991.154568
[49] Ocak, H. (2009). Automatic detection of epileptic seizures in EEG using discrete wavelet transform and approximate entropy. Expert Systems with Applications, 36(2): 2027-2036. https://doi.org/10.1016/j.eswa.2007.12.065
[50] Srinivasan, V., Eswaran, C., Sriraam, N. (2007). Approximate entropy-based epileptic EEG detection using artificial neural networks. IEEE Transactions on information Technology in Biomedicine, 11(3): 288-295. https://doi.org/10.1109/TITB.2006.884369
[51] Kiranmayi, G.R., Udayashankara, V. (2014). EEG subband analysis using approximate entropy for the detection of epilepsy. IOSR Journal of Computer Engineering, 16(5): 21-27.
[52] Pincus, S.M. (1991). Approximate entropy as a measure of system complexity. Proceedings of the National Academy of Sciences, 88(6): 2297-2301. https://doi.org/10.1073/pnas.88.6.2297
[53] Al-Fahoum, A.S., Al-Fraihat, A.A. (2014). Methods of EEG signal features extraction using linear analysis in frequency and time-frequency domains. International Scholarly Research Notices, 2014.
[54] Quinlan, J.R. (2014). C4. 5: Programs for Machine Learning. Elsevier.
[55] Cortes, C., Vapnik, V. (1995). Support-vector networks. Machine Learning, 20(3): 273-297. https://doi.org/10.1007/BF00994018
[56] Al-Shamaa, Z.Z., Kurnaz, S., Duru, A.D., Peppa, N., Mirnezami, A.H., Hamady, Z.Z. (2020). The use of hellinger distance undersampling model to improve the classification of disease class in imbalanced medical datasets. Applied Bionics and Biomechanics, 2020: 8824625. https://doi.org/10.1155/2020/8824625
[57] Aličković, E., Subasi, A. (2017). Breast cancer diagnosis using GA feature selection and Rotation Forest. Neural Computing and Applications, 28(4): 753-763. https://doi.org/10.1007/s00521-015-2103-9
[58] Huang, M.W., Chen, C.W., Lin, W.C., Ke, S.W., Tsai, C.F. (2017). SVM and SVM ensembles in breast cancer prediction. PloS one, 12(1): e0161501. https://doi.org/10.1371/journal.pone.0161501
[59] Saccá, V., Campolo, M., Mirarchi, D., Gambardella, A., Veltri, P., Morabito, F.C. (2018). On the classification of EEG signal by using an SVM based algorithm. In Multidisciplinary approaches to neural computing, pp. 271-278. https://doi.org/10.1007/978-3-319-56904-8_26
[60] Prabhat, A., Khullar, V. (2017). Sentiment classification on big data using Naïve Bayes and logistic regression. In 2017 International Conference on Computer Communication and Informatics (ICCCI), pp. 1-5. https://doi.org/10.1109/ICCCI.2017.8117734
[61] Raizada, R.D., Lee, Y.S. (2013). Smoothness without smoothing: why Gaussian naive Bayes is not naive for multi-subject searchlight studies. PloS one, 8(7): e69566. https://doi.org/10.1371/journal.pone.0069566
[62] Mohamed, A., Uçan, O.N., Bayat, O., Duru, A.D. (2020). Classification of resting-state status based on sample entropy and power spectrum of electroencephalography (EEG). Applied Bionics and Biomechanics, 2020: 8853238. https://doi.org/10.1155/2020/8853238
[63] Fix, E. (1951). Discriminatory analysis: nonparametric discrimination, consistency properties. USAF school of Aviation Medicine.
[64] Ahmad, M.A., Khan, N.A., Majeed, W. (2014). Computer assisted analysis system of electroencephalogram for diagnosing epilepsy. In 2014 22nd International Conference on Pattern Recognition (ICPR), pp. 3386-3391.
[65] Fergus, P., Hignett, D., Hussain, A.J., Al-Jumeily, D. (2014). An advanced machine learning approach to generalised epileptic seizure detection. In International Conference on Intelligent Computing, pp. 112-118. https://doi.org/10.1007/978-3-319-09330-7_14
[66] Ein Shoka, A.A., Alkinani, M.H., El-Sherbeny, A.S., El-Sayed, A., Dessouky, M.M. (2021). Automated seizure diagnosis system based on feature extraction and channel selection using EEG signals. Brain Informatics, 8(1): 1-16. https://doi.org/10.1186/s40708-021-00123-7
[67] Birjandtalab, J., Pouyan, M. B., Cogan, D., Nourani, M., Harvey, J. (2017). Automated seizure detection using limited-channel EEG and non-linear dimension reduction. Computers in Biology and Medicine, 82: 49-58. https://doi.org/10.1016/j.compbiomed.2017.01.011
[68] Chen, D., Wan, S., Xiang, J., Bao, F.S. (2017). A high-performance seizure detection algorithm based on Discrete Wavelet Transform (DWT) and EEG. PloS one, 12(3): e0173138. https://doi.org/10.1371/journal.pone.0173138
[69] Wu, M., Qin, H., Wan, X., Du, Y. (2021). HFO detection in epilepsy: A stacked denoising autoencoder and sample weight adjusting factors-based method. IEEE Transactions on Neural Systems and Rehabilitation Engineering, 29: 1965-1976. https://doi.org/10.1109/TNSRE.2021.3113293
[70] Satapathy, S.K., Dehuri, S., Jagadev, A.K. (2017). ABC optimized RBF network for classification of EEG signal for epileptic seizure identification. Egyptian Informatics Journal, 18(1): 55-66. https://doi.org/10.1016/j.eij.2016.05.001
[71] Lima, C.A., Coelho, A.L., Chagas, S. (2009). Automatic EEG signal classification for epilepsy diagnosis with Relevance Vector Machines. Expert Systems with Applications, 36(6): 10054-10059. https://doi.org/10.1016/j.eswa.2009.01.022
[72] Guo, L., Rivero, D., Seoane, J.A., Pazos, A. (2009). Classification of EEG signals using relative wavelet energy and artificial neural networks. In Proceedings of the first ACM/SIGEVO Summit on Genetic and Evolutionary Computation, pp. 177-184. https://doi.org/10.1145/1543834.1543860
[73] Kannathal, N., Choo, M.L., Acharya, U.R., Sadasivan, P.K. (2005). Entropies for detection of epilepsy in EEG. Computer Methods and Programs in Biomedicine, 80(3): 187-194. https://doi.org/10.1016/j.cmpb.2005.06.012
[74] Bhattacharyya, A., Sharma, M., Pachori, R.B., Sircar, P., Acharya, U.R. (2018). A novel approach for automated detection of focal EEG signals using empirical wavelet transform. Neural Computing and Applications, 29(8): 47-57. https://doi.org/10.1007/s00521-016-2646-4
[75] Zhu, G., Li, Y., Wen, P.P., Wang, S., Xi, M. (2013). Epileptogenic focus detection in intracranial EEG based on delay permutation entropy. In AIP conference proceedings, 1559(1): 31-36. https://doi.org/10.1063/1.4824993
[76] Sharma, R., Pachori, R.B., Acharya, U.R. (2015). An integrated index for the identification of focal electroencephalogram signals using discrete wavelet transform and entropy measures. Entropy, 17(8): 5218-5240. https://doi.org/10.3390/e17085218