Ahmet Solak* | Rahime Ceylan
© 2022 IIETA. This article is published by IIETA and is licensed under the CC BY 4.0 license (http://creativecommons.org/licenses/by/4.0/).
OPEN ACCESS
Pneumonia is one of the diseases with the highest mortality in children. Early diagnosis is vital for the recovery of children and saving their lives. With the developments in artificial intelligence, the use of computer aided systems has become widespread. This has increased reliable, accurate and fast on studies about classification, segmentation and detection. In this study, pneumonia and healthy chest X-ray images were classified using capsule network. This model is specialized and adapted to the study in a specific way. K-fold cross validation and preprocessing of images were also applied to improve the study performance. As a result of the study, accuracy, precision, recall, F1-score and AUC scores were obtained as 0.984, 0.996, 0.971, 0.983, 0.974, respectively. The proposed model has been compared with state-of-the-art models and studies in the literature, and it is seen that our study has achieved excellent results.
binary classification, chest X-ray, capsule network, pneumonia
Pneumonia is one of the acute respiratory infections of the lungs. It can develop for many reasons, such as bacteria, viruses, or fungi in the air. It is mostly associated with the elderly but is the largest infectious disease-causing death in children worldwide. According to the World Health Organization (WHO), more than 740,000 children under the age of five died from pneumonia worldwide in 2019, accounting for 14% of all deaths in this age group [1].
Early diagnosis and treatment of pneumonia is of great importance for the treatment of children. One of the technologies frequently used for diagnosis of pneumonia is X-ray. Radiologists can easily diagnose whether a patient has pneumonia with the help of X-ray images. However, increased working hours and fatigue complicate the work of radiologists. Computer Aided Diagnosis (CAD) systems have become popular, especially in the last three decades with the acceleration of artificial intelligence. Many artificial intelligence models now make more successful inferences than experts [2-4]. However, the use of CAD systems alone is not yet appropriate for ethical and legal reasons.
Diagnosis of pneumonia also had its share of these developments. Kermany et al. [5] performed a classification study on chest X-ray images with the InceptionV3 network using weights trained on the IMAGENET dataset for the use of transfer learning in medical images. They achieved 93.2% sensitivity, 90.1% specificity, and 92.8% accuracy with 96.8% AUC for normal and pneumonia classification. Rajaraman et al. [6] conducted three different classification studies (Normal - Pneumonia, Bacterial Pneumonia - Viral pneumonia, and Normal - Bacterial pneumonia - Viral Pneumonia) using a customized CNN and VGG16 model to detect pneumonia from chest X-ray images. As a result of the study, the best scores for normal and pneumonia classification were 96.2% accuracy, 99.3% AUC, 97.7% precision, 96.2% recall, and 97% F1-score. Ayan et al. [7] compared the VGG16 and Xception networks for pneumonia classification. In both networks, fine tuning was used during the training phase. As a result of the study, the VGG16 network gave more successful results. Evaluation results for this network were 87% accuracy, 82% sensitivity, 91% specificity. Saraiva et al. [8] trained CNN for pneumonia classification using X-ray images. Unlike previous studies, they used 5-fold cross validation in their study to evaluate the generalization capacity of the model. As a result of the study, they achieved an average of 95.3% accuracy on the test images. Stephen et al. [9] classified healthy and pneumonia from chest X-ray images. In the study, they built a convolutional neural network model from scratch to extract features from a given chest X-ray image and classify it to determine whether a person has pneumonia. This is different from other methods that rely solely on transfer learning approaches or traditional handcrafted techniques to achieve outstanding classification performance. As a result of studies with different image sizes, the best results were obtained for 95.31% training accuracy and 93.73% validation accuracy. Gülgün and Hamza [10] used three different deep learning models to classify whether they were pneumonia or healthy from X-ray images: Convolutional Neural Network, Data Augmentation-Convolutional Neural Network, and Transfer Learning. At the end of the study, the convolutional neural network model, which was applied with the data augmentation technique, was obtained with the most successful performance. They achieved 93.4% accuracy on the test images. Liang and Zheng [11] used the residual structure to overcome the overfitting and distortion problems instead of the classical CNN structure to detect childhood pneumonia, and extended convolution to overcome the problem of feature space information loss caused by the increase in the depth of the model. In addition, they used transfer learning (VGG16, Inception, DenseNet etc.) to overcome the difficulty in model training due to insufficient data. As a result of the study, they obtained 90.5% accuracy, 89.1% precision, 96.7% recall, 92.7% F1-score and 95.3% AUC score. Çınar et al. [12] performed transfer learning using five different models trained on the ImageNet dataset in order to classify chest X-ray images. They then combined these models to obtain an ensemble model. As a result of the study, they achieved 96.39% accuracy, 99.34% AUC, 93.28% precision and 99.62% recall on test images with the ensemble model. Çınar et al. [12] developed a new model based on the layers of ResNet50 and classified pneumonia with this model. The developed model was compared with different transfer learning models and previous studies and was found to be more successful. As a result of the study, 97.12% accuracy, 95.78% sensitivity, 97.69% specificity and 94.51% F1-score were obtained. Manickam et al. [13] performed a comprehensive classification analysis on chest X-ray images. For this purpose, different transfer learning structures, optimizers, batch size are used. The best results were obtained with 93.06% accuracy, 88.97% precision rate, 96.78% Recall rate and 92.71% F1-score rate with the proposed Resnet 50 structure.
In this study, the detection of pneumonia from X-ray images taken from children was studied. Chest X-ray dataset was selected from a retrospective cohort of one- to five-year-old pediatric patients from Guangzhou Women's and Children's Medical Center, Guangzhou [5]. As a method, capsule networks are used both to prevent information loss in feature maps due to the pooling layer in traditional CNN architecture and to reach higher accuracy with a lower number of epochs compared to CNN. In addition, k-fold cross validation was used to minimize the deviations and errors caused by scattering and fragmentation in the training and test data set, and to generalize the study results. As a result of the study, the proposed method was compared with the state-of-the-art models and studies in the literature and its superiorities were revealed. The contributions of the study to the literature are as follows:
• By using capsule networks instead of CNN architecture, data loss in the pooling process is prevented.
• Reliability of results is increased by using k-fold cross validation
•Studies results have been improved by applying image enhancement.
• The results of the study were compared with the studies in the literature.
CNN is one of the most basic models used in deep learning. It has a large share in deep learning's current popularity and in the development of new models. It basically consists of convolution layers, pooling layers, activation function and fully connected layers. In the following years, researchers revealed that reducing the data size in the pooling layer caused some important information loss in the features learned by the network. Therefore, in order to prevent this loss of information, capsule networks were introduced by Sabour et al. [14].
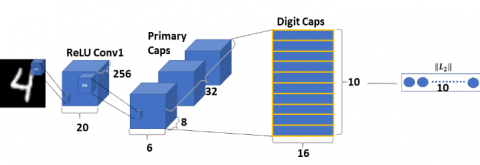
In the original paper, capsule networks are basically defined as two parts, Primary Caps and Digit Caps. In the Primary Caps section, unlike CNN, capsules are created after the convolutional layers. These capsules contain the spatial properties of the image such as edge, angle, height. The capsules are then passed through the vector squash function, which is defined specifically for capsule networks, instead of the classical scalar activation functions. In Eq. (1), the equation of the squash function is given. Feature vectors obtained from Primary Caps output are transferred to Digit Caps. Here, class estimation is made with feature vectors according to the number of classes in the data set. Again, different from classical CNN, operations are performed using dynamic routing algorithm instead of back propagation algorithm. In Figure 1, a general capsule network structure from the original paper is shared.
$v_j=\frac{\left\|s_j\right\|^2}{1+\left\|s_j\right\|^2} \frac{s_j}{\left\|s_j\right\|}$ (1)
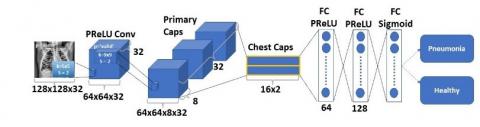
Capsule networks have been used in classification and segmentation studies in the biomedical field since their inception [15-19]. In this paper, a different model for pneumonia detection was developed by customizing the capsule network shown in Figure 1, and this model is named Chest-Caps. The proposed model is shared in Figure 2. In contrast with the classical capsule network, Parametric ReLU (PReLU) is used as the activation function in the convolution layer. In addition, the kernel size was chosen as 5. Primary Caps and Digit Caps layers are adapted to the classification problem, two consecutive dense layers are used in the fully connected layer section at the output and PReLU is chosen as the activation function. In the last section, the sigmoid activation function was used because class estimation was made for binary classification.
Figure 1. Capsule network architecture
Figure 2. Proposed chest caps architecture
In this section, the data set used in the study, the methodology of the study, the performance metrics and the results obtained within the scope of the study are presented.
3.1 Dataset
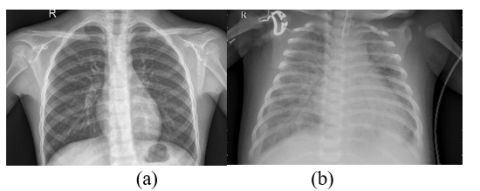
In this study, Chest X-ray dataset was selected from a retrospective cohort of one- to five-year-old pediatric patients from Guangzhou Women's and Children's Medical Center, Guangzhou [5]. The dataset consists of a total of 5856 chest X-ray images, of which 1583 are normal and 4273 are pneumonia. In Figure 3, an example of the images used in the data set is given.
Figure 3. The samples from dataset. a) Normal chest X-ray image; b) Pneumonia chest X-ray image
Pre-processing was applied to the images in order to extract features from the images in the dataset and improve the study performance. For this purpose, Contrast Limited Adaptive Histogram Equalization (CLAHE) was applied to the images. The images obtained after applying CLAHE to the images in Figure 3 are given in Figure 4.
Figure 4. Pre-processed Images. a) After applying CLAHE to normal chest X-ray image; b) After applying CLAHE to pneumonia chest X-ray image
3.2 Methodology
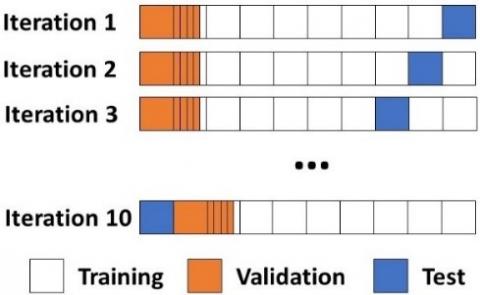
First, since k-fold cross validation will be used in the study, the datasets allocated for training (1349 healthy, 3883 pneumonia) and testing (234 healthy, 390 pneumonia) were combined. Thus, a total of 5856 chest X-rays, 1583 healthy images and 4273 pneumonia images, were used in the study. The dataset was divided into 10 parts with 10-fold cross validation, 1 part was reserved for testing and the remaining 9 parts were used in the training phase. 20% of the data used in training is reserved for validation. Figure 5 shows the general scheme of 10-fold cross validation. In addition, the numbers of images reserved for training, validation and testing during cross validation are shown in Table 1. In the study, separate training was carried out for the original data set (DS1) and the CLAHE applied data set (DS2) as separately. In Table 2, the parameter values used throughout the study are shared.
Table 1. Number of images
|
Train Images |
Validation Images |
Test Images |
|
4216 |
1054 |
586 |
Table 2. Study parameters
|
Parameters |
Values |
|
Image Size |
128 |
|
k-fold for cross validation |
k=10 |
|
Batch Size |
256 |
|
Learning Rate |
From 10-3 to 10-5 |
|
Epochs |
50 |
|
Data Augmentation |
No |
Figure 5. General scheme of 10-fold cross validation
3.3 Performance metrics
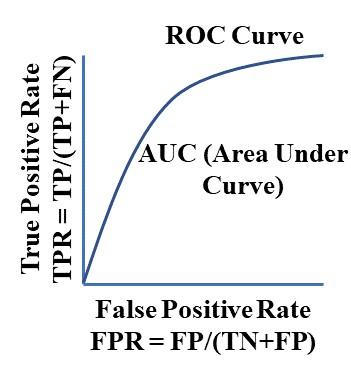
The performance of the pneumonia detection system was evaluated with different evaluation metrics. The accuracy metric is one of the basic metrics used in every classification study. When this metric is supported with different metrics, more reliable results are obtained in terms of quantitative evaluation. For this purpose, precision, recall, F1-score and Area Under Curve (AUC) metrics were also used in this paper. The precision, recall, and F1-score are given by Eq. (2), Eq. (3) and Eq. (4), respectively. Parameters in the equations represent True Positive (TP), True Negative (TN), False Positive (FP) and False Negative (FN). The AUC-ROC curve used to calculate the AUC score is given in Figure 6. Moreover, confusion matrices are also included in the comparison section with state-of-the-art models.
Precision $=\frac{T P}{T P+F P}$ (2)
Recall $=\frac{T P}{T P+F N}$ (3)
$F 1$ score $=\frac{2(\text { Precision } * \text { Recall })}{\text { Precision }+\text { Recall }}$ (4)
Figure 6. AUC-ROC Curve
3.4 Experimental results
First, the proposed model is trained with two datasets (DS1 and DS2). The mean results of these training are given in Table 3. In the first row, in training made with DS1, accuracy, precision, recall, F1-score and AUC score were obtained as 0.838, 0.789, 0.784, 0.786, 0.971, respectively. However, with DS2, accuracy, precision, recall, F1-score, and AUC score were obtained as 0.984, 0.996, 0.971, 0.983, 0.974, respectively.
As can be clearly seen in Table 3, the results obtained with the DS2 are far ahead based on each metric compared. In addition, when the studies were compared in terms of training time, it can be seen that the training period on DS2 takes approximately 4% shorter than the training period on DS1. These results show that applying CLAHE to the data set makes a significant improvement in the study performance.
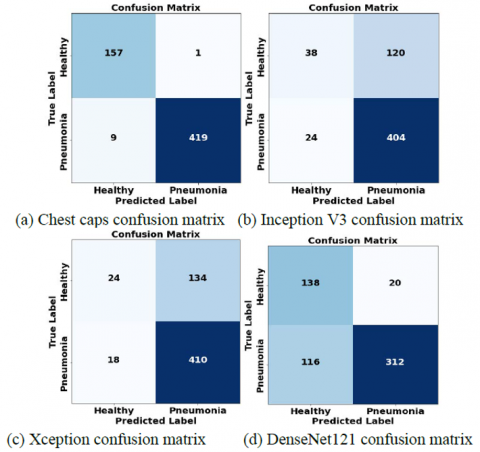
In the second stage of the study, with DS2, which dataset had the best results in the first stage, state-of-the-art models were trained, and the results were compared. InceptionV3 [20], Xception [21], DenseNet121 [22] models were used for comparison. Studies were performed with 10-fold cross validation as in the first part, and averages were taken for each metric.
Figure 7 provides a graphical representation of Chest Caps and state-of-the-art models for each metric. In Figure 8, the confusion matrices obtained on the test images of each model is given. As can be seen clearly in both impressions, the Chest-Caps outperformed the other models in every metric.
Table 3. Mean results of proposed model study
|
Dataset |
Accuracy |
Precision |
Recall |
F1-Score |
AUC-Score |
Total Training Time |
|
DS1 |
0.838 |
0.789 |
0.784 |
0.786 |
0.971 |
6:41:41 |
|
DS2 |
0.984 |
0.996 |
0.971 |
0.983 |
0.974 |
6:32:30 |
Figure 7. Metric comparison for all models
Figure 8. Confusion matrices of models
In this section, the results obtained in the study are compared with the existing studies and methods in the literature. Chest X-ray dataset was selected from a retrospective cohort of one- to five-year-old pediatric patients from Guangzhou Women's and Children's Medical Center, Guangzhou [5] in all compared studies. In Table 4, the models that were compared and recommended in each study are given separately. Since different metrics were used in each study for comparison, five different metrics were used to compare our study with more studies.
As can be seen in Table 4, the proposed model is by far better than the others in accuracy, precision and F1-score values. Chouhan et al. [6] achieved better results for recall and AUC score values. However, the next best scores on these metrics belong to the proposed model, and there is little difference in these metrics between the two studies.
As seen in Table 4, in the studies in the literature, modified CNN networks and different transfer learning networks were used in general. The capsule network was used in our study for the first time at least for this data set and outweighed the others. This demonstrates the novelty, correctness, reliability, and comparability of the study.
Table 4. Comparison of studies
|
Study |
Model |
Data Augmentation |
Cross Validation |
Accuracy |
Precision |
Recall |
F1-Score |
AUC-Score |
|
Kermany et al. [5] |
InceptionV3 |
|
No |
0.928 |
- |
0.932 |
- |
0.968 |
|
Rajaraman et al. [6] |
Customized VGG16 Sequential CNN Residual CNN Inception CNN |
|
No |
0.957 0.943 0.910 0.886 |
0.951 0.920 0.908 0.887 |
0.983 0.980 0.954 0.939 |
0.967 0.957 0.931 0.913 |
0.990 0.983 0.967 0.922 |
|
Ayan et al. [7] |
Xception VGG16 |
Yes |
No |
0.820 0.870 |
- |
0.850 0.820 |
- |
- |
|
Saraiva et al. [8] |
Proposed CNN |
No |
5-fold Cross Validation |
0.953 |
- |
- |
- |
- |
|
Okeke et al. [9] |
Proposed CNN |
Yes |
No |
0.937 |
- |
- |
- |
- |
|
Gülgün et al. [10] |
Proposed CNN |
Yes |
No |
0.934 |
- |
- |
-- |
- |
|
Liang et al. [11] |
Proposed CNN VGG 16 DenseNet121 InceptionV3 Xception |
Yes |
No |
0.905 0.742 0.819 0.853 0.878 |
0.891 0.723 0.792 0.916 0.857 |
0.967 0.951 0.964 0.841 0.967 |
0.927 0.822 0.869 0.877 0.908 |
0.953 0.840 0.769 0.655 0.930 |
|
Chouhan et al. [23] |
AlexNet DenseNet121 InceptionV3 GoogLeNet ResNet18 Ensemble model |
Yes |
No |
0.928 0.926 0.920 0.931 0.942 0.963 |
0.902 0.911 0.903 0.904 0.915 0.932 |
0.989 0.992 0.984 0.994 0.994 0.996 |
- |
0.978 0.987 0.973 0.982 0.993 0.993 |
|
Çınar et al. [12] |
Improved Model DenseNet201 ResNet50 Inceptionv3 GoogleNet AlexNet |
|
No |
0.971 0.968 0.963 0.953 0.940 0.910 |
- |
0.957 0.953 0.929 0.976 0.865 0.983 |
0.945 0.937 0.929 0.943 0.887 0.792 |
- |
|
Manickam et al. [13] |
ResNet50 InceptionV3 InceptionResNetV2 |
Yes |
No |
0.930 0.929 0.924 |
0.889 0.887 0.888 |
0.967 0.927 0.932 |
0.927 0.906 0.909 |
0.930 0.910 0.910 |
|
This Study |
InceptionV3 [20] Xception [21] DenseNet121 [22] Chest-Caps* |
No |
10-fold Cross Validation |
0.754 0.741 0.768 0.984 |
0.945 0.958 0.941 0.996 |
0.770 0.754 0.729 0.971 |
0.848 0.843 0.819 0.983 |
0.701 0.666 0.746 0.974 |
In this paper, a binary classification as healthy and pneumonia was made from the chest X-ray dataset used for the diagnosis of pneumonia, which is frequently seen in children under the age of five. Images were preprocessed using CLAHE to improve the study performance. In addition, 10-fold cross validation was used to improve performance. Besides, the effect of the number of data allocated for validation to the study was also observed.
As a result of the study, 15% better results were obtained in the pre-processed data set compared to the original data set in terms of accuracy and 20% better in other metrics. This ratio is very useful in an area such as classification where even a 1% improvement is important. As a result of the study, the proposed model obtained accuracy, precision, recall, F1-score and AUC scores of 0.984, 0.996, 0.971, 0.983, and 0.974, respectively, on the basis of metrics. As can be seen in the comparison with the studies in the literature, it is the best model in most of the metrics and the second-best model in the others by a small margin.
Overall, the study yielded very good results for diagnosing pneumonia. In order to improve the scores obtained in further studies, different models (hybrid or improved) can be developed, and an optimum model can be put forward for the data set by performing a detailed analysis to observe the studies given by different parameters.
[1] World Health Organization. (WHO). Pneumonia. https://www.who.int/news-room/fact-sheets/detail/pneumonia, accessed on May 20, 2022
[2] Ronneberger, O., Fischer, P., Brox, T. (2017). U-net: Convolutional networks for biomedical image segmentation. International Conference on Medical Image Computing and Computer-Assisted Intervention, pp. 234-241.
[3] Badrinarayanan, V., Kendall, A., Cipolla, R. (2017). Segnet: A deep convolutional encoder-decoder architecture for image segmentation. IEEE Transactions on Pattern Analysis and Machine Intelligence, 39: 2481-2495. http://dx.doi.org/10.1109/TPAMI.2016.2644615
[4] Wang, L., Lin, Z.Q., Wong, A. (2020). Covid-net: A tailored deep convolutional neural network design for detection of covid-19 cases from chest x-ray images. Scientific Reports, 10: 1-12. http://dx.doi.org/10.1038/s41598-020-76550-z
[5] Kermany, D.S., Goldbaum, M., Cai, W., Valentim, C.C., Liang, H., Baxter, S.L., McKeown, A., Yang, G., Wu, X., Yan, F. (2018). Identifying medical diagnoses and treatable diseases by image-based deep learning. Cell, 172(5): 1122-1131. http://dx.doi.org/10.1016/j.cell.2018.02.010
[6] Rajaraman, S., Candemir, S., Kim, I., Thoma, G., Antani, S. (2018). Visualization and interpretation of convolutional neural network predictions in detecting pneumonia in pediatric chest radiographs. Applied Sciences, 8: 1715. http://dx.doi.org/10.3390/app8101715
[7] Ayan, E., Ünver, H.M. (2019). Diagnosis of pneumonia from chest x-ray images using deep learning. 2019 Scientific Meeting on Electrical-Electronics & Biomedical Engineering and Computer Science (EBBT), Istanbul, Turkey, pp. 1-5. http://dx.doi.org/10.1109/EBBT.2019.8741582
[8] Saraiva, A.A., Ferreira, N.M.F., de Sousa, L.L., Costa, N.J.C., Sousa, J.V.M., Santos, D., Valente, A., Soares, S. (2019). Classification of images of childhood pneumonia using convolutional neural networks. Bioimaging. pp. 112-119.
[9] Stephen, O., Sain, M., Maduh, U.J., Jeong, D.U. (2019). An efficient deep learning approach to pneumonia classification in healthcare. Journal of Healthcare Engineering, 2019: 4180949. http://dx.doi.org/10.1155/2019/4180949
[10] Gülgün, O.D., Hamza, E. (2020). Classification performance comparisons of deep learning models in pneumonia diagnosis using chest x-ray images. Turkish Journal of Engineering, 4: 129-141. http://dx.doi.org/10.31127/tuje.652358
[11] Liang, G., Zheng, L. (2020). A transfer learning method with deep residual network for pediatric pneumonia diagnosis. Computer Methods and Programs in Biomedicine, 187: 104964. http://dx.doi.org/10.1016/j.cmpb.2019.06.023
[12] Çınar, A., Yıldırım, M., Eroğlu, Y. (2021). Classification of pneumonia cell images using improved resnet50 model. Traitement du Signal, 38(1): 165-173. http://dx.doi.org/10.18280/ts.380117
[13] Manickam, A., Jiang, J., Zhou, Y., Sagar, A., Soundrapandiyan, R., Samuel, R.D.J. (2021). Automated pneumonia detection on chest x-ray images: A deep learning approach with different optimizers and transfer learning architectures. Measurement, 184: 109953. http://dx.doi.org/10.1016/j.measurement.2021.109953
[14] Sabour, S., Frosst, N., Hinton, G.E. (2017). Dynamic routing between capsules. Advances in Neural Information Processing Systems. pp. 3856-3866.
[15] Deng, F., Pu, S., Chen, X., Shi, Y., Yuan, T., Pu, S. (2018). Hyperspectral image classification with capsule network using limited training samples. Sensors, 18: 3153. http://dx.doi.org/10.3390/s18093153
[16] Baydilli, Y.Y., Atila, Ü. (2020). Classification of white blood cells using capsule networks. Computerized Medical Imaging and Graphics, 80: 101699. http://dx.doi.org/10.1016/j.compmedimag.2020.101699
[17] Afshar, P., Heidarian, S., Naderkhani, F., Oikonomou, A., Plataniotis, K.N., Mohammadi, A. (2020). Covid-caps: A capsule network-based framework for identification of covid-19 cases from x-ray images. Pattern Recognition Letters, 138: 638-643. http://dx.doi.org/10.1016/j.patrec.2020.09.010
[18] LaLonde, R., Kandel, P., Spampinato, C., Wallace, M.B., Bagci, U. (2020). Diagnosing colorectal polyps in the wild with capsule networks. 2020 IEEE 17th International Symposium on Biomedical Imaging (ISBI), Iowa City, IA, USA, pp. 1086-1090. http://dx.doi.org/10.1109/ISBI45749.2020.9098411
[19] Goceri, E. (2020). Capsnet topology to classify tumours from brain images and comparative evaluation. IET Image Processing, 14: 882-889. http://dx.doi.org/10.1049/iet-ipr.2019.0312
[20] Szegedy, C., Vanhoucke, V., Ioffe, S., Shlens, J., Wojna, Z. (2016). Rethinking the inception architecture for computer vision. Proceedings of the IEEE Conference on Computer Vision and Pattern Recognition, Vegas, NV, USA, pp. 2818-2826. http://dx.doi.org/10.1109/CVPR.2016.308
[21] Chollet, F. (2017). Xception: Deep learning with depth wise separable convolutions. Proceedings of the IEEE Conference on Computer Vision and Pattern Recognition, pp. 1251-1258. http://dx.doi.org/10.1109/cvpr.2017.195
[22] Huang, G., Liu, Z., Van Der Maaten, L., Weinberger, K.Q. (2017). Densely connected convolutional networks. Proceedings of the IEEE Conference on Computer Vision and Pattern Recognition, Honolulu, HI, USA, pp. 4700-4708. http://dx.doi.org/10.1109/CVPR.2017.243
[23] Chouhan, V., Singh, S.K., Khamparia, A., Gupta, D., Tiwari, P., Moreira, C., Damaševičius, R., De Albuquerque, V.H.C. (2020). A novel transfer learning based approach for pneumonia detection in chest x-ray images. Applied Sciences, 10: 559. http://dx.doi.org/10.3390/app10020559