Jinwen Jiang
© 2022 IIETA. This article is published by IIETA and is licensed under the CC BY 4.0 license (http://creativecommons.org/licenses/by/4.0/).
OPEN ACCESS
In music composition, besides intended original orchestration, the main melody generally has a higher reproduction frequency. To better understand the content and idea of music works, this paper researches a novel method for extracting the features of music melody signals based on deep learning. At first, a supervised classification model is employed to select better features extracted from the raw data of music melody signals and create an optimal melody feature subset; then, the Temporal Convolution Network (TCN) is introduced to propose a new algorithm for detecting feature points of melody signals, and the detection principles are introduced in detail; after that, this paper elaborates on the melody signal feature point detection model built based on multi-branch and multi-task TCN, and gives the structures and work principles of the encoding module, decoding module, and mask estimation module of the TCN. At last, experimental results verify the validity of the proposed model.
deep learning, convolution network, music signal, melody feature extraction
Melody is the primary element of music works, it usually refers to an organized rhythmic sequence of music formed through artistic creation [1, 2]. Melody is composed of pitch, duration, and volume, and is represented by a timely linear sequence of notes or sounds that listeners identify as a single entity [3, 4]. A melody is an organic combination of basic musical elements such as mode, rhythm, tempo, intensity, tone and performance method, etc. In music composition, besides intended original orchestration, the main melody generally has a higher reproduction frequency [5-7]. The reproduction of main melody generally involves unexpected emotions or perceptions that can resonate with listeners [8-14]. To better understand the content and idea of music works, it’s a necessary work to extract the features of music melody signals [15-18].
Biswas et al. [19] proposed a method for objectively evaluating pitch in vocal monophonic music using several signal processing techniques and a database with 250 recordings containing both arohan and avarohan patterns rendered by 25 different singers of 10 Hindustani classical ragas. In their research, the fundamental frequency (F0) values of user renditions were estimated and analyzed with the original pitch values, and the first and second order differential techniques were adopted to estimate the note onset. Compared with existing methods, their process is computationally economical. Ghisingh et al. [20] studied two topics of singing voice analysis and music source separation. Through examining the production characteristics, male and female singing voices were subjected to acoustic analysis, and the source feature was attained via two methods, auto-correlation of linear prediction (LP) residual and zero-frequency filtering (ZFF), for cross-validation. Then, with the help of the self-similarity matrix technique, the authors proposed a measure of separation quality which can assist the selection of optimal windowing configurations. Zhang and Cheng [21] pointed out that the it’s inevitable that noise will be mixed into music signals during recording, so measures should be taken to reduce noise as much as possible to improve the quality of music signals. The two authors briefly introduced the noise, the masking effect, and the spectral subtraction method for reducing noise in reverberant music. Then, they improved the spectral subtraction method based on the masking effect of human ears to enhance the noise reduction performance, and carried out simulation experiments on the conventional and improved spectral subtraction methods. Their research findings suggest that the improved method can reduce the noise more effectively, and the de-reverberated music signals processed by the improved method also attained a better evaluation.
This paper aims to study a novel method for extracting the features of melody signals based on deep learning. In the second chapter, a supervised classification model is employed to select better features extracted from the raw data of melody signals and create an optimal melody feature subset; in the third chapter, this paper introduces the TCN and proposes a new algorithm for detecting feature points of melody signals, also, the detection principles will be introduced in detail; then in the fourth chapter, this paper elaborates on the melody signal feature point detection model built based on multi-branch and multi-task TCN, and gives the structures and work principles of the encoding module, decoding module, and mask estimation module of the TCN. At last, the validity of the proposed model is verified by experimental results.
The process of melody signal feature extraction is the course of attaining original signal features from the main melody of music works and selecting optimal signal features from the raw data. When classifying the data waveform of melody signals, at first, better features will be selected from the features extracted from the raw data of melody signals by feature selection algorithm, then, an optimal melody feature subset will be created, and the subsequent feature extraction and process of the deep learning model will be done based on this optimal melody feature subset.
Assuming: a represents the eigenvector of melody signals; b represents the optimal melody feature selection result; there's a certain mapping relationship between a and b. This paper attempts to figure out the internal relationship between a and b based on the supervised classification model. a and b can be regarded as known tags corresponding to the input and output data of the supervised classification model. Taking the dichotomy of melody feature subset as example, it's assumed that the deterministic function is represented by g(a), then the following formula can calculate the probabilities of a belonging to these two categories:
$g(a)=\operatorname{Pr}(b=1 \mid a)=1-\operatorname{Pr}(b=0 \mid a)$ (1)
Purpose of this supervised classification model is to build a classifier that can predict the probability that a belongs to b with the lowest misjudgment rate of classifier. Assuming: ḃa) represents the category of a predicted by the model, L0 and L1 respectively represent the prediction loss coefficients of the two categories, then there is:
$s(a)=L_1 g(a) \mid \dot{b}(a)=0+L_0(1-g(a) \mid \dot{b}(a)=1)$ (2)
The indicator function of the loss coefficients is given by the following formula:
$L(\tau)=\left\{\begin{array}{l}1, \tau \text { holds } \\ 0, \tau \text { doesn't hold }\end{array}\right.$ (3)
To ensure the lowest misjudgment rate of classifier based on the Bayesian decision, there is:
$b_Y=L\left(g(a) \geq \frac{L_0}{L_0-L_1}\right)$ (4)
The lowest misjudgment rate of classifier can be attained through the following formula:
$s_Y(a)=\min \left(L_1 g(a), L_0(1-g(a))\right)$ (5)
Because g(a) is unknown in most cases, samples can only be tagged based on given tags:
$E=\left\{a_i, b_i\right\}^N$ (6)
Through model training, g*(a|E), an approximate estimate of g(a) can be obtained, then, based on g*(a|E), the category of a can be judged further:
$\dot{b}(a \mid E)=I\left(g^*(a \mid E) \geq \frac{L_0}{L_0+L_1}\right)$ (7)
To solve the problem of existing melody feature extraction methods of over-relying on empirical parameters and artificial feature extraction, this paper chooses to use the deep learning model to overcome the shortcomings of being susceptible to interference caused by signal waveform diversity and insufficient ability to express melody features, then it introduces the TCN to propose a new algorithm for detecting feature points of melody signals. The following paragraphs introduce the principles for detecting features of melody signals.
Under normal circumstances, melody features are composed of four types of features: length, speed, pause, and tune of music rhythm. Assuming: cME(e)∈R1×E represents the tune feature of music rhythm, cLE(e)∈R1×E represents the length feature of music rhythm, cSP(t)∈R1×E represents the speed feature of music rhythm, and cPA(t)∈R1×E represents the pause feature of music rhythm, E represents the number of sampling points of melody signals, then there is:
$a(e)=c_{M E}(e)+c_{L E}(e)+c_{S P}(e)+c_{P A}(e)$ (8)
Assuming: i represents the number of training samples, for the given training data CT={ai,cLEi,cSPi,cPAi}, the model learning mapping is gρ:a(e)→(cLEi, cSPi,cPAi).
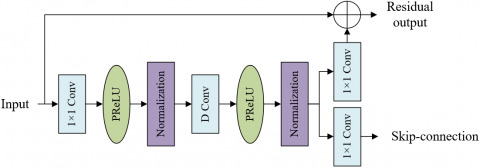
Figure 1. Network structure of the feature point detection model
This paper built the melody signal feature point detection model based on multi-branch and multi-task TCN, between each variable in the model, there are certain correlations and the structure conforms to conditional probability distribution. Figure 1 shows the network structure of the constructed detection model. To better understand the relationships between variables, this paper built a probability graph model based on encoding and decoding structure. Assuming: a represents the observed music signal, ũLE represents the position sequence of the length feature of music rhythm predicted by the model, ũSP represents the position sequence of the speed feature of music rhythm, ũPA represents the position sequence of the pause feature of music rhythm, {cL, cH} represents the encoding feature variables containing low-frequency and high-frequency signal components, {GL, GH} represents the mask feature variables containing low-frequency and high-frequency signal components, {ċL, ċH} represents the weighted feature variables, {V, F} represents the fusion features, {ũSP, ũLE, ũPA} represents the model prediction results, then the following formula gives the decomposition of conditional probability distribution:
$G U\left(\tilde{u}_{Q R S}, \tilde{u}_P, \tilde{u}_T \mid a\right)=\int_a G U\left(\tilde{u}_{L E} \mid F, \tilde{u}_{S P}, u_{P A}\right)$
$G U\left(\tilde{u}_{P A} \mid F, \tilde{u}_{S P}\right) G U\left(\tilde{u}_{S P} \mid F\right) G U\left(F \mid \dot{c}_L, \dot{c}_H, a\right)$
$G U\left(\dot{c}_H \mid G_H, V\right) G U\left(G_H, V\right) G U\left(V \mid c_H, \dot{c}_L\right)$
$G U\left(\dot{c}_L \mid G_L, c_L\right) G U\left(G_L \mid c_L\right) G U\left(c_H \mid a\right) G U\left(c_L \mid a\right) d a$ (9)
Probabilities GU(cH|A) and GU(cL|A) are instantiated to create a one-dimensional convolution encoder. A piece of music signal to be processed is cut into L fragments and the length of each fragment is K, which can written as A∈RL×K; A represents the input of encoder; YL, YH ∈RK×M respectively represent the encoding basis matrices of the low frequency band and high frequency band, then the calculation formulas of cL, cH∈RL×M are:
$\left\{\begin{array}{l}C_L=A Y_L \\ C_H=A Y_H\end{array}\right.$ (10)
The probability GU(GL|cL) is instantiated to create the mask estimation module of the TCN. By inputting cL into this module, the mask features of the low frequency band are attained as GL∈RL×M. After cL is weighted, the eigenmatrix $\dot{c}_L \in R^{L \times M}$ can be attained, ⊗ represents element-wise multiplication, then the definition of ċL is given by the following formula:
$\dot{c}_L=G_L \otimes c_L$ (11)
After the splicing operation, the attained fusion eigenmatrix can be represented by H=[ċL, ċH]∈RL×2M, the potential feature of high frequency band attained by the one-dimensional convolution neural network can be represented by V∈RL×M, probability GU(HH|V) is instantiated to be a mask estimator of the TCN. The estimator processes input V to obtain the mask feature of high frequency band, which can be represented by GH∈RL×M, after V is weighted, the attained eigenmatrix ċH∈RL×M can be defined as follows:
$\dot{c}_H=G_H \otimes V$ (12)
ċL, ċH, and A are subjected to feature fusion, after splicing operation, the fusion eigenmatrix F=[ċL, ċH,A ]∈RL×3M can be attained; after one-dimensional convolution operation, the fused eigenmatrix V∈RL×M can be attained; probability GU(ũSP|F) is instantiated to create a linear decoder. Assuming: CSP∈RL×K represents the decoding basis matrix containing the speed feature position sequence of music rhythm, based on this linear decoder, the position sequence ũSP∈RL×K can be reconstructed, that is:
$\tilde{u}_{S P}=F_{S P} C_{S P}$ (13)
After F and ũSP are spliced, the fusion eigenmatrix E=[F, ũSP]∈RL×4M can be attained, after one-dimensional convolution, the fused eigenmatrix FPA∈RL×M can be attained; probability GU(ũPA|F, ũSP) is instantiated to create a linear decoder. Assuming: CE∈RM×K represents the decoding basis matrix of the pause feature of music rhythm, then position sequence ũPA∈RS×K can be reconstructed based on this linear decoder, that is:
$\tilde{u}_{P A}=F_{P A} C_{P A}$ (14)
After F and ũPA are spliced, the fusion eigenmatrix S=[F,ũSP,ũPA]∈RL×5M can be attained, after one-dimensional convolution, the fused eigenmatrix FLE∈RL×M can be attained; GU(ũLE|F, ũSP, uPA) is instantiated to create a one-dimensional deconvolution module. Through the decoder, the position sequence of the pause feature of music rhythm can be reconstructed, assuming CLE∈RM×K represents the decoding basis matrix of the pause feature of music rhythm, the following formula gives the specific calculation method:
$\tilde{u}_{L E}=F_{L E} C_{L E}$ (15)
Chapter 2 has explained that the detection model established based on multi-branch and multi-task TCN is composed of three parts: Encoding module, decoding module, and mask estimation module of the TCN, wherein the encoding module is used to extract the important signal components of music melody. At first, this module cuts the original signal of melody A into several signal fragments with equal length K, assuming l=1,2,..., E represents the index of the fragments, E represents the total number of signal fragments, Al∈Rk×K represents the fragments, Fcoder∈RE×M represents the encoding feature of melody signals, C∈RK×M represents the matrix constituted by all convolution kernels in the one-dimensional convolution encoder, Figure 2 shows the structure of the one-dimensional convolution residual block, C can be attained through the one-dimensional convolution processing in the encoding module, and the specific processing procedure is given by the following formula:
$F_{\text {coder }}=A C$ (16)
Figure 2. Structure of the one-dimensional convolution residual block
To effectively distinguish the feature components from the non-feature components of melody signals, this paper set a TCN mask estimation module for screening suitable encoding basis functions, so as to detect the feature points of different-type melody signals. Figure 3 gives the structure of the mask estimation module of TCN. TCN can well capture the long time span information of melody signals, accurately locate the feature points of melody signals, thereby activating the attention on the encoding features. Assuming: ⊗ represents the dot multiply operation, Y represents the mask feature, then the post-mask encoding feature FATT output by the module is:
$F_{A T T}=Y \otimes F_{\text {coker }}$ (17)
Figure 3. Structure of the mask estimation module of TCN
To solve the problem of internal covariate shift, this paper set a layer standardization module, assuming Fcoder∈RE×M represents the encoding eigenmatrix; α,χ∈R1×E are parameters that can be learned; ρ represents a constant, then the following formula gives the definition of the module:
$\operatorname{LSM}\left(F_{\text {coder }}\right)=\frac{C-T\left[F_{\text {coder }}\right]}{\sqrt{\operatorname{Var}\left[F_{\text {coder }}\right]+\rho}} \otimes \alpha+\chi$ (18)
$T\left[F_{\text {cockr }}\right]=\frac{1}{E M} \sum_{E M} F_{\text {coder }}$ (19)
$\operatorname{Var}\left[F_{\text {cockr }}\right]=\frac{1}{E M} \sum_{E M}\left(F_{\text {coder }}-T\left(F_{\text {cookr }}\right)\right)^2$ (20)
In order to introduce nonlinearity into the model to improve its expression ability, the PReLU function is adopted as the activation function of the model, β∈R represents the parameters that can be learned, then the definition of the function is:
$\operatorname{PRelu}(a)=\left\{\begin{array}{l}a, \text { if } a \geq 0 \\ \beta a, \text { otherwise }\end{array}\right.$ (21)
Main function of the decoding module consisted by the one-dimensional deconvolution layer is to separate the feature waveform components of melody signals from the non-feature components, and decode the extracted melody signal features. Assuming: F'coder∈RE×K represents the encoding eigenmatrix, D∈RM×K represents the decoding basis eigenmatrix, then the decoding process is given by the following formula:
$F_{\text {coder }}^{\prime}=F_{A T T} \otimes D$ (22)
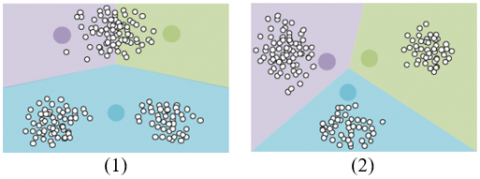
Figure 4 gives the process of creating the melody feature subset. Figure 4(1) shows the state of samples before processed by the supervised classification model, and Figure 4(2) shows the state of samples after processed by the supervised classification model. By adopting the supervised classification model, the optimal selection of features extracted from the original melody signals could be completed basically, and the hierarchical relationship between different-type melody features can be found while reducing the classification errors of melody features, and this has laid a basis for further feature extraction of the deep learning model.
Figure 4. Process of creating the melody feature subset
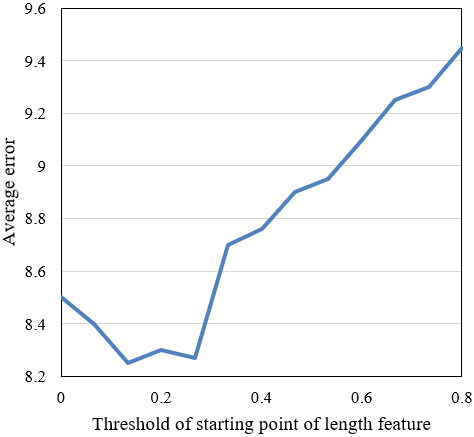
Figure 5. Extraction errors of length feature points
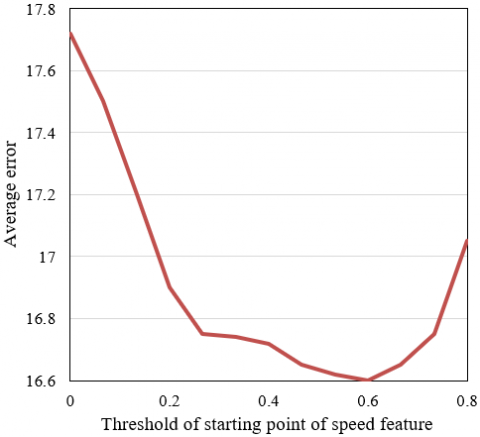
Figure 6. Extraction errors of speed feature points
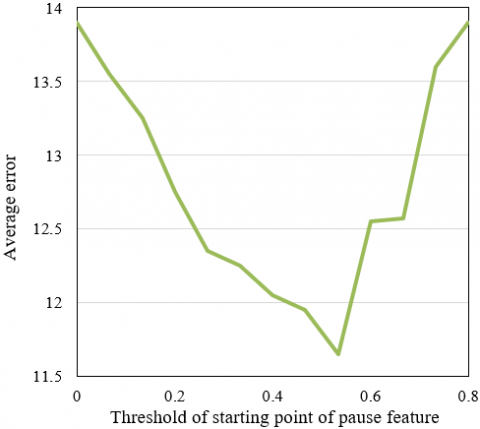
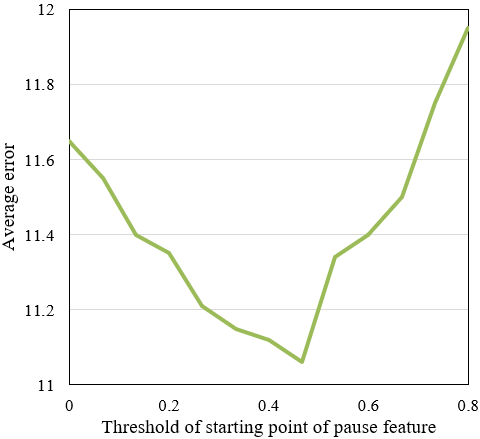
In the melody signal feature point detection experiment, a series of hyper-parameters were set to convert the probability sequence output by the network model into a position sequence of melody signal feature points, so as to judge whether the feature prediction sequence contains the corresponding features or not. The set parameters are: thresholds of the starting point and end point of the length feature of music rhythm, thresholds of the starting point and end point of the speed feature of music rhythm, thresholds of the starting point and end point of the pause feature of music rhythm, threshold of the peak of the tune feature, all initial values were set to 0.5. Since there are certain deviations in the limits of length, speed, pause, and tune features of music rhythm judged by the model, this paper calculated the error between the predicted point and the real point to determine the thresholds of the starting point and end point of the four types of features, which were used to judge the prediction results of melody signal feature points. Figures 5, 6, and 7 respectively give the errors in the extraction of the length, speed, pause, and tune features of music rhythm. The feature point thresholds corresponding to the minimum errors were selected to judge the positions of feature points.
Figure 7. Extraction errors of pause feature points
Table 1. Comparative experiment on the encoding module under different numbers of convolution kernels
|
Number of convolution kernels in the encoding module |
32 |
64 |
128 |
|
MEpeak |
-2.4±12.5 |
-0.8±13.5 |
1.3±14.8 |
|
LEon |
-1.3±19.6 |
0.4±18.7 |
-0.8±16.4 |
|
LEend |
-1.5±19.7 |
0.7±20.3 |
1.6±17.5 |
|
SPon |
2.4±13.7 |
-0.4±16.5 |
0.5±18.6 |
|
SPend |
-2.4±15.7 |
0.8±20.5 |
-1.4±28.8 |
|
PApeak |
3.4±22.2 |
1.7±25.6 |
1.6±27.4 |
|
PAend |
2.2±19.2 |
0.5±18.3 |
-0.8±19.4 |
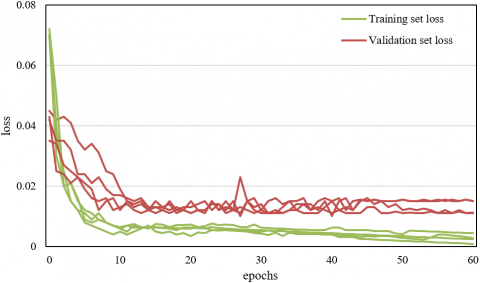
The detection model proposed in this paper is an encoder network structure, the detection performance is greatly affected by the setting of encoder parameters. In order to determine the proper encoding module parameters, multiple groups of comparative experiments had been carried out. Table 1 shows the results of the comparative experiments on the encoding module under the conditions of different numbers of convolution kernels. According to the table, when the number of convolution kernels is 64, the feature point detection performance of the model is the best, and the average error and standard deviation are the smallest. To verify the validity of the proposed model, this paper carried out comparative experiments to perform five-fold cross-validation on the proposed model and the existing K-Net and U-Net models. Figure 8 gives the loss curves of 5 times of model training.
Figure 8. Curve of model training loss
Table 2. Comparison of feature point detection performance of different models
|
Method |
Indicator |
MEpeak |
LEon |
LEend |
SPon |
SPend |
PApeak |
PAend |
|
The proposed model |
Se |
99.56 |
99.76 |
99.85 |
99.94 |
99.95 |
99.56 |
99.72 |
|
PPV |
99.82 |
99.34 |
99.54 |
98.31 |
98.76 |
99.23 |
99.25 |
|
|
M±SD |
-0.8±13.5 |
0.4±18.7 |
0.8±20.1 |
-0.2±16.5 |
0.6±20.4 |
1.7±25.2 |
0.3±18.2 |
|
|
K-Net |
Se |
98.94 |
97.85 |
99.06 |
98.32 |
97.65 |
97.23 |
96.54 |
|
PPV |
98.45 |
98.81 |
99.03 |
98.12 |
98.54 |
95.76 |
95.27 |
|
|
M±SD |
-2.2±14.5 |
2.5±19.8 |
1.4±22.3 |
-1.2±12.7 |
-1.7±17.5 |
4.3±32.8 |
3.6±29.7 |
|
|
U-Net |
Se |
92.25 |
91.53 |
94.63 |
98.62 |
98.34 |
94.25 |
95.96 |
|
PPV |
93.02 |
92.05 |
93.75 |
97.85 |
98.03 |
90.27 |
91.62 |
|
|
M±SD |
4.4±16.2 |
6.7±12.5 |
-4.5±17.6 |
4.1±24.3 |
6.5±22.1 |
5.7±38.7 |
-6.5±40.3 |
Table 3. Comparison of performance of different models
|
Method |
Overall results |
F1-score |
|||||
|
ACC(%) |
F1-score |
Wake |
N1 |
N2 |
N3 |
REM |
|
|
SVM |
76.23 |
0.632 |
0.714 |
0.135 |
0.852 |
0.762 |
0.719 |
|
RF |
78.12 |
0.675 |
0.751 |
0.227 |
0.872 |
0.805 |
0.732 |
|
DS-Net |
82.15 |
0.761 |
0.852 |
0.472 |
0.865 |
0.852 |
0.822 |
|
SS-Net |
86.13 |
0.798 |
0.917 |
0.475 |
0.873 |
0.853 |
0.851 |
|
S-EEGNet |
84.38 |
0.798 |
0.893 |
0.523 |
0.862 |
0.852 |
0.823 |
|
S-Utime |
85.37 |
0.791 |
0.875 |
0.521 |
0.861 |
0.851 |
0.845 |
|
TS-Net |
82.46 |
0.802 |
0.903 |
0.516 |
0.889 |
0.889 |
0.872 |
|
Resnet |
82.37 |
0.792 |
0.851 |
0.552 |
0.875 |
0.845 |
0.856 |
|
SAS-Net |
87.49 |
0.835 |
0.932 |
0.573 |
0.891 |
0.873 |
0.915 |
|
The proposed model |
86.41 |
0.807 |
0.905 |
0.582 |
0.893 |
0.862 |
0.895 |
Table 2 shows the comparison results of the feature point detection performance of different models. According to experimental results, compared with K-Net and U-Net models, the performance of the propose model in detecting feature points is better. The main reason is that the proposed model divides the sample set during the training process, and the training criteria that the model must follow are clearer than the other two models.
To further verify the validity of the proposed model detecting the feature points of melody signals, this paper compared it with several classical feature extraction models through experiment. Table 3 compares the performance of multiple models. According to the table, compared with other models, the F1 scores of the proposed model are higher. In terms of detection accuracy, compared with SVM, the accuracy improved by 10.6%; compared with RF, the accuracy improved by 7.96%; compared with other deep learning algorithms, the improvement was between 2.78% ~ 9.66%. The performance comparison indicates that the performance of other classical feature extraction models in detecting the melody signal features is unsatisfactory, while the effect of the proposed model is quite ideal.
This paper researched a novel method for extracting music melody signal features based on deep learning. At first, with the help of a supervised classification model, better features were extracted from the raw data of melody signals, and an optimal melody feature subset was created; then, the paper introduced the TCN to propose a new algorithm for detecting melody signal feature points, and explained the detection principles in detail. After that, the detection model established based on multi-branch and multi-task TCN was introduced, and the structures and work principles of the encoding module, decoding module, and mask estimation module of the TCN were given. In the experiment, the process of creating the melody feature subset was presented, the validity of the proposed model was verified, extraction errors of length, speed, and pause features of music rhythm were given, which had realized the judgement of feature point positions. At last, comparative experiments were performed on the encoding module under different numbers of convolution kernels, the performance of different models in detecting feature points was compared, and the results prove that the performance of the proposed model is better.
[1] Li, C., Liang, Y., Li, H., Tian, L. (2021). Main melody extraction from polyphonic music based on frequency amplitude and multi-octave relation. Computers & Electrical Engineering, 90: 106985. https://doi.org/10.1016/j.compeleceng.2021.106985
[2] Wen, R., Chen, K., Xu, K., Zhang, Y., Wu, J. (2019). Music main melody extraction by an interval pattern recognition algorithm. In 2019 Chinese Control Conference (CCC), pp. 7728-7733. https://doi.org/10.23919/ChiCC.2019.8865954
[3] Chenchen, K., Yibiao, Y. (2018). Main melody extraction using the auditory scene analysis for the humming music retrieval. In 2018 14th IEEE International Conference on Signal Processing (ICSP), Beijing, China, pp. 27-31. https://doi.org/10.1109/ICSP.2018.8652297
[4] Zhang, W., Chen, Z., Yin, F. (2016). Main melody extraction from polyphonic music based on modified Euclidean algorithm. Applied Acoustics, 112: 70-78. https://doi.org/10.1016/j.apacoust.2016.04.023
[5] Zhao, H., Qin, Z. (2014). Tunerank model for main melody extraction from multi-part musical scores. In 2014 Sixth International Conference on Intelligent Human-Machine Systems and Cybernetics, Hangzhou, China, pp. 176-180. https://doi.org/10.1109/IHMSC.2014.145
[6] Tsai, W.H., Yu, H.M., Wang, H.M., Horng, J.T. (2008). Using the similarity of main melodies to identify cover versions of popular songs for music document retrieval. Journal of Information Science & Engineering, 24(6): 1669-1687.
[7] Shih, H.H., Narayanan, S.S., Kuo, C.C.J. (2001). Music indexing with extracted main melody by using modified lempel-ziv algorithm. Internet Multimedia Management Systems II, 4519: 124-135. https://doi.org/10.1117/12.434262
[8] Hossain, M.S.A., Rahman, M.A., Chakrabarty, A. (2021). Music model based neural information processing for emotion recognition from multichannel EEG signal. In 2021 8th International Conference on Signal Processing and Integrated Networks (SPIN), Noida, India, pp. 955-960. https://doi.org/10.1109/SPIN52536.2021.9565974
[9] Kim, P.W. (2021). Bio-signal-processing-based convolutional neural networks model for music program scene editing. Concurrency and Computation: Practice and Experience, 33(22): e6257. https://doi.org/10.1002/cpe.6257
[10] Müller, M., McFee, B., Kinnaird, K. (2021). Interactive learning of signal processing through music: Making fourier analysis concrete for students. IEEE Signal Processing Magazine, 38(3): 73-84. https://doi.org/10.1109/MSP.2021.3052181
[11] Chen, J., He, P., Pan, F. (2021). A preferred music recommendation method for tinnitus personalized treatment based on signal processing and random forest. In 2021 6th International Conference on Intelligent Computing and Signal Processing (ICSP), Xi'an, China, pp. 470-473. https://doi.org/10.1109/ICSP51882.2021.9408902
[12] Luan, S., Zhao, M., Gao, Y., Zhang, Z., Qiu, T. (2021). Generalized covariance for non-Gaussian signal processing and GC-MUSIC under Alpha-stable distributed noise. Digital Signal Processing, 110: 102923. https://doi.org/10.1016/j.dsp.2020.102923
[13] Merchel, S., Altinsoy, M.E. (2020). Perceptually optimized signal processing for vibro-acoustical music reproduction. Acoustical Science and Technology, 41(1): 328-330. https://doi.org/10.1250/ast.41.328
[14] Mueller, M., Pardo, B.A., Mysore, G.J., Valimaki, V. (2018). Recent advances in music signal processing [from the guest editors]. IEEE Signal Processing Magazine, 36(1): 17-19. https://doi.org/10.1109/MSP.2018.2876190
[15] McFee, B., Kim, J.W., Cartwright, M., Salamon, J., Bittner, R.M., Bello, J.P. (2018). Open-source practices for music signal processing research: Recommendations for transparent, sustainable, and reproducible audio research. IEEE Signal Processing Magazine, 36(1): 128-137. https://doi.org/10.1109/MSP.2018.2875349
[16] Bhargave, O. (2019). Intelligent error detection and advisory system for practitioners of music using audio signal processing and computing. In 2019 1st International Conference on Advanced Technologies in Intelligent Control, Environment, Computing & Communication Engineering (ICATIECE), Bangalore, India, pp. 257-260. https://doi.org/10.1109/ICATIECE45860.2019.9063618
[17] Humphrey, E.J., Reddy, S., Seetharaman, P., Kumar, A., Bittner, R.M., Demetriou, A., Yang, L. (2018). An introduction to signal processing for singing-voice analysis: High notes in the effort to automate the understanding of vocals in music. IEEE Signal Processing Magazine, 36(1): 82-94. https://doi.org/10.1109/MSP.2018.2875133
[18] Zhao, X., Tuo, Q., Guo, R., Kong, T. (2022). Research on music signal processing based on a blind source separation algorithm. Annals of Emerging Technologies in Computing, 6(4): 24-30. https://doi.org/10.33166/AETiC.2022.04.003
[19] Biswas, R., Murthy, Y.V., Koolagudi, S.G., Vishnu, S.G. (2020). Objective assessment of pitch accuracy in equal-tempered vocal music using signal processing approaches. Smart Computing Paradigms: New Progresses and Challenges, pp. 161-168. https://doi.org/10.1007/978-981-13-9683-0_17
[20] Ghisingh, S., Sharma, S., Mittal, V.K. (2017). Acoustic analysis of Indian classical music using signal processing methods. In TENCON 2017-2017 IEEE Region 10 Conference, Penang, Malaysia, pp. 1556-1561. https://doi.org/10.1109/TENCON.2017.8228104
[21] Zhang, S., Cheng, Y. (2022). Masking and noise reduction processing of music signals in reverberant music. Journal of Intelligent Systems, 31(1): 420-427. https://doi.org/10.1515/jisys-2022-0024