Ali Berkan Ural
Special Issue: The 3rd ICAENS Conference
© 2022 IIETA. This article is published by IIETA and is licensed under the CC BY 4.0 license (http://creativecommons.org/licenses/by/4.0/).
OPEN ACCESS
For years, breast cancer has been a serious problem and malignant tumor case primarily causes death of women all around the world. In this paper, a computer based breast tumor analysis and pathological case classification system has been achieved and some novelties are included to the image processing methods, especially in segmentation and base frequency distribution acquisition of the processed image and classification part. First, the possible noises and artifacts are eliminated by using common filtering. Second, the filtered images are segmented with integrating gray level Image Processing methods. Then, these images (ROIs) are converted to the base frequency distribution images with using Fast Fourier Transform (FFT) and Lab&HSV color spaces. The most important key for these images is frequency distribution can be obtained with specific color tones and totally 100 images (50 benign-50 malignant) are accumulated to fed the two different Machine Learning models in literature such as Probabilistic Neural Network as Learning Vector Quantization (LVQ) and Support Vector Regression (SVR) for classification of Benign and Malignant cases without the need for additional medical data. Then the performance of the proposed system is analyzed with 30 different test images (15 benign-15 malignant) according to the metrics like accuracy, sensitivity, specificity, precision, F-score and area under the ROC curve (AUC score). The experimental results on the open access mammogram image set show that discriminating between Benign and Malignant cases can be achieved with an important success rate as 91.38% with LVQ and %.92 with SVR.
breast cancer, benign tumor, malign tumor, image classification, feature extraction, machine learning
Breast masses are mainly mammary tumors and breast can be classified as lesions (anomalies). Tumor indicates the presence of normal tissue in an inappropriate area anywhere in the body [1]. In other words, it is the uncontrolled growth of tissues or parts in their original regions. Considering the fact that not all species are lethal in the literature, it is among the cancer group that can be considered fatal when malignancy is seen.
Tumors are subject to various classifications among themselves, and another important point in medicine is whether they are benign or malignant. Although benign tumors tend to grow at a low rate in the region where they are located, they have distinctive features that can be distinguished from other normal breast tissues specifically [2]. Benign tumors are removed by surgeons as long as they are accessible in the areas where they are located. After this procedure, the recurrence of these tumors is very unlikely. The spread of the tumor to other parts of the organism is called metastasis, but this eliminates any benign symptoms [3]. In addition, although the detected tumor is not malignant, it is possible to cause many health problems to the patient. In addition, it is highly unlikely that benign tumors tend to turn into malignant tumors over time.
Malignant tumors have the potential to grow faster than benign tumors, and they grow in the form of pressure or aggressive spread to adjacent brain tissues [4]. At the same time, it is very important to closely monitor the patient's condition after the surgical operation, in case of regrowth and/or disintegration.
For many years, large part of women around the world have been enduring from breast cancer and the death rate from this type of cancer has become an important issue. Cancer tumor generally occurs from abnormal cell development and there are two types of tumors: benign and malignant. A benign tumor is consisted from non-cancerous cells that grow only locally [5]. A malignant tumor is consisted from the cancerous cells with abnormal growth and can spread to the other cells [6]. Unlike a benign tumor, if the malignancy is detected at earlier phases, the cure will be more accurate for the patient. Early diagnosis and cure are become important to avoid awful results and reduce the death rate among women [7]. Mainly, the malignancy occurs because of the unusual development of cells and may invade the close healthy tissues.
Without the need of biopsy, there are some non-invasive techniques for detecting and diagnosing breast cancer and from these methods, mammography can provide to radiologists the best way for correct and accurate diagnosis [8]. Generally, mammograms are consisted from one the of X-ray imaging technique for analyzing earlier symptoms of breast cancer among women. In medicine, there are two types of mammography. One of them is screen mammography with a photographic film [9]. The other is digital mammography with digital images [10]. The last method can be defined the most effective technique for investigating breast cancer, but these images need more image processing methods for interpretating and this progress may be difficult for doctors. So, Computer Aided Diagnosis (CAD) has gained much more importance for analyzing the digital mammogram images [11].
In several pattern classification tasks in image processing, neural networks (NNs) have been shown to provide picture features that are more discriminative than hand-crafted attributes recently [12, 13]. In several pattern classification tasks in image processing, neural networks (NNs) have been shown to provide picture features that are more discriminative than hand-crafted attributes recently [14]. The extraction of hand-crafted image features from a given lesion for the CAD task of lesion diagnosis typically requires knowledge of the locations of the individual lesions/masses, which is a difficult task that is either time consuming when marked manually or subject to false positives (or missed detections) when detected by a computerized algorithm.
Scholars have expressed worry over NN-based feature extraction algorithms for the categorization of histopathological breast images [15-17]. For the BreaKHis dataset, for example, authors used ResNet50 model as an attribute extractor model based on CNN architecture. They next used linear SVR to analyze the retrieved features and reported results for roughly 88 percent of them. As feature extractor methods, the researchers [16] presented integrated AlexNet and VGG16 models. The BreaKHis dataset was classified using these hybrid approaches, and the maximum accuracy recorded was 90.96 percent, whereas the VGG16 model achieved 90.96 percent. In this dataset, AlexNet was found to be superior to VGG16 in terms of feature extraction. Furthermore, as the number of training samples grows, so does the performance. For the BreaKHis pictures, the majority of the research used various pre-trained models with a preprocess.
The goal of this study was to see how well computer vision and machine learning algorithms could predict the region of interest (ROI) on mammograms for breast masses. However, this study developed two machine learning based neural networks that excel in classifying the ROI of breast tumors, allowing doctors to detect even the smallest breast masses early. Each image in the dataset is preprocessed to remove noise and improve image quality by employing various enhancement techniques. Following that, the ROI of the benign and malignant classes is split using gray level image segmentation, and these regions are clipped based on the precise coordinates of each cancerous location. Then, these patches/images are converted to the Lab&HSV color sets and with using FFT, frequency distribution of the benign and malignant images are obtained. The novelty of this study is detecting the lesion type (benign or malignant) non-invasively with using FFT and color spaces based frequency distribution images and these images are fed into the Machine Learning (ML) models for classification. Our approach efficiently extracts color-level frequency features and these images are fed to the Machine Learning models (Learning Vector Quantization (LVQ) and Support Vector Regression (SVR)). These models are rarely used for mass detection in mammogram images in literature and also improved version of these models are used in the breast tumor detection and pathological classification in the evaluation part. Moreover, using cropped image patches, we effectively extract low-level features, minimize variability and generalization inaccuracy, and enhance lesion categorization. This study changes uneven data, reducing processing time and false- (positive and negative) predictions greatly. A data augmentation approach is also required to decrease the dataset's imbalance.
In literature, the studies about breast mass/lesion detection with using specific ML methods were less and limited and there were not any adequate sources about these studies. Separated from this work, there have been no works that contained progressed image processing and machine learning strategies. In the Results and Discussion part, comparisons and analysis related to the performance metrics were clearly achieved between Benign and Malignant breast masses.
2.1 Data collection
This study was generally defined as a retrospective study and achieved with the participation of 50 benign and 50 malignant cases images. These mammogram datasets were collected from Yildirim Beyazit University/Ataturk Training and Research Hospital/Department of Radiology. The dataset was obtained from years between 2016-2020 in detail. The necessary ethical permission was taken by Dr. Ali Berkan URAL from the ethical committee. Approval was granted by the Ethics Committee of Yildirim Beyazit University in 2020 May. Indeed, because this study can be called as a retrospective study, informed consent and any other specific documents etc. are not generally needed. Moreover, after analysis, all database and results were investigated again according to the compliance from doctors-clinicians for obtaining and improving the benefits of the study.
Totally, 100 patients who were examined with a digital mammography scanner via X-light theory were collected retrospectively from the hospital database.
According to the image acquisition for 100 patients, 50 benign and 50 malignant breast tumors could be detected clearly and for the classification phase totally 100 images were used for training phase and were fed into the machine learning methods and also, 30 extra images (15 benign-15 malignant) were differently chosen and used for testing. Moreover, 100 different mammogram images (50 benign and 50 malignant cases randomly chosen) from an open access image database (MIAS) were randomly chosen and used for testing the whole system in detail.
2.2 The proposed system
Figure 1. Flowchart of the approach
According to the proposed system, the main point is to create an integrated breast mass/lesion detection and classification algorithm to determine and interpretate the Benign or Malignant case of the tumors. Indeed, with using Image segmentation methods such as K means integrated Fuzzy C Means (KM&FCM) and Global Thresholding&Otsu’s hybrid methods, detecting the problems with higher accuracy is the other objective. Also, with using the FFT and Lab&HSV color based processed mammogram image patches, interpretation of the tumor cases can be achieved successfully and this is the other novel objective. Finally, automatic breast tumor classification and evaluation are achieved with using Probabilistic Neural Network (LVQ) and SVR Machine Learning methods. A flowchart of the system is shown in Figure 1. Each step is described below in detail.
2.2.1 Image acquisition
Generally, training and test mammogram images taken from subjects and obtained from open access database are mainly gray-level. Indeed, the image size for the mammograms is randomly chosen (255x255 um and uint8 class type).
2.2.2 Tumor extraction stage (Image Segmentation)
This is the first step of Image Processing part; clustering process was completed via KM&FCM method. Basically, K-means could be a clustering strategy of the vector quantization that’s so slant for examination in data mining. This strategy by and large points to isolate n perceptions into k clusters that each perception related to the cluster with the closest mean value. In Fuzzy Clustering strategy, each point in an image contains a mean value which is related to the clusters. The FCM calculation basically accomplishes to partition to parcel a limited collection of components into fuzzy clusters. The calculation is for the most part based on a few emphases with the work given in Eq. (1);
$K_m=\sum_{a=1}^N \sum_{b=1}^c u_{a b}^m\left(\left|x_a-x_b\right|\left|x_a-x_b\right|\right)$ (1)
In Eq. (1), m can be called as the fuzziness component and this value has to be higher than 1. Indeed, N is the whole data number, C is the cluster number, $u_{a b}^m$ can be called the ratio of membership of xa in the cluster b.
Agreeing to the data given over, K Means was integrated with Fuzzy C Means in detail and the obtained multi-method had some pros. Firstly, the hybrid method could give successful results for overlapped data and when we compare these methods, the hybrid method is better than each of the methods.
According to the clustering, the cluster center was determined according to Eq. (2);
Clus.Cen.$=\frac{(1 / l) x n}{l+1}$ (2)
According to Eq. (2), l is the introductory cluster number and n is the maximum iteration value. After evaluation, these values were obtained as 3 and 5, respectively.
For this step, maximum distance related to the image was calculated according to some neighborhood rules. When these rules were done, some points could be located outside the cluster center. So, the purpose of the novel KM&FCM was completed. The outcome was the RGB based image. In fact, in this ponder, a well-defined image processing strategy is obtained and utilized to distinguish the breast tumor zone non-invasively.
This segmentation part the second main process of this part. For this stage, a hybrid version combining Gray level, Global, Otsu, and Multiple thresholding methods was obtained and applied on the images. Contrast is the darkest in the image. It can be defined as the difference between the brightest and the brightest area. Customarily, a fundamental way to perform thresholding method is to characterize a run of luminance values within the unique image, at that point select the pixels inside the run as frontal area and dismiss all other pixels to the background [18, 19].
Indeed, improved multichannel thresholding can be expressed in Eq. (3);
For the first channel;
$\mathrm{F}(\mathrm{x}, \mathrm{y})$; if $0 \leq \operatorname{im} 1(x, y) \leq T 1$
$\mathrm{G}(\mathrm{x}, \mathrm{y}) ;$ if c $1 \geq T 1$ (3)
For the second channel;
$\mathrm{F}(\mathrm{x}, \mathrm{y}) ;$ if $\mathrm{T} 2 \leq \operatorname{im} 2(x, y) \leq 255$
$\mathrm{G}(\mathrm{x}, \mathrm{y})=0 ;$ if $\mathrm{c} 2<T 2$
For this study, the optimal threshold value was obtained as 0.81 after multiple trials. At the end of the process, the segmented image was shown in black and white version. The algorithm effectiveness is based on the Mahalanobis distance calculation and the image becomes less sensitive to the noise based elements [20]. So, a well-organized and improved segmentation method was obtained from two different fundamental techniques. Then, base frequency was calculated and obtained with the colored FFT image version.
2.2.3 Base frequency distribution acquisition part from processed mammogram images
Fast Fourier Transform (FT) can be explained as an important image processing tool for dividing the image into sine and cosine components [21]. The output is generally given in Frequency domain and frequency components are clearly seen while the input image is in the spatial domain. In the frequency domain, each of the points has different frequency values in detail. For this study main Fourier function is improved optimally and given in Eq. (4);
$F(a, b)=\sum_{i=0}^{M-1} \sum_{j=0}^{M-1} f(i, j) e^{-t 2 \pi\left(\frac{a j}{M}+\frac{b j}{M}\right)}$ (4)
where, f(a,b) is the real image and this image is generally in the spatial domain. F is the basis function for Fourier transform and with this formula, the image can be divided into sine and cosine parts and then, these parts were performed to convert gray level to Lab and HSV color spaces in detail.
This part has some novelties for the study. First of all, unseen parts/objects could be seen more clearly from the color converted images according to the hot and cold color tones. Indeed, the main aim is improving the detection accuracy and specificity with using more marked RGB colored images via machine learning methods. FFT was performed on the segmented images/patches and with obtaining these images, these were generally in black and white color tones. This color tone was changed to the Lab color space first. When this progress was performed, the image could be seen in cold color tones. Indeed, the color space was converted again to HSV space according to the hue, saturation and value parameters. Moreover, it was clearly obtained that, benign tumor images had colder color tone values such as blue tones, and malignant tumor images had hotter color tone values such as red, orange etc. At the end of the progress, the obtained image has marked cold and hot colors according to the frequency distribution and with using these RGB images, they were fed into the machine learning algorithms for tumor case classification.
2.2.4 Machine learning application
LVQ is mainly a multi-oriented supervised classification method. This method generally uses the special case of the neural network structure for this study and winning-based Hebbian learning-based approach can be achieved via this method [22]. Fundamentally, the image has some parameters/features that are defined in the prototypes. The main purpose is to detect the respective application domain and LVQ is the optimal technique for measuring the distance for training and classification processes.
In this study, an improved version of probabilistic neural network was mainly chosen and used. To analyze the information details of pixels, specific Region of Interests (ROIs) were used around the segmented and colored tumor area in processed mammogram images. Firstly, for each ROI, the minimum distance was calculated from the most significant areas of tumor area with boundaries. Then, normalizing progress was achieved according to the intensity characteristic and probabilistic density function was obtained. Concurring to the progressed LVQ strategy, clusters were prepared with more up to date weight values and choice boundaries were evaluated clearly.
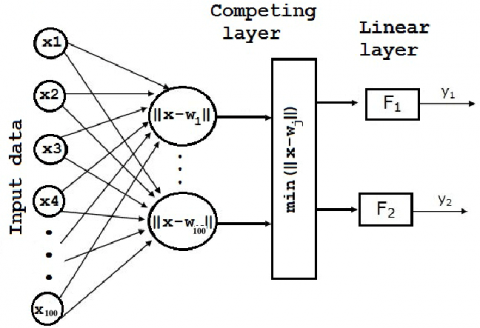
LVQ is a specific neural network that consisted from neurons with competitive learning with supervision [23]. The competitive layer of LVQ can be explained as a linear layer. After assigning of each neuron in the first layer, each class was assigned to the same class in the second layer. The main structure of improved LVQ can be given in Figure 2.
Figure 2. Unique development of LVQ architecture
Concurring to Figure 2, when the winning neuron is found with the covered up layer, its weight vector was relegated to the current input vector. In the event that a misclassification happens, the weight values are re-imagined once more aggreging to the input vector. As given over, the improved LVQ model is comprised from three diverse parts: these are input, competitive and linear layers. Firstly, for this work, input information was allotted to the input and classification was performed within the competitive layer. In the learning stage, the weights were calculated concurring to the input and after that the champ neuron was defined/calculated with the Mahalanobis distance estimation procedure. Basically, Euclidean distance method has not been chosen since this has chosen within the existing constrained studies.
Support Vector Regression (SVR) can be called the first regression method, but the biggest difference is the method is non-linear. This method is used for this study to analyze and detect the relationship between input and classes. The main aim is to find a linear regression function in a feature space that consist from high dimensions [24, 25]. Then, input is re-mapped to the space via this non-linear function. For this application, totally 3 SVRs were performed for training, these are generally non-linear basis function.
For this application, from totally 100 obtained images from participants, 50 benign and 50 malignant images were used for training and extra different 30 images (15 benign-15 malignant) were chosen and used in the testing phase for LVQ and SVR methods.
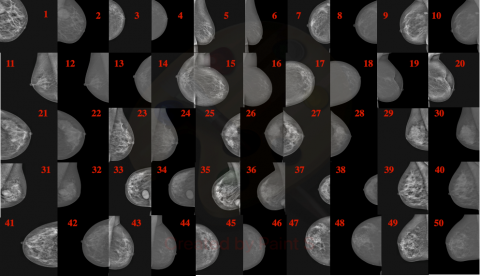
The primary arrange of the framework was characterizing input information with breast mammogram images. The images were stacked to the framework and these were clearly appeared in Figure 3a and 3b with image representation organization. In expansion, the images were numerized for simple comparisons and analysis.
Figure 3a. Input images for Benign breast tumors
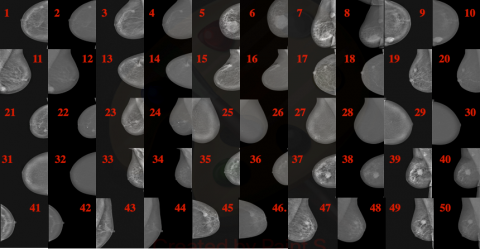
Figure 3b. Input images for Malignant breast tumors
The other stage was image segmentation. With using image segmentation methods, unused area(s)/object(s) were eliminated from the raw images and important details were preserved. Segmentation results were given in Figure 4a and 4b.
Figure 4a. Segmentation results for benign breast tumors
Figure 4b. Segmentation results for malignant breast tumors
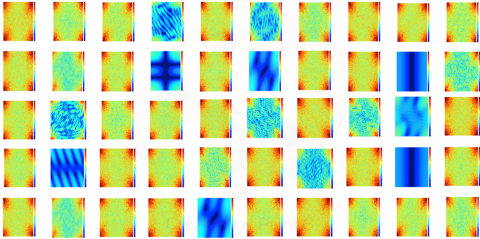
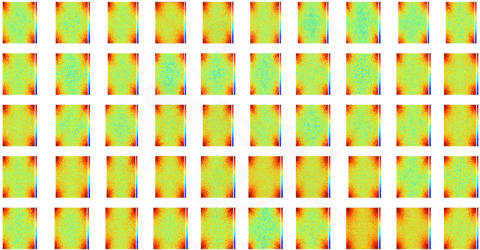
Figure 5a. Results for performing FFT and converting color spaces for benign breast tumors
Figure 5b. Results for performing FFT and converting color spaces for malignant breast tumors
When segmentation results which were given above were investigated, images were segmented with the methods and because of KM&FCM the images were obtained in the colored version. Some results of KM&FCM were better and more accurate results were obtained such as images 5, 7, 11, 33, 37, 39, 43, 47, 49 could be called as better results. Moreover, after this, thresholding was mainly achieved and for some cases, some color degrees could be decreased. Finally, all images were obtained in black and white segmented version and they were ready for the next stage.
The next stage was performing FFT and converting color spaces and when the images were in RGB format, they were first converting to Lab color space, then second convert again to HSV color space. The obtained results were given in Figure 5a and 5b. According to the frequency distribution images, it could be said that red and similar color tones had higher frequencies and the other tones had lower frequencies. Indeed, the higher frequencies were balanced with the tumor or lesion area(s) according to the doctor/physician investigation.
According to the analysis for totally 100 images, during the segmentation and FFT and converting color space progresses, the accuracy value was 100% and these processes were achieved in approximately 2.1 sec. Finally, after FFT and color changing, the main images of the machine learning were become ready to feed into ML methods.
When the frequency images were analyzed, with using pixel similarity method, some missing color could be seen and they were rearranged according to the color calibration technique. For example, when we examined the images; images 1, 11, 36, 38, 47 had the brightest and hottest colors for benign breast tumors and more than half of the images had the brightest and hottest colors for malignant breast tumors and images 4, 6, 14, 16, 19, 31, 39, 45 had the darkest and coldest colors for benign breast tumors. The process was achieved successfully and at the end of the process, the accuracy was calculated as 100% and the process took 2.5 sec.
The other stage was feeding frequency images to ML methods. Moreover, the main aim of the previous part was to make the image independent from the whole image and other effects. After the images were fed into LVQ and SVR methods, the rate of performance metrics was calculated as 91.38% for LVQ and 92% for SVR. In this step, with using FFT and colormap transformation/changing, the information was remapped to every pixel with color distribution and they were transferred to the R, G, B, L, a, b color channels and then LVQ and SVR were applied on the color channels.
Totally, for 6 channels and 100 training and 25 random test images, dataset value was calculated as 256*256*6=393.216. But for each image, after segmentation, when black zones were defined as redundant, the new dataset value for FFT and color transformation was obtained as approximately 300.000. Also, with using a non-linear color gradient, possible color differences were calculated and finally, obtained feature value was calculated as 269.000 after FFT and color transformation images. Finally, this value was processed with LVQ and SVR. For this step, maximum and minimum values were firstly found and used. The dispersion illustration was plotted particularly with utilizing LVQ and SVR calculations and when a decision boundary was made, classification estimation comes about were compared the test comes about non-invasively. When the illustrations were analyzed given in Figure 6a and 6b, estimation comes about were merged to the decision boundary level were considered true values. Agreeing to the comes about, when direct relationship was 0.80, for 50 benign and 50 malignant cases, the compliance rate was gotten as 91.38% for LVQ and 92% for SVR. With utilizing SVR calculation, more precise comes about were gotten clearly.
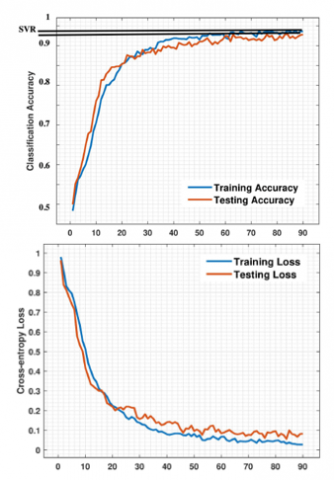
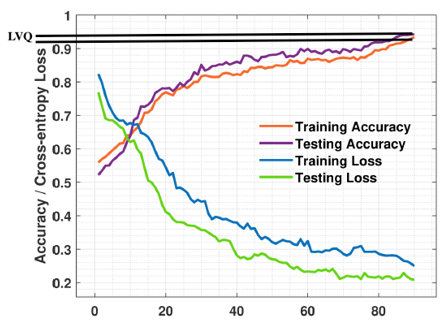
Figure 6a. ROC analysis results via LVQ method
Figure 6b. ROC analysis results via SVR method
3.1 Statistical analysis
Table 1. Performance outcomes
|
Algorithms |
Precision |
Sensitivity |
F-score |
Accuracy |
Area under of curve (AUC) |
|
LVQ |
0.9138 |
0.9038 |
0.89 |
0.9138 |
0.89 |
|
SVR |
0.92 |
0.91 |
0.90 |
0.92 |
0.88 |
Performance metrics from the system were adapted to F-statistical test. According to the results, when the significance case was p>0.065, a correlation was found between the benign/malignant test results of the system with LVQ and SVR methods and the benign/malignant test results obtained from MIAS with LVQ and SVR methods. The compliance rate between these metric values was obtained as 0.9138 for LVQ and 0.92 for SVR, respectively. Obtained results were given in Table 1 in detail.
Indeed, to determine the accuracy rate according to the two different test imageset, the other step ROC (Receiver Operating Characteristics) was achieved successfully. When preparing the ROC curve, the test images of the MIAS test breast tumor image data were based on to use. During the process, according to the thresholding value given in the ROC curve graphs, if obtained performance value was greater than the threshold value, a higher True Positive Rate (TPR) value and False Positive Rate (FPR) value could be obtained. The threshold value was related to the system’s performance from MIAS test imageset and when the value increased, a fluctuation occurred in performance metric values. ROC curve graphs were given above in Figure 6a and 6b in detail.
F $=$ Sensitivity $+$ Specificity $-1=$ TPR $-$ FPR (5)
According to Eq. (5), the first y point was a higher TPR value and a lower FPR value. When sensitivity values are analyzed for LVQ and SVR methods, important success rates were obtained clearly and the experimental results were supported with the ROC curve results.
The ultimate step was making comparisons and execution examination between our special breast tumor detection and benign/malignant classification framework and diverse strategies approximately breast tumor location. Comparison comes about were given in Table 2, separately.
Table 2. Results of different works and breast tumor classification system for benign and malignant cases
|
Work |
Method |
Application |
Result-Linear correlation |
|
Wang et al. [26] |
Deep Learning |
Breast cancer classification with microcalcification |
87.3% |
|
Wang et al. [27] |
Deep Learning |
Breast lesion classification |
86% |
|
Saber et al. [28] |
Deep Learning |
Breast cancer classification |
88.96% |
|
Albashish et al. [29] |
Deep Learning |
Breast cancer classification |
85.1% |
|
Our proposed system |
Machine Learning |
Breast cancer classification for benign and malignant images |
91.38% for LVQ 92% for SVR |
All of the studies are related to the deep learning models for breast cancer classification, but our study has unique important Machine Learning methods such as LVQ and SVR. Firstly, Jinhua et al. used deep learning models for breast cancer classification with microcalcification situation and they obtained as 87.3%. Then, Mahmood et al. used deep learning models for breast lesion classification and they used similar common methods and obtained 96%. Then, Saber et al. [28] obtained 98.96% with deep learning for breast cancer classification. Albashish et al. [29] used Deep CNN model with VGG16 for breast cancer classification. They used this method and obtained %95.1 accuracy ratio. Our system has unique and advanced methods and techniques and also, according to the results, breast tumor classification for benign and malignant images was achieved optimally with a high performance.
In this study, the purpose was creating a non-invasive system to detect the breast tumor and interpretate the tumor case such as benign and malignant and helping doctors for early and optimal diagnosis. Generally, when totally 100 breast images (50 benign and 50 malignant) were based on to use, for 30 test images (15 benign and 15 malignant random images) from MIAS were obtained from the flowchart were compared to the detailed breast tumor detection and analysis system. Because of the accuracy and sensitivity, this system was used commonly to detect breast tumors as benign or malignant cases. This system could give accessibility and short processing time for detection. When the results were analyzed, the system was achieved optimally in a short time and the success rate of the system was calculated as 91.38% for LVQ and 92% for SVR methods. Moreover, this values’ accuracies were supported with the F-statistical test and ROC curve and analysis. At that point our one of a kind framework was compared with the constrained Deep Learning based thinks about and at last, it was watched that our framework had a special and novel computer program, high quality and brief handling time. In the event that this think about is created and adjusted for diverse infections, for analyzing and diagnosing stages, ideal and way better comes about can be gotten from the entire framework. In this way, the significance of this inquire about work is that ready to classify tumors more precisely in less time. It may increment mindfulness of individuals toward breast cancer and diminish fears of tumors.
|
CAD |
Computer Aided Diagnosis |
|
FFT |
Fast Fourier Transform |
|
LVQ |
Learning Vector Quantization |
|
ML |
Machine Learning |
|
ROC |
Receiver Operating Characteristics |
|
ROI |
Region of Interest |
|
SVR |
Support Vector Regression |
[1] Harbeck, N., Penault-Llorca, F., Cortes, J., Gnant, M., Houssami, N., Poortmans, P., Tsang, J.F. (2019). Cardoso. Breast cancer. Nature Reviews Disease Primers, 5: 66. https://doi.org/10.1038/s41572-019-0111-2
[2] Waks, A.G., Winer, E.P. (2019). Breast cancer treatment: a review. Jama, 321(3): 288-300. https://doi.org/10.1001/jama.2018.19323
[3] Dai, X., Cheng, H., Bai, Z., Li, J. (2017). Breast cancer cell line classification and its relevance with breast tumor subtyping. Journal of Cancer, 8(16): 3131. https://doi.org/10.7150/jca.18457
[4] Skibinski, A., Kuperwasser, C. (2015). The origin of breast tumor heterogeneity. Oncogene, 34: 5309-5316. https://doi.org/10.1038/onc.2014.475
[5] Woodhams, R., Matsunaga, K., Iwabuchi, K., Kan, S., Hata, H., Kuranami, M., Watanabe, M., Hayakawa, K. (2005). Diffusion-Weighted Imaging of Malignant Breast Tumors. Journal of Computer Assisted Tomography, 29(5): 644-649 https://doi.org/10.1097/01.rct.0000171913.74086.1b
[6] Weaver, D., Krag, D., Manna, E. (2013). Comparison of Pathologist-Detected and Automated Computer-Assisted Image Analysis Detected Sentinel Lymph Node Micrometastases in Breast Cancer. Mod Pathol, 16: 1159-1163. https://doi.org/10.1097/01.MP.0000092952.21794.AD
[7] Fear, E.C., Hagness, S.C., Meaney, P.M., Okoniewski, M., Stuchly, M.A. (2002). Enhancing breast tumor detection with near-field imaging. IEEE Microwave Magazine, 3(1): 48-56. https://doi.org/10.1109/6668.990683.
[8] Katz, J.L., Weiner, H., Gallagher, T.F., Hellman, L. (1970). Stress, Distress, and Ego Defenses: Psychoendocrine Response to Impending Breast Tumor Biopsy. Arch Gen Psychiatry, 23(2): 131-142. https://doi.org/10.1001/archpsyc.1970.01750020035005
[9] Boetes, C., Mus, R.D., Holland, R., Barentsz, J.O., Strijk, S.P., Wobbes, T., Hendriks, J.H., Ruys, S.H. (1995). Breast tumors: comparative accuracy of MR imaging relative to mammography and US for demonstrating extent. Radiology, 197(3): 743-747.
[10] Grosenick, D., Moesta, K.T., Wabnitz, H., Mucke, J., Stroszczynski, C., Macdonald, R., Schlag, P.M., Rinneberg, H. (2003). Time-domain optical mammography: initial clinical results on detection and characterization of breast tumors. Applied Optics, 42(16): 3170-3186. https://doi.org/10.1364/AO.42.003170
[11] Lagree, A., Mohebpour, M., Meti, N., Saednia, K., Lu, F. I., Slodkowska, E., Tran, W.T. (2021). A review and comparison of breast tumor cell nuclei segmentation performances using deep convolutional neural networks. Scientific Reports, 11(1): 1-11. https://doi.org/10.1038/s41598-021-87496-1
[12] Rakhlin, A., Tiulpin, A., Shvets, A.A., Kalinin, A.A., Iglovikov, V.I., Nikolenko, S. (2019). Breast Tumor Cellularity Assessment Using Deep Neural Networks. Proceedings of the IEEE/CVF International Conference on Computer Vision (ICCV), 0-0.
[13] Schreer, I. (2009). Dense breast tissue as an important risk factor for breast cancer and implications for early detection. Breast Care, 4(2): 89-92. https://doi.org/10.1159/000211954 PMID: 20847885
[14] Mahmood, T., Li, J., Pei, Y., Akhtar, F., Jia, Y., Khand, Z.H. (2021). Breast mass detection and classification using deep convolutional neural networks for radiologist diagnosis assistance. In 2021 IEEE 45th Annual Computers, Software, and Applications Conference (COMPSAC), 1918-1923. https://doi.org/10.1109/COMPSAC51774.2021.00291
[15] Arefan, D., Mohamed, A.A., Berg, W.A., Zuley, M.L., Sumkin, J.H., Wu, S. (2020). Deep learning modeling using normal mammograms for predicting breast cancer risk. Medical Physics, 47(1): 110-118. https://doi.org/10.1002/mp.13886 PMID: 31667873
[16] Ha, R., Chin, C., Karcich, J. (2019). Prior to Initiation of Chemotherapy, Can We Predict Breast Tumor Response? Deep Learning Convolutional Neural Networks Approach Using a Breast MRI Tumor Dataset. Journal of Digital Imaging, 32(5): 693-701. https://doi.org/10.1007/s10278-018-0144-1
[17] Zhang, J., Saha, A., Zhu, Z., Mazurowski, M.A. (2018). Hierarchical convolutional neural networks for segmentation of breast tumors in MRI with application to radiogenomics. IEEE transactions on medical imaging, 38(2): 435-447. https://doi.org/10.1109/TMI.2018.2865671
[18] Aydın, M., Hardalaç, F., Ural, B., Karap, S. (2016). Neonatal jaundice detection system. Journal of medical systems, 40(7): 1-11. https://doi.org/10.1007/s10916-016-0523-4
[19] Liu, L., Li, K., Qin, W., Wen, T., Li, L., Wu, J., Gu, J. (2018). Automated breast tumor detection and segmentation with a novel computational framework of whole ultrasound images. Medical & biological engineering & computing, 56(2): 183-199. https://doi.org/10.1007/s11517-017-1770-3
[20] Sevim, Y. (2022). A new feature extraction method for EMG signals. Traitement du Signal, Vol. 39, No. 5, pp. 1615-1620. https://doi.org/10.18280/ts.390518
[21] Nioka, S., Colak, S.B., Li, X., Yang, Y., Chance, B. (1998). Breast tumor images of hemodynamic information using a contrast agent with back projection and FFT enhancement. In Advances in Optical Imaging and Photon Migration (p. ATuD8). Optica Publishing Group. https://doi.org/10.1364/AOIPM.1998.ATuD8
[22] Janghel, R.R., Shukla, A., Tiwari, R., Kala, R. (2010). Breast cancer diagnosis using artificial neural network models. In The 3rd International Conference on Information Sciences and Interaction Sciences, 89-94. https://doi.org/10.1109/ICICIS.2010.5534716
[23] Shukla, A., Tiwari, R., Kaur, P. (2009). Knowledge based approach for diagnosis of breast cancer. 2009 IEEE International Advance Computing Conference, 6-12. https://doi.org/10.1109/IADCC.2009.4808971
[24] Wassila, S., Lotfi, M., Mohammed, M.S. (2019). Breast cancer detection using the svr approach for different configurations of microwave ımaging system. 2019 6th International Conference on Image and Signal Processing and their Applications (ISPA), 1-5. https://doi.org/10.1109/ISPA48434.2019.8966915
[25] Yen, P.L., Hsu, H.C.,Lin, Y.C. (2016). Robot-assisted identification of breast tumor biomechanics. In 2016 IEEE International Conference on Industrial Technology (ICIT), 1488-1490. https://doi.org/10.1109/ICIT.2016.7474979
[26] Wang, J., Yang, X., Cai, H., Tan, W., Jin, C., Li, L. (2016). Discrimination of breast cancer with microcalcifications on mammography by deep learning. Scientific reports, 6(1): 1-9. https://doi.org/10.1038/srep27327
[27] Wang, J., Lei, L., Yang, Y. (2021). Deep learning features for discriminating between benign and malignant microcalcification lesions. Electronic Imaging, 2021(10): 246-1.
[28] Saber, A., Sakr, M., Abo-Seida, O.M., Keshk, A., Chen, H. (2021). A novel deep-learning model for automatic detection and classification of breast cancer using the transfer-learning technique. IEEE Access, 9: 71194-71209. https://doi.org/10.1109/ACCESS.2021.3079204
[29] Albashish, D., Al-Sayyed, R., Abdullah, A., Ryalat, M. H., Almansour, N.A. (2021). Deep CNN model based on VGG16 for breast cancer classification. In 2021 International Conference on Information Technology (ICIT), 805-810. https://doi.org/10.1109/ICIT52682.2021.9491631