Shijiao Yuan
© 2022 IIETA. This article is published by IIETA and is licensed under the CC BY 4.0 license (http://creativecommons.org/licenses/by/4.0/).
OPEN ACCESS
Commodity display images oriented to Internet marketing play an important role in the supply and demand interaction and two-way communication between marketing personnel and consumers. Traditional commodity image classification is mainly conducted manually by the staff of online shopping platforms or the store maintenance staff, which is heavy in workload, high in cost and low in efficiency. To this end, this article studies classification and retrieval of commodity images oriented to Internet marketing. In this study, coarse-grained emotion is taken as priori information, and an image emotion classification network based on joint polarity detection is constructed. This article discusses the association rules between the color and texture of commodity images, the shape, styling features and contained emotion of concrete commodities. Besides, this article puts forwards an emotion-based retrieval method of commodity images oriented to Internet marketing, and presents a concrete train of thought of this method. The experimental result verifies the effectiveness of the classification and retrieval method of commodity images.
internet marketing, commodity image, image classification, image retrieval
Internet marketing is network marketing based on the Internet [1-6], which is a new marketing method to find the channels of network marketing and to achieve marketing objectives by means of computer information technology and the interaction between computer terminal, client-side and server-side [7-13]. To give full play to the creativity and initiative of marketing personnel, Internet marketing website is designed to transmit a variety of media information such as texts, sounds and images, compatible with various forms of information exchange for commodity trading on the Internet [14-24]. Therefore, commodity display images oriented to Internet marketing are very important for the supply and demand interaction and two-way communication between marketing personnel and consumers.
Images play a crucial role in online shopping. To test their effect on consumers, most previous studies rely on human assessment to set standard to measure photos. This method limits the number of dimensions and samples that can be investigated in a study. Wang et al. [25] uses image processing techniques to address this challenge, develops a framework and distinguishes two computer-generated metrics, namely aggregation metrics and decomposition metrics that can be used in different ways in empirical studies. Cheng et al. [26] proposes a new deep neural network called AsymNet to explore a new cross-domain task Video2Shop, with the goal of matching clothes that appear in videos with identical items in online stores. For images, a mature method is used to detect and extract features of clothing patches of arbitrary size. In addition, an approximate training method is proposed to achieve the efficiency of training. A large number of experiments on large cross-domain data sets prove the effectiveness and efficiency of the proposed AsymNet which is superior to the most advanced methods. A multi-modal searching method combining text-based and image-based search techniques is proposed [27]. In addition to text search, a two-stage image searching method is put forward. This method uses basic features composed of color and texture features to filter unmatched images in the first stage and adopts SIFT feature for accurate search in the second stage. The effectiveness of the method and the multi-modal search prototype system is verified, and the retrieval results can meet customers' online shopping needs well. Goswami et al. [28] studies the importance of image-based features to click-through-rate (CTR) in large-scale product search engines. Generally, a product search engine uses text-based function in its ranking functions. A new idea that uses image-based features which are common in photography references in addition to text-based features is presented. The relationship between features and CTR is learned with a regression model based on stochastic gradient enhancement.
Traditional commodity image classification is mainly conducted manually by the staff of online shopping platforms or the store maintenance staff, which is heavy in workload, high in cost and low in efficiency. As the scale of online shopping platforms increases, traditional commodity image classification mode cannot meet the needs of consumers for rapid classification and retrieval of massive commodity images. Therefore, it is of great practical significance to study classification and retrieval of commodity images oriented to Internet marketing.
This article studies classification and retrieval of commodity images oriented to Internet marketing. In the second chapter, coarse-grained emotion is taken as priori information, and an image emotion classification network based on joint polarity detection is constructed to realize fine-grained emotion prediction of commodity images. The network model consists of three parts: feature extraction backbone, spatial self-attention module and polarity detection branch. In the third chapter, this article discusses the association rules between the color and texture of commodity images, the shape, styling features and contained emotion of concrete commodities. Besides, this article puts forwards an emotion-based retrieval method of commodity images oriented to Internet marketing, and presents a concrete train of thought of this method. The experimental result verifies the effectiveness of the classification and retrieval method of commodity images.
The emotional polarity of commodity images greatly influences the potential purchase intention of consumers. Fine-grained emotion classification of commodity images is of great significance in understanding consumption emotion and analyzing consuming behavior of consumers. Fine-grained emotion is a further extension of coarse-grained emotion with only two categories: positive emotion and negative emotion, namely satisfaction, anger, excitement and disgust. In this study, coarse-grained emotion is taken as priori information, and an image emotion classification network based on joint polarity detection is constructed, which enhances the ability of the commodity image classification model to describe non-local association relationship between commodity images and finally realizes fine -grained emotion prediction of commodity images. The network model consists of three parts: feature extraction backbone, spatial self-attention module and polarity detection branch.
The spatial self-attention module is set to enable the model to effectively capture and fully utilize global information of commodity images, and to complete more meticulous learning of the correlation between image blocks in the feature map. The module in composed of two parts: block location information embedding and spatial self-attention encoder.
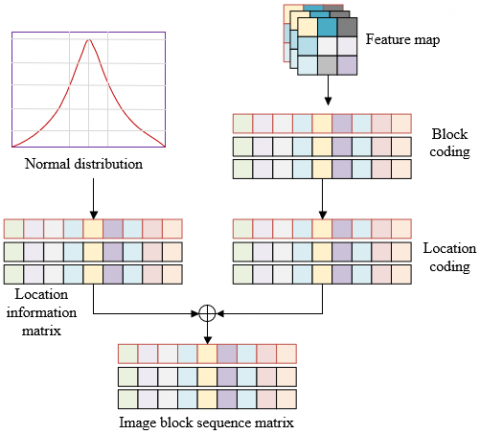
Figure 1. Operation flow of block location information embedding
Figure 1 shows the operation flow of block location information embedding. In the operation of block location information embedding, 1x1 convolution operation is performed on a feature map output by the feature extraction backbone, and then a channel reduction processing is conducted. Assuming that the number of channels, the height and the width of the feature map are respectively represented by D, F and Q, the feature map G∈RD×F×Q can be generated. After G is flattened, the generated image block sequence and the corresponding location coding matrix are respectively represented by G'∈RFQ×D and O∈RFQ×D. Finally, O is added to G' by bits to obtain the final image block sequence matrix output A∈RFQ×D, namely:
$A=G^{\prime}+O$ (1)
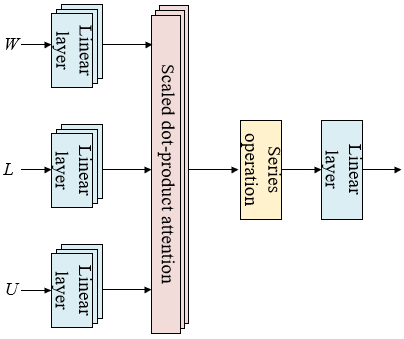
Figure 2. Structure of multi-head attention
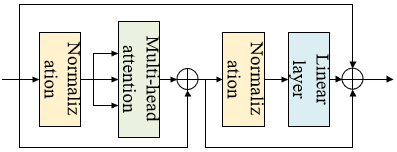
Figure 3. Structure of spatial self-attention encoder
The final commodity image classification result can be obtained by sending A to the spatial self-attention encoder for calculation, and then through the processing of pooling and full connection layer. The spatial self-attention encoder of the model is composed of 12 sub-encoders in series of the same structure that can perform self-attention calculation and residual calculation. Figure 2 and Figure 3 show structures of multi-head attention and spatial self-attention encoder. It is assumed that the query vector is w∈Rd’, the key vector is l∈Rd’, the value vector is u∈Rd’, the middle dimension is D'=d/f, the total number of heads in multi-headed attention is f, the layer normalization operation is Γ(∙), the linear layer operation is Q, and the row vector of the t-th row of the image sequence block A is at, where t∈{1, 2, ..., FQ}. In each sub-encoder k, the image block sequence matrix is subjected to layer normalization operation and linear transformation to obtain w, l and u and the corresponding calculation process is given as follows:
$w_t^{\left(k, f_i\right)}=\Gamma\left(a_t^{l-1}\right) Q_W^{\left(k, f_i\right)}$ (2)
$l_t^{\left(k, f_i\right)}=\Gamma\left(a_t^{k-1}\right) Q_L^{\left(k, f_i\right)}$ (3)
$u_t^{\left(k, f_i\right)}=\Gamma\left(a_t^{k-1}\right) Q_u^{\left(k, f_i\right)}$ (4)
The obtained w and l are first subjected to scaled dot-product attention calculation, and then subjected to the dot product and summation with u. Assuming that Softmax activation function is expressed by Ω(∙),t'∈{1, 2, ..., FQ}, the following formula gives the calculation process of each head in the multi-head attention:
$A H_i=\sum_{t^{\prime}=1}^{F Q} \Omega\left(\frac{w_t^{\left(k, f_i\right)} \cdot l_{t^{\prime}}^{\left(k, f_i\right) T}}{\sqrt{D^{\prime}}}\right) u_{t^{\prime}}^{\left(k, f_i\right)}$ (5)
The self-attention calculation of AHiis conducted, that is, series, linear transformation and residual connection are carried out in sequence. Assuming that the series operation is represented by Ψ(∙), the calculation formula is as follows:
$a_t^{\prime k}=\Psi\left(H E_1, \ldots, H E_f\right) Q_E+a_t^{k-1}$ (6)
Further residual calculation is performed on the result of self-attention calculation, that is, layer normalization, linear transformation and residual connection are performed in sequence, and the calculation formula is as follows:
$a_t^k=\operatorname{LN}\left(a_t^{\prime k}\right) Q+a_t^{\prime k}+a_t^{k-1}$ (7)
Considering the binding effect of polar emotion on the emotion category of commodity images, a polarity detection branch combining channel attention with spatial attention is set in this article. In order to obtain more fine-grained emotion information, the convolution block attention in the emotion attention area detection branch of commodity images is finely adjusted. Figure 4 shows the polarity detection branch structure.
Figure 4. Polarity detection branch structure
In the convolution block attention module, after the feature map of commodity images G∈RD×F×Q is processed by global average pooling layer and global maximum pooling layer, two channel description vectors with the weight vector Xd can be obtained. Assuming that ReLU activation function is represented by ReLU(∙), global maximum pooling is represented by GMP(∙), global average pooling is represented by GAP(∙), and the dimension-ascending and dimension-descending fully-connected layers are represented by Qv and Qc, respectively, the formula is to calculate Xd:
$X_{d_n}=Q_v \operatorname{ReLU}\left(Q_c G M P(G)\right)$ (8)
$X_{d_x}=Q_v \operatorname{ReLU}\left(Q_c G A P(G)\right)$ (9)
$X_d=\Omega\left(N_{d_n}+N_{d_x}\right)$ (10)
The weighted feature map generated by Xd and Gis represented by GD. By processing GD through global average pooling layer and global maximum pooling layer, two spatial description graphs with spatial weight Nr can be obtained. Assuming that 1×1 convolution layer is represented by Conv(∙), the calculation formula of Nr is given by:
$N_{r_n}=G M P\left(G_d\right)$ (11)
$N_{r_x}=G A P\left(G_d\right)$ (12)
$N_r=\Omega\left(\operatorname{Conv}\left(\Psi\left(N_{r_n}, N_{r_x}\right)\right)\right)$ (13)
After Nr and G are fused and subjected to residual operation, global average pooling and global maximum pooling, the desired polar emotion classification of commodity images can be obtained.
The research of emotion involves many aspects such as psychology, philosophy and physiology. The study of image processing and image retrieval based on emotion analysis is only at the initial stage. The color of commodity images contains rich and complex emotion information, and the identity between the consumption environment of online shopping platforms and consumers' consumption psychology is utilized to establish the relationship between image emotion and underlying visual features of commodity images and the common points of color emotion.
This article discusses the association rules between the color and texture of commodity images, the shape, styling features and contained emotion of concrete commodities and puts forwards an emotion-based retrieval method of commodity images oriented to Internet marketing. The concrete train of thought of this method is:
1) A series of color models are provided to the consumers who participate in the experiment, consumers are asked to describe each model with multiple emotion words. The algorithm generates emotion description operators in the form of color code and gray code based on the description result.
2) If the key words of commodity retrieval contain emotional words, the algorithm generates corresponding retrieval color code and retrieval gray code;
3) Similarity calculation is performed between the generated retrieval color code and retrieval gray code and the image color code and gray code in the commodity image database of online shopping platforms;
4) By comparing the similarity calculation results, the commodity image with the largest similarity is selected and fed back to consumers as the retrieval result.
Upon the start of commodity retrieval, the retrieval color code SMRE[i] and retrieval gray code BR are obtained, and the image color code and gray code in the commodity image database of online shopping platforms need to be extracted. The generation method of the image color code and gray code in the commodity image database is described in detail below. Regarding the generation of color code, there are six steps as follows:
1) A 19-dimensional commodity image database image color code SMCID[i] is formed first, and each element is initialized to 0;
2) The color space of the image is transformed from RGB to HIS;
3) Find the commodity image area corresponding to each pixel tone, and gradually increase the value of the image color code in the associated product image database;
4) SM*CID[i] can be obtained by repeating the above steps for all pixels in commodity images.
5) Color code normalization is required for large-size commodity images. Assuming that the i-th index of the image color code in the commodity image database is represented by SMCID[i], and the horizontal and vertical dimensions of the image are Q and F, the calculation formula is as follows:
$S M_{C D}[i]=\frac{S M_{C D}^* \quad [i]}{Q \times F}$ (14)
6) The above steps are repeated for all images in the commodity image database of online shopping platforms.
There are four steps for the generation of gray code:
1) A two-dimensional commodity image database image gray code SCCID[i], i=0,1 is formed first, and each element is initialized to 0;
2) Assuming that RGB values of the pixel point (a, b) of commodity images are represented by R(a, b), G(a, b), B(a, b), the image size Q×F, and the gray value of the pixel point (a, b) is represented by BR(a, b), and the average gray value is represented by BRAV, the overall average brightness of commodity images is calculated based on the following formula:
$B R=\frac{R(a, b)+G(a, b)+B(a, b)}{3}$ (15)
$B R_{A V}=\frac{\sum_{a=0}^Q \sum_{b=0}^F B R(a, b)}{Q \times F}$ (16)
3) Tamura roughness of commodity images is calculated to obtain the image spot size information;
4) The above steps are repeated for all images in the commodity image database of online shopping platforms.
After the image color code and gray code in the commodity image database are generated, they are brought into the database as commodity image features for commodity image retrieval in the future.
The color similarity RC(RE, CID) is defined as retrieval color code SMRE[i] which represents product sum of the elements corresponding to commodity image database image color code SMCID[i]. The calculation formula is as follows:
$R_C(R E, C I D)=\sum_{i=0}^{18} S M_{R E}^\lambda[i] \times S M_{C I D}[i]$ (17)
In the above calculation process, the relevant weight in SMCID[i] needs to be multiplied by the proportion SMλRE[i] of the color i in commodity images, and other colors also need to be weighted for their cumulative sum. If the color i is important to the emotion λ of commodity images, that is, the value of SMλRE[i] is high, the product of SMλRE[i] and SMCID[i] will be large. If the color i is not important to the emotion λ of commodity images, that is, the value of SMλRE[i] is low, the product of SMλRE[i] and SMCID[i] will be small. Therefore, the higher the color i value in the emotion λ of commodity image is, the larger the RC(RE, CID) value is, the higher the color similarity of commodity images is, and the higher the success rate of retrieval is.
The gray code similarity RG(RE, CID) can be calculated based on the brightness and spot size values of the retrieved gray code and the image gray code in the commodity image database. RG(RE, CID) is added with RC(RE, CID) as comprehensive similarity R(RE, CID) for commodity image retrieval. Assuming that weights corresponding to color code similarity and gray code similarity are represented by θC and θG, then the formula is:
$R(R E, C I D)=\theta_C \times R_C(R E, C I D)+\theta_G \times R_G(R E, C I D)$ (18)
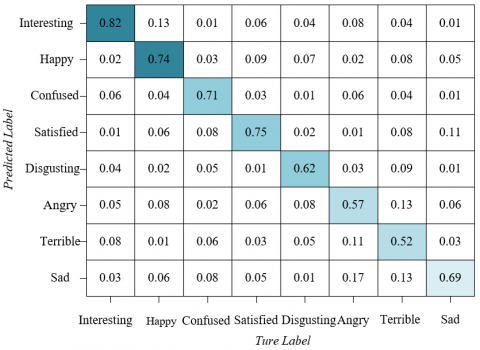
Figure 5. Confusion matrix
Figure 5 shows confusion matrix of this model in the commodity image database of online shopping platforms. It can be seen that the classification accuracy of this model is better than other algorithms on most fine-grained emotion classes, which proves that this model is suitable for classification of most commodity images. The main reason is that the spatial self-attention module and polarity detection branch are introduced into this model, which conforms to emotion law of consumers and effectively describes the relationship between the commodity image classification model and non-local area of commodity images. The coarse-grained emotion extracted is more exquisite, so that the classification accuracy of commodity images is higher than that of other models.
Table 1. Ablation experiment result 1
|
VGG-16 |
ResNet-101 |
Convolution block attention |
Spatial self-attention without residual |
Spatial self-attention |
Classification accuracy |
|
√ |
/ |
/ |
/ |
/ |
72.14 |
|
√ |
/ |
/ |
√ |
/ |
77.95 |
|
√ |
/ |
√ |
/ |
/ |
71.42 |
|
√ |
/ |
|
/ |
√ |
78.28 |
|
/ |
√ |
/ |
/ |
/ |
73.52 |
|
/ |
√ |
/ |
√ |
/ |
77.17 |
|
√ |
√ |
√ |
/ |
/ |
71.47 |
|
/ |
√ |
|
/ |
√ |
78.53 |
In order to further verify the effectiveness of introducing spatial self-attention module and polarity detection branch in this model, ablation experiment is designed in this article and the experimental results are presented in Table 1 and Table 2. As can be seen from the tables, the classification effect of commodity images is better by introducing spatial self-attention model than by introducing convolution block attention and spatial self-attention without residual. The spatial self-attention realization model effectively captures and utilizes the global information of commodity images, and completes more meticulous learning of the correlation between image blocks in the feature map, improving the classification performance of the network effectively. The model introducing spatial self-attention module and polarity detection branch obtains the best classification performance because the polarity detection branch module enables the network model to get more exquisite coarse-grained emotion information.
Table 2. Ablation experiment result 2
|
Backbone network |
Convolution block attention |
Spatial self-attention |
Polarity detection branch |
Classification accuracy |
|
√ |
/ |
/ |
/ |
71.02 |
|
√ |
√ |
/ |
/ |
77.43 |
|
√ |
/ |
√ |
/ |
79.05 |
|
√ |
/ |
/ |
√ |
82.34 |
|
√ |
√ |
√ |
/ |
71.02 |
|
√ |
|
√ |
√ |
89.62 |
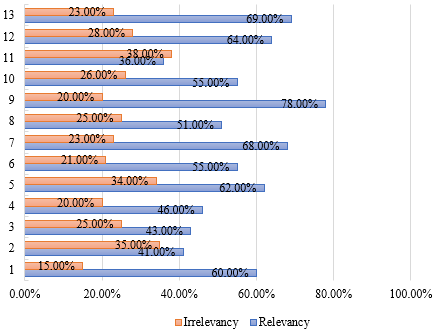
The initial values of θC and θG are set to 0.5, and the retrieval color code SMRE[i] and retrieval gray code BR are automatically generated by the system after the commodity retrieval is started. After the retrieval, the system will select the commodity image with the largest similarity and feed back to consumers as the retrieval result. 10 consumers participate in the experiment of commodity image retrieval. For the 12 emotional words involved, the average relevancy is larger than the average irrelevancy, and the retrieval result is shown in Figure 6. There are significant differences in the relevance and irrelevance of different emotional words, and the relevance and irrelevance of emotional words such as "interesting", "happy", "confused" and "satisfied" are quite different. However, there is relatively small difference in the relevance and irrelevance of emotional words such as "disgusting", "angry", "terrible" and "sad".
Figure 6. Retrieval result of initial weight
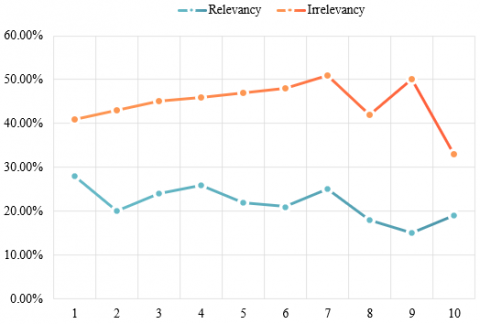
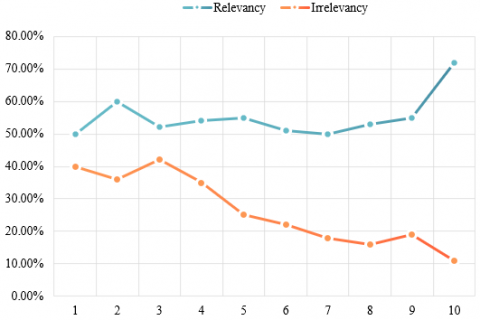
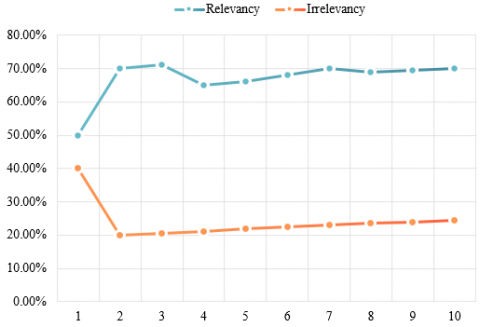
There is small difference in the relevance and irrelevance of emotional words such as "interesting", "happy", "confused" and "satisfied". In this article, the weights and parameters of the model are adjusted, and the results of the relevant feedback iteration after weight adjustment are shown in four sub-graphs of Figure 7. As can be seen from the figure, the experimental results of the four emotional words "interesting", "happy", "confused" and "satisfied" are basically consistent with the expected results. After adjusting the weights and model parameters, the relevance of the four emotional words is increased and the irrelevance is decreased, which proves the effectiveness of the retrieval method of commodity images based on emotion analysis.
1)
2)
3)
4)
Figure 7. Retrieval result after adjustment of weights and model parameters
This article studies classification and retrieval of commodity images oriented to Internet marketing. Taking coarse-grained emotion as priori information, this article constructs an image emotion classification network based on joint polarity detection. This article discusses the association rules between the color and texture of commodity images, the shape, styling features and contained emotion of concrete commodities. Besides, this article puts forwards an emotion-based retrieval method of commodity images oriented to Internet marketing, and presents a concrete train of thought of this method. The experimental results show the confusion matrix of this model in the commodity image database of online shopping platforms, and verify that this model has a higher classification accuracy of commodity images than other models. What's more, this article designs ablation experiment to further verify the effectiveness of introducing spatial self-attention module and polarity detection branch in this model. The retrieval results before and after the adjustment of weights and model parameters are given to verify the effectiveness of the retrieval method of commodity images based on emotion analysis.
[1] Xie, Q. (2022). Market network marketing performance evaluation in a smart city based on fuzzy algorithm. Journal of Testing and Evaluation, 51(3): 20220076. https://doi.org/10.1520/JTE20220076
[2] Yang, R. (2020). Enterprise network marketing prediction using the optimized GA-BP neural network. Complexity, 2020. https://doi.org/10.1155/2020/6682296
[3] Wang, T.Z., Zhu, L. (2020). Development strategy of e-commerce network marketing based on new media marketing mode. In Data Processing Techniques and Applications for Cyber-Physical Systems, (DPTA 2019) Singapore, pp. 417-424. https://doi.org/10.1007/978-981-15-1468-5_51
[4] Weng, C., Liu, T. (2020). Design and implementation of network precision marketing system based on big data algorithm. In 2020 2nd International Conference on Applied Machine Learning (ICAML), pp. 70-73.
[5] Peng, C. (2020). Channel optimization of marketing based on users’ social network information. Complexity, 2020: 8833780. https://doi.org/10.1155/2020/8833780
[6] Xu, S., Zhou, A. (2020). Hashtag homophily in twitter network: Examining a controversial cause-related marketing campaign. Computers in Human Behavior, 102: 87-96. https://doi.org/10.1016/j.chb.2019.08.006
[7] Vikatos, P., Gryllos, P., Makris, C. (2020). Marketing campaign targeting using bridge extraction in multiplex social network. Artificial Intelligence Review, 53(1): 703-724. https://doi.org/10.1007/s10462-018-9675-6
[8] Sun, J. (2022). Variational fuzzy neural network algorithm for music intelligence marketing strategy optimization. Computational Intelligence and Neuroscience, 2022: 9051058. https://doi.org/10.1155/2022/9051058
[9] Chu, Z., Ding, H., Zeng, G., Huang, Y., Yan, T., Kang, Y., Li, S. (2022, October). Hierarchical capsule prediction network for marketing campaigns effect. In Proceedings of the 31st ACM International Conference on Information & Knowledge Management, New York, NY, United States, pp. 3043-3051. https://doi.org/10.1145/3511808.3557099
[10] Yu, Y.H., Liu, J. (2022). Optimizing film companies' marketing strategy using blockchain and recurrent neural network model. Computational Intelligence & Neuroscience. https://doi.org/10.1155/2022/4139074
[11] Barykin, S.E., Sergeev, S.M., Provotorov, V.V., Lavskaya, K.K., Kharlamov, A.V., Kharlamova, T.L. (2022). Energy efficient digital omnichannel marketing based on a multidimensional approach to network interaction. Frontiers in Energy Research, 10. https://doi.org/10.3389/fenrg.2022.946588
[12] Xu, L., Choi, D., Yang, Z. (2022). Deep neural network-based sports marketing video detection research. Scientific Programming, 2022: 8148972. https://doi.org/10.1155/2022/8148972
[13] Lv, H. (2022). Smart product marketing strategy in a cloud service wireless network based on SWOT analysis. Wireless Communications and Mobile Computing, 2022: 7539860. https://doi.org/10.1155/2022/7539860
[14] Wei, X., Hao, Z., Du, B. (2021). Dangerous goods identification based on multi-channel neural network. In Journal of Physics: Conference Series, 2082(1): 012008. https://doi.org/10.1088/1742-6596/2082/1/012008
[15] Guo, L., Liu, Z., Chen, Z. (2021). A novel bilateral protocol in the bipartite network based on the public goods game. Knowledge-Based Systems, 214: 106721. https://doi.org/10.1016/j.knosys.2020.106721
[16] Liu, M., Xue, W., He, L., Yan, X. (2021). Time-space evolution of the goods export network of the Belt and Road countries: The view of weighted complex network. Journal of Intelligent & Fuzzy Systems, 41(4): 4973-4982. https://doi.org/10.3233/JIFS-189984
[17] Nasiri, G.R., Kalantari, M., Karimi, B. (2021). Fast-moving consumer goods network design with pricing policy in an uncertain environment with correlated demands. Computers & Industrial Engineering, 153: 106997. https://doi.org/10.1016/j.cie.2020.106997
[18] Mirzaei, M., Al-e, S.M.J.M., Shirazi, M.A. (2021). A maximum-flow network interdiction problem in an uncertain environment under information asymmetry condition: Application to smuggling goods. Computers & Industrial Engineering, 162: 107708. https://doi.org/10.1016/j.cie.2021.107708
[19] Huang, W., Zhou, B., Yu, Y., Yin, D. (2021). Vulnerability analysis of road network for dangerous goods transportation considering intentional attack: Based on Cellular Automata. Reliability Engineering & System Safety, 214: 107779. https://doi.org/10.1016/j.ress.2021.107779
[20] Kim, W., Lee, C. (2021). Development of convolutional neural network architecture for detecting dangerous goods for X-ray aviation security in artificial intelligence. In IFIP International Conference on Advances in Production Management Systems, Nantes, France, pp. 609-615. https://doi.org/10.1007/978-3-030-85906-0_66
[21] Abbasi-Tavallali, P., Feylizadeh, M.R., Amindoust, A. (2021). A system dynamics model for routing and scheduling of cross-dock and transportation in reverse logistics network of perishable goods. Journal of Intelligent & Fuzzy Systems, 40(6): 10417-10433. https://doi.org/10.3233/JIFS-200610
[22] Han, M., Wu, S., Chang, Q., Chen, C., Han, Y., Huang, Y. (2021). Risk assessment of railway out-of-gauge goods transportation based on fault tree and fuzzy Bayesian network. Tiedao Xuebao/Journal of the China Railway Society, 43(5): 9-17. https://doi.org/10.3969/j.issn.1001-8360.2021.05.002
[23] Yeşil, G., Bolat, B. (2019). Electricity consumption forecasting with artificial neural network for fast-moving consumer goods sector. In Proceedings of the International Symposium for Production Research 2019, pp. 51-61. https://doi.org/10.1007/978-3-030-31343-2
[24] Huang, W., Zhang, Y., Zuo, B., Yu, Y., De Dieu, G.J., Xu, Y. (2020). Using an expanded Safety Failure Event Network to analyze railway dangerous goods transportation system risk-accident. Journal of Loss Prevention in the Process Industries, 65: 104122. https://doi.org/10.1016/j.jlp.2020.104122
[25] Wang, M., Li, X., Chau, P.Y. (2021). Leveraging image-processing techniques for empirical research: feasibility and reliability in online shopping context. Information Systems Frontiers, 23(3): 607-626. https://doi.org/10.1007/s10796-020-09981-8
[26] Cheng, Z.Q., Wu, X., Liu, Y., Hua, X.S. (2017). Video2shop: Exact matching clothes in videos to online shopping images. In Proceedings of the IEEE Conference on Computer Vision and Pattern Recognition, pp. 4048-4056.
[27] Li, R., Wang, D., Zhang, Y., Feng, S., Yu, G. (2012). An approach of text-based and image-based multi-modal search for online shopping. In International Conference on Web-Age Information Management, Harbin, China, pp. 172-184. https://doi.org/10.1007/978-3-642-32281-5_17
[28] Goswami, A., Chittar, N., Sung, C.H. (2011). A study on the impact of product images on user clicks for online shopping. In Proceedings of the 20th international conference companion on World wide web, New York, NY, United States, pp. 45-46. https://doi.org/10.1145/1963192.1963216