Qaysar Mohi ud Din | Anavai K. Jayanthy*
© 2022 IIETA. This article is published by IIETA and is licensed under the CC BY 4.0 license (http://creativecommons.org/licenses/by/4.0/).
OPEN ACCESS
Autism Spectrum Disorder (ASD), a neurological abnormality that influences how an individual perceives and interacts with others, which leads to issues with social interaction and communication. In accordance with the Centers for Disease Control and Prevention, 1 in every 44 children in USA is affected by ASD. The identification of ASD is based on behavioural characteristics and it generally takes a long time from the initial observation of behavioural signs to the final diagnosis, due to the complexity and diversity of ASD symptoms. The application of Electroencephalography (EEG) signals, recorded from 14 ASD affected children and 14 healthy controls, as a potential biomarker for ASD categorisation, was analysed in this study. After pre-processing, second-order Wavelet Scattering Transform (WST) coefficients were extracted from the EEG signals and Deep Learning (DL) based ASD detection networks (WST-ASDNets) were used for categorisation of ASD and control subjects. Long Short Term Memory Network (LSTM) based WST-ASDNet and Convolution Neural Network (CNN) based WST-ASDNet achieved accuracy of 94% and 92% respectively, in ASD subject identification. The results demonstrate that the proposed WST-ASDNets can efficiently classify ASD and the usage of WST coefficients extracted from EEG signals can be used as potential biomarker for ASD categorisation.
autism spectrum disorder classification, biomedical signal classification, EEG, wavelet scattering transform, artificial intelligence, deep neural networks, computer aided diagnosis
Autism Spectrum Disorder (ASD) is a neurodevelopmental condition that influences how people connect with others, communicate, learn, and behave [1, 2]. Nonverbal behaviors such as eye contact, facial expressions and body positions, as well as stereotyped repetitive behaviours and interest in social functions, communications and activities, are all considerably reduced [3]. In accordance with the Centers for Disease Control and Prevention, by the age of 8, 1 in every 44 children in the United States is affected by ASD [4]. ASD results from altered brain development and subjects have higher brain volumes than typically developing children [5, 6]. The wide range of ASD symptoms makes the ASD diagnosis tough and the early diagnosis is essential to prevent an interminable wait between the earliest concerns of parents and clinical diagnosis of ASD. Early detection of ASD helps in the early intervention to benefit the subjects [7].
Numerous studies have attempted to establish more accurate diagnostic indices for ASD based on Electroencephalography (EEG), as a result of the advancement of neuroimaging technology. EEG technology is a non-invasive method of capturing electrical brain signals. Different bands with varied frequency ranges can be found in brain waves and a range of feature extraction methods for categorisation have been applied [8]. EEG is a suitable clinical tool for brain function monitoring since it is inexpensive and simple to carry out [9].
Fourier Transform and Wavelet Transform are the most common signal processing methods used for feature extraction. The Fourier Transform is locally time-invariant; however, it is not stable for high frequency deformations. The Wavelet Transform is an effective tool for the analysis and categorisation of non stationary and non-linear signals. It is stable against such deformations, but is not invariant to the transformation if under sampling is included. Therefore, the Fourier and Wavelet Transforms are not the best strategies for feature extraction [10-12].
Wavelet Scattering Transform (WST), a recently created knowledge-based feature extraction method, is a deep Convolution Neural Network (CNN) equivalent created by a cascade of wavelets, modulus nonlinearities and low-pass filters [10]. It produces representations that are stable against time-warping distortions, noise-resistant, and time-shift invariant [11]. This makes WST a particularly ideal method for the feature extraction of non-linear and non-stationary signals and it has been broadly applied for the classification of audio, hand-written digit recognition and ECG beat classification [13-15]. WST has also been applied on EEG signals to categorise alcoholic and non-alcoholic subjects [12].
1.1 Related work
Deep Learning (DL) methods have been used in many areas [16, 17]. Numerous studies have been conducted to utilise EEG signals for ASD categorisation. Machine Learning (ML) and DL techniques, which are growing in popularity, have been used for ASD identification. ML classifiers like k-Nearest Neighbour (k-NN) and Support Vector Machine (SVM) were employed for ASD categorisation and an accuracy of 93% was attained [18]. Sheikhani et al. [19] employed k-NN for classification and Short-term Fourier Transform (STFT) for extracting the features to attain an efficiency of 82.4% using a dataset consisting of 17 subjects. In another study, the authors used EEG signals from 28 subjects and employed STFT and Mahalanobis distance in alpha band to reach 96.4% accuracy [20]. In yet another study, EEG signals were transformed into 2D images using STFT and textural features were extracted. Using the textural features, SVM attained an accuracy of 95.3% in ASD identification [21]. In another study, 4s long EEG segments from 86 ASD subjects and 89 normal subjects were band-pass filtered (0.5Hz-45Hz) and Discrete Fourier Transform (DFT) was applied to obtain time-frequency representations of the EEG signals. Accuracy of 92.63% was achieved by CNN in classifying the ASD and normal subjects [22]. Bosl et al. [9] obtained EEG signals from 99 subjects with an older offspring suffering from ASD and 89 control subjects. EEG signals were divided into six frequency bands and nine non-linear features were obtained from the six frequency bands. They achieved a sensitivity, specificity and positive predictive value of more than 95% in the categorisation of ASD and normal controls [9].
A technique for diagnosing ASD based on Wavelet chaos and fractality was proposed by Ahmadlou et al. They obtained 90% accuracy using a two layer Radial Basis Function Neural Network (RBFNN) using EEG data from 17 subjects [23]. CNN was utilised to categorise the children with ASD and normal controls with an accuracy of 95% after combining EEG time-frequency characteristics and eye-tracking features [24]. In yet another study, time-frequency spectrograms obtained from EEG data were used to categorise the ASD individuals and controls using ML and DL techniques [25]. Spectrograms obtained from EEG signals have been used for ASD identification using pre-trained ResNet50 with an accuracy of 81% [26]. EEG signals have also been used to obtain Scalograms using Continuous Wavelet Transform (CWT) to classify ASD using pre-trained neural network models like GoogleNet and SqeezeNet [27].
The application of EEG as a biomarker for ASD detection can lead to automated identification of ASD subjects as early as possible. In this study, we propose two WST-ASDNets, which are computer aided ASD identification systems based on WST and DL based models. EEG data from 28 subjects were pre-processed using 0.5Hz-50Hz band pass filter and Artifact Subspace Reconstruction (ASR) algorithm. A two layer WST network was used to extract WST coefficients from the data. The WST coefficients were used as input features to DL based WST-ASDNets. After feature extraction, Principal Component Analysis (PCA) was utilised for feature reduction and the proposed DL based WST-ASDNets were utilised to identify the ASD subjects and the normal subjects. The effectiveness of the suggested models was contrasted with few ML based classifiers and the results indicated that the proposed models outperform the ML based models.
WST-ASDNets were utilised for feature extraction and categorisation of ASD subjects using EEG signals. The block diagram of this work is illustrated in Figure 1.
The EEG signals recorded from 14 ASD and 14 control subjects were pre-processed using a band-pass filter and ASR algorithm. WST was used for extracting the features from the pre-processed EEG signals. PCA performed dimensional reduction and features were normalised before feeding them to the (Long Short Term Memory) LSTM Network based WST-ASDNet and CNN based WST-ASDNet for ASD categorisation. ML classifiers were also used to categorise ASD using the WST features and the results were compared with classification results of LSTM Network based WST-ASDNet and CNN based WST-ASDNet. The classification performances of the proposed LSTM based WST-ASDNet and CNN based WST-ASDNet were further evaluated using another EEG dataset which contained 16 channel EEG signals from 13 ASD and 4 normal subjects.
Figure 1. Workflow of this study
2.1 Dataset
The EEG data for this research was obtained from Simons Foundation for Autism Research Initiative (SFARI). The request for EEG data from SFARI was approved by our institution's Institutional Review Board (IRB) and ethics committee approval was obtained. There are 57 subjects total in the original dataset. However, one control subject's haircut impeded the acquisition of high-quality data during recording and the data from one control subject's EEG recording was lost. The patients received a clinical diagnosis for ASD. Using a 128-channel HydroCel Geodesic net and a Net Amps 300 amplifier for amplification, the resting-state EEG signals were recorded. The EEG signals were sampled at 500 Hz and average referenced. The data had undergone high pass filtering at 1 Hz and notch filtering at 60 Hz.
Table 1. Demographic and genotype information of the subjects
|
Genotype |
Sex |
Site |
|
Control |
Males:6 Females:8 |
Boston |
|
ASD |
Males:9 Females:5 |
Boston |
In this study, we used data from 28 subjects (14 subjects with ASD and 14 control subjects), who were in the age between 30-165 months. The demographic and genotype information about the subjects used in this study is presented in Table 1.
Another dataset which was used to evaluate and compare the results obtained by WST-ASDNets in categorising ASD and normal subjects was obtained from King Abdulaziz University, Jeddah. The dataset consisted of EEG signals of 13 ASD and 4 normal subjects. More detailed information about the original dataset is provided in the study of Alhaddad et al. [28]. Resting-state EEG signals that are 256 Hz sampled were band-pass filtered (0.5Hz-50Hz) and then a dataset of size 768×4096 (signals × samples) was prepared. It consisted of 50% data from ASD subjects and 50% from normal subjects.
2.2 Pre-processing
The pre-processing was performed in two steps: band-pass filtering and bad segment rejection. The EEG signals were band-pass filtered (0.5Hz-50Hz) to remove the unwanted frequencies in the signals. Adaptive spatial filtering approach called ASR algorithm was employed to find and eliminate high-amplitude data components (such as those resulting from muscle contractions, eye blinks and sensor motion) that have higher amplitude comparably to some artifact-free reference data [29, 30]. This technique is based on sliding-window PCA, which statistically interpolates any high-variance signal components that surpass a certain threshold in relation to the calibration dataset's covariance. Artifact-free 6944 EEG signals (50% from ASD subjects and 50% from healthy controls) consisting of 4096 samples were used in this study.
2.3 Feature extraction
The DL based WST-ASDNets performed feature extraction from the pre-processed data by using a two layer WST network. WST creates signal representations that are translation invariant, stable and informative. It is resistant to deformations and maintains class discriminability, making it very useful for EEG categorisation.
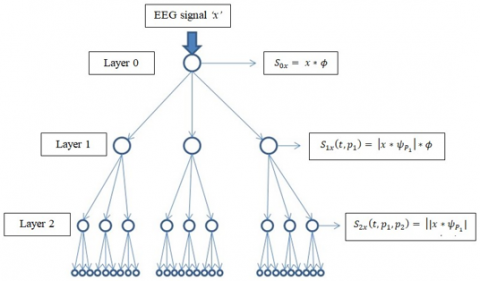
At layer 0 (zero order), the input signal ‘x’ is convolved with a scaling function ‘ϕ’, which yields zero order scattering coefficients as shown in Eq. (1).
$S_{0 x}=x * \phi$ (1)
where, * represents convolution. After obtaining the zero order scattering coefficients, the signal is then convolved with mother wavelet ‘ψ’ at a center frequency (p1) of the first order wavelets. The modulus (a non-linear operator) of the obtained CWT coefficients is convolved with a low pass filter ‘ϕ’ (scaling function), which produces layer 1 (first order) scattering features, as shown in Eq. (2). This process is also known as temporal averaging. The time-shift invariance and stability against time-warping deformations are imposed by this averaging.
$S_{1 x}\left(t, p_1\right)=\left|x * \psi_{P_1}\right| * \phi$ (2)
The second CWT is performed directly on top of the first CWT; in other words, a second-order wavelet ‘$\psi_{P_2}$’ uses the entire first CWT as its input and convolves with each row, much like a low-pass filter does. Modulus of the second CWT is convolved with low-pass filter to get second-order coefficients as shown in Eq. (3).
$S_{2 x}\left(t, p_1, p_2\right)=|| x * \psi_{P_1}\left|* \psi_{P_2}\right| * \phi$ (3)
With a time-average ‘S0x= x*ϕ’, the zero-order scattering coefficients are obtained, which define the local translation invariance of the signal. The high-frequency components of the convolved signal are lost as a result of the averaging operation at each stage, but they can be retrieved by convolution with the wavelet at the subsequent stage. The process of WST coefficients extraction from the EEG signals is illustrated as a flowchart in Figure 2.
Figure 2. Two-layer WST performed on EEG signals
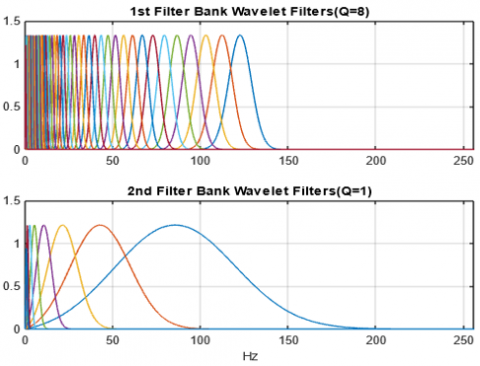
As the number of layers increases, the energy of the scattering coefficients diminishes and 99.9% of energy is contained in the first two levels [14]. Additionally, Ahmed et al. [31] found that two WST layers were sufficient to extract features from EEG. The same number of layers were employed to extract features from the EEG data in this study (i.e., second order WST coefficients were used). The mother wavelet employed was the Morlet (Gabor) wavelet [12]. ‘Q’ specifies the number of wavelets per octave. High frequency wavelet filters are wider than low frequency wavelets. However, there isn't a general formula for choosing an octave frequency resolution. In the first filter bank, we utilised 8 wavelets per octave and in the second filter bank, we used 1 wavelet per octave. The Morlet wavelets ψP1 (Q1=8) and ψp2 (Q2=1) are shown in Figure 3.
Figure 3. Morlet wavelets used in this study
The invariance scale (low-pass filter time scale) for which the WST is invariant to translations was selected from a set of T={1, 2, 4, 6} s. Invariance scale is one of the most important parameters of the WST which affects the accuracy of classification models. We selected an invariance scale (T=2s) using which the WST and DL based WST-ASDNets obtained maximum accuracy. The low-pass filter's bandwidth increases as the invariance scale decreases. For a constant value of Q, a reduction in the invariance scale increases the number of the coefficients/features.
In the pre-processed dataset, the network treats each row (EEG channel) as a separate signal. The selection of T, N (number of scattering layers) and Q affects the number of scattering routes and time frames in the representation for each signal. Using T=2s, N=2, and Q=(8, 1), the extracted second order WST coefficients from the dataset of dimensions 6944×4096, is a tensor with 16 time frames for each of the 147 scattering routes for each signal as its output. The tensor of dimensions 147×16×6944 was reshaped into a matrix of size 111104×147.
2.4 Classification
Classification of ASD and normal subjects based on the WST coefficients (used as input features for classification algorithms) extracted from EEG signals was performed using ML classifiers and WST-ASDNets. SVM algorithm, Logistic Regression (LR), k-NN and Decision Tree (DT) were the ML algorithms used.
SVMs are supervised classifier models that are used to solve issues such as classification and regression. SVM with Guassian kernel function and kernel scale of 1 was used. The LR model gives the probability of occurrence (between 0 and 1) of a class or event. The DT model used in this study employed Gini’s diversity index as split criteria and the total number of splits performed was 100. In this study, we used a k-NN in which number of neighbours was one and Euclidean distance was used as a distance metric.
One WST-ASDNet used WST extracted features and 1D-CNN for ASD categorization. Another WST-ASDNet used WST features and LSTM network for ASD classification. The information about the CNN layers, input size for each layer and other parameters are given in Table 2.
Table 2. Layer and parameter details of the proposed CNN based WST-ASDNet
|
Layer |
Type |
Input size |
Filters |
Kernel size |
Activation |
|
0 |
Input layer |
(None, 50, 1) |
|
|
|
|
L1 |
1D Convolution |
(None, 50, 1) |
256 |
3 |
ReLU |
|
L2 |
1D Convolution |
(None, 48, 256) |
256 |
3 |
ReLU |
|
L3 |
Dropout |
(None, 46, 256) |
|
|
|
|
L4 |
Max pooling 1D |
(None, 46, 256) |
|
|
|
|
L5 |
Flatten |
(None, 23, 256) |
|
|
|
|
L6 |
Dense |
(None, 5888) |
|
|
ReLU |
|
L7 |
Dense |
(None, 124) |
|
|
Sigmoid |
The kernel size and number of filters, which obtained the maximum accuracy, were used. The CNN consisted of two 1D convolution layers, a dropout layer, a max-pooling layer (pool size=2), a flatten layer and two fully connected layers. Rectified Linear Unit (ReLU) and Sigmoid functions were utilised to carry out the nonlinear activations in the hidden and output layers, respectively, in order to acquire more efficient feature representations.
The LSTM network used in this study consisted of two LSTM layers, a flatten layer, and a fully connected layer. The overall characteristics of the LSTM network are given in Table 3.
The Adaptive Moment Estimation (Adam) optimizer was used to update the model weights in both these networks. To reduce over-fitting, regularisation was applied to the CNN and LSTM network using a dropout of 0.5. The final output layer of both these networks had a size of 1, which is appropriate for a binary classification problem.
Table 3. Overall features of the proposed LSTM based WST-ASDNet
|
Layer |
Type |
Input shape |
Units |
|
L0 |
Input layer |
(None, 50, 1) |
|
|
L1 |
Lstm |
(None, 50, 1) |
256 |
|
L2 |
Lstm |
(None, 50, 256) |
256 |
|
L3 |
Batch Normalization |
(None, 50, 256) |
|
|
L4 |
Dropout |
(None, 50, 256) |
|
|
L5 |
Flatten |
(None, 50, 256) |
|
|
L6 |
Dense |
(None, 12800) |
128 |
|
L7 |
Dense |
(None, 128) |
1 |
Data with fewer dimensions requires less processing power and training time, which improves ML algorithms' overall performance. Over-fitting is also avoided via dimensional reduction. PCA was used for reducing the dimensions of the dataset from 111104×147 to 111104×50. The number of columns was reduced from 147 to 50 by using PCA. Feature reduction had no considerable effect of the classification accuracies of the ML and DL models. However, the computational time decreased quite considerably. WST-ASDNets were trained using the number of epochs as 50 and a batch size of 32. When the number of epochs was increased to 75 or 100, it didn’t lead to increase in accuracy of the models and the training and validation curves plateaued out after certain number of epochs.
3.1 Classification results of WST-ASDNets and ML classifiers
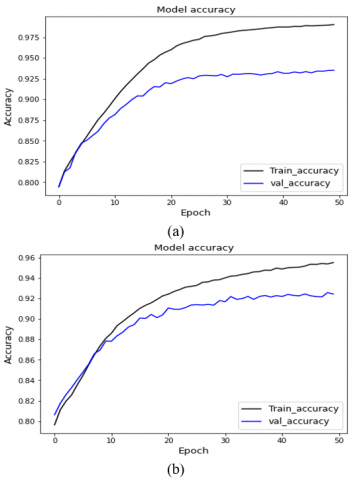
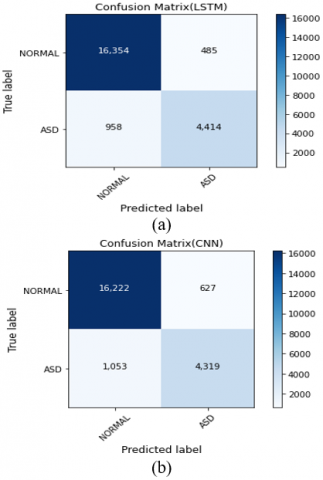
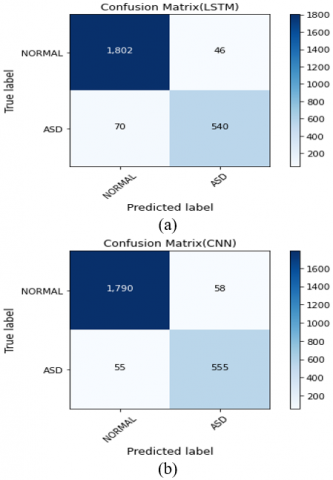
SVM, k-NN, LR and DT are the four ML based models which were used for ASD categorisation by using the WST features extracted from EEG signals. Among the four ML based classifiers, k-NN algorithm performed better in terms of accuracy (90%), sensitivity (69%), specificity (97%), precision (89%) and the other performance metrics that were used for the performance evaluation of the models. In case of ML based models, the sensitivity/recall was lower than the specificity/true negative rate. DT model achieved the highest sensitivity of 74% among the ML based models and the LR model achieved the minimum sensitivity of 36% among all the classifiers. The classification results obtained by all the classifiers used in this study are presented in Table 4. Two WST and DL based WST-ASDNets were proposed in this work for ASD categorisation. The classification results obtained by the WST-ASDNets have been presented in Table 4. The learning curves and the confusion matrices of the proposed LSTM based and CNN based WST-ASDNets are shown in Figure 4 and Figure 5.
The proposed LSTM based WST-ASDNet achieved an accuracy of 94% and the CNN based WST-ASDNet achieved an accuracy of 92% in identifying the ASD subjects. The achieved sensitivity, specificity and all the other performance metrics were higher in LSTM based WST-ASDNet than the CNN model. The sensitivity is lower than the specificity in case of the DL based models as well. The comparison of the classification performances of the ML and DL based models is shown in Figure 6.
Figure 4. a) Learning curve of LSTM based WST-ASDNet b) Learning curve of CNN based WST-ASDNet
Figure 5. a) The confusion matrix of LSTM based WST-ASDNet b) The confusion matrix of CNN based WST-ASDNet
Figure 6. Performance comparison of DL and ML based models
As shown in Figure 6 and Table 4, The DL models performed better in terms of accuracy, sensitivity, precision, F1 Score and all the other performance evaluation metrics that were used in this study in identifying the ASD and healthy controls.
3.2 Classification results of WST-ASDNets using 16 channel EEG dataset
The performance of WST-ASDNets was tested on a different 16 channel EEG dataset. After pre-processing, WST was applied and it transformed the dataset into 147×16×768 tensor, which was then reshaped into a 12288×147 matrix. The PCA reduced the dimensions of 12288×147 matrix to 12288×50.
The proposed WST-ASDNets were used for ASD categorisation. 80% of the data was utilised for training the networks and 20% was utilised to test the performance of the trained networks. The confusion matrices obtained by LSTM based WST-ASDNet and CNN based WST-ASDNet are shown in Figure 7.
Figure 7. a) The confusion matrix of LSTM based WST-ASDNet b) The confusion matrix of CNN based WST-ASDNet
Table 4. The Classification results obtained by all the classifier
|
Model |
Accuracy % |
Sensitivity % |
Specificity % |
Precision % |
F1 Score |
Negative Predictive value |
False Positive rate |
False discovery rate |
False Negative rate |
Mathews correlation coefficient |
|
LSTM-WST-ASDNet |
94 |
82 |
97 |
90 |
0.86 |
0.94 |
0.03 |
0.09 |
0.17 |
0.82 |
|
CNN-WST-ASDNet |
92 |
80 |
96 |
87 |
0.84 |
0.94 |
0.03 |
0.12 |
0.19 |
0.79 |
|
k-NN |
90 |
69 |
97 |
89 |
0.77 |
0.90 |
0.02 |
0.10 |
0.30 |
0.72 |
|
Decision Tree |
89 |
74 |
94 |
80 |
0.77 |
0.92 |
0.05 |
0.19 |
0.25 |
0.71 |
|
SVM |
84 |
42 |
97 |
82 |
0.56 |
0.84 |
0.02 |
0.17 |
0.57 |
0.51 |
|
Logistic Regression |
80 |
36 |
94 |
64 |
0.46 |
0.82 |
0.06 |
0.35 |
0.63 |
0.37 |
Table 5. The classification results of WST-ASDNets using 16 channel EEG dataset
|
Model |
Accuracy % |
Sensitivity % |
Specificity % |
Precision % |
F1 Score |
Negative Predictive value |
False Positive rate |
False discovery rate |
False Negative rate |
Mathews correlation coefficient |
|
LSTM-WST-ASDNet |
95 |
89 |
98 |
92 |
0.90 |
0.96 |
0.02 |
0.07 |
0.11 |
0.87 |
|
CNN-WST-ASDNet |
95 |
90 |
97 |
91 |
0.91 |
0.97 |
0.03 |
0.09 |
0.09 |
0.87 |
|
k-NN |
93 |
78 |
98 |
95 |
0.85 |
0.93 |
0.01 |
0.04 |
0.21 |
0.82 |
|
Decision Tree |
91 |
80 |
95 |
83 |
0.81 |
0.93 |
0.05 |
0.16 |
0.20 |
0.76 |
|
SVM |
91 |
67 |
98 |
93 |
0.88 |
0.90 |
0.01 |
0.07 |
0.32 |
0.73 |
|
Logistic Regression |
86 |
60 |
95 |
81 |
0.68 |
0.87 |
0.04 |
0.19 |
0.40 |
0.61 |
As presented in Table 5, the proposed WST-ASDNets perform exceptionally well in identifying ASD subjects and healthy controls.
3.3 Performance evaluation of WST-ASDNets
EEG signals have the potential to be a trustworthy source of data for computer assisted ASD diagnosis. In this study, a new approach to automate the identification of ASD was proposed. For that purpose, WST based features were extracted from 28 subjects to categorise the ASD and healthy controls using ML and DL based classifiers. As can be observed from the results, the proposed WST-ASDNets (WST+LSTM and WST+CNN) clearly outperformed the conventional ML classifiers (WST+SVM, WST+LR, WST+k-NN and WST+DT) in categorising the ASD and healthy controls. The classification ability of LSTM based WST-ASDNet was better in comparison to CNN based WST-ASDNet. It also outperformed all the other classifiers that were used in this study. The ASD categorisation efficiency of the proposed DL models was tested using another 16 channel EEG data set. Both the Proposed LSTM and CNN WST-ASDNets achieved an accuracy of 95% in categorising the ASD subjects and healthy controls using the 16 channel EEG dataset. The performance evaluation metrics such as, accuracy, sensitivity, precision and F1score of the DL based WST-ASDNets is close to 1, which indicates that the models were able to distinguish between actual ASD subjects and actual control subjects, which is an important factor considering the importance of false predictions, which can lead to ASD subjects being diagnosed as normal subjects and normal subjects being diagnosed as ASD subjects. The classification results obtained by the proposed DL models using the two EEG datasets indicate that the WST feature extraction technique is an excellent method for ASD categorisation which doesn’t require high computation cost and time. The ASD categorisation efficiency of the proposed DL models was tested using another 16 channel EEG data set. Both the proposed LSTM and CNN WST-ASDNets achieved an accuracy of 95% in categorising the ASD subjects and healthy controls using the 16 channel EEG dataset.
Various AI based techniques have been employed for ASD diagnosis in recently conducted studies. A handful of studies have used the EEG dataset obtained from SFARI dataset (which was used in this study) for ASD categorisation. Autoregressive coefficients, shannon entropy and DFT features were extracted and an accuracy of 93% was attained in ASD categorisation [18]. In yet another study, CNN was used and an accuracy of 92.2% was attained in ASD categorisation [32].
ASD categorisation was performed in several studies by using the EEG dataset obtained from King Abdulaziz University. A study reported to have achieved an accuracy of 99.5% in identifying autism using EEG [33]. Ari et al. used pre-trained CNN to classify ASD using EEG signals as images and obtained 98% accuracy [34]. Tawhid et al. used STFT to convert EEG signals into spectrogram images and obtained an accuracy of 99.15% using CNN for ASD identification [25]. In yet another study, EEG signals were transformed into Scalogram images and then CNN models were used to identify ASD and normal subjects. The authors reported to have achieved an accuracy of 82.98% using SqueezeNet pre-trained CNN [27]. These studies have either used several feature extraction techniques or transformed EEG signals into images and then performed ASD categorisation. The manual extraction of features from EEG signals is a time consuming process and requires expert domain knowledge. Training the pre-trained CNNs and conversion of EEG into images is computationally expensive and time consuming. All the studies that have been performed using the same dataset that were used in this study have been validated using only one dataset.
The use of WST ensures faster training and the DL based WST-ASDNets are capable of ASD categorisation using small training datasets. These models are also computationally less complex than the methods used in previous studies. This paper represents a first attempt to diagnose ASD using the wavelet scattering coefficients/features obtained from EEG signals of ASD and normal participants by using the LSTM and CNN based WST-ASDNets. In order to test how effectively WST-Nets models work with data from various age groups, recording devices, sampling rates, channel counts, and geographic locations, two datasets were utilised for ASD classification. The proposed DL based WST-ASDNets performed exceptionally well in ASD categorisation using both the EEG datasets. The classification results of the two DL based WSD-ASDNets on different EEG datasets also indicate that the models are capable of adjusting to the diversity of the subjects and can perform ASD identification even if the subjects belong to different age groups.
Numerous studies have attempted to establish more accurate diagnostic indices for ASD based on EEG as a result of the advancement of neuroimaging technology. The findings of this study, based on the classification results obtained, indicate that EEG is reliable tool to help the clinicians in making ASD diagnosis. Future research must demonstrate not just the differences in ASD and normal controls but also the differences between ASD and other neurodevelopmental disorders. In this study, two WST and DL based WST-ASDNets were proposed for ASD classification by using the EEG signals. The models were trained and evaluated using 124 channel data from 14 ASD subjects and 14 healthy controls. The WST based features were categorised using ML based classifiers as well. The comparison of the classification results of ML based classifiers and the WST-Nets revealed that the DL based WST-ASDNets outperformed the conventional ML classifiers in every performance metrics that were used for performance evaluation of the models. The performance of the WST-ASDNets was also tested on a second 16 channel EEG dataset and obtained an accuracy of 95% in classifying ASD. The results obtained in this study show that WST based DL models are exceptional tools for detecting ASD from EEG signals and can be vital components for clinical diagnosis of ASD.
The authors express their gratitude to Simons Foundation for Autism Research Initiative (SFARI) and Professor Mohammed Alhaddad (King Abdulaziz University, Jeddah, Saudi Arabia) for supplying the EEG data for this research.
[1] Zwaigenbaum, L., Brian, J.A., Ip, A. (2019). Early detection for autism spectrum disorder in young children. Paediatrics & Child Health, 24(7): 424-443. https://doi.org/10.1093/pch/pxz119
[2] Lord, C., Elsabbagh, M., Baird, G., Veenstra-Vanderweele, J. (2018). Autism spectrum disorder. Lancet, 392(10146): 508-520. https://doi.org/10.1016/S0140-6736(18)31129-2
[3] Vahia, V.N. (2013). Diagnostic and statistical manual of mental disorders 5: A quick glance. Indian Journal of Psychiatry, 55(3): 220-223. https://doi.org/10.4103/0019-5545.117131
[4] Maenner, M.J., Shaw, K.A., Bakian, A.V., Bilder, D.A., Durkin, M.S., Esler, A., Cogswell, M.E. (2021). Prevalence and characteristics of autism spectrum disorder among children aged 8 years—autism and developmental disabilities monitoring network, 11 sites, United States, 2018. MMWR Surveillance Summaries, 70(11): 1-16. http://dx.doi.org/10.15585/mmwr.ss7011a1
[5] Takumi, T., Tamada, K., Hatanaka, F., Nakai, N., Bolton, P.F. (2020). Behavioral neuroscience of autism. Neuroscience and Biobehavioral Reviews, 110: 60-76. https://doi.org/10.1016/j.neubiorev.2019.04.012
[6] Sparks, B.F., Friedman, S.D., Shaw, D.W., Aylward, E.H., Echelard, D., Artru, A.A. (2002). Brain structural abnormalities in young children with autism spectrum disorder. Neurology, 59(2): 184-192. https://doi.org/10.1212/WNL.59.2.184
[7] Sacrey, L.A., Bennett, J.A., Zwaigenbaum, L. (2015). Early infant development and intervention for autism spectrum disorder. Journal of Child Neurology, 30: 1921-1929. https://doi.org/10.1177/0883073815601500
[8] Dodia, S., Edla, D.R., Bablani, A., Ramesh, D., Kuppili, V. (2019). An efficient EEG based deceit identification test using wavelet packet transform and linear discriminant analysis. Journal of Neuroscience Methods, 314: 31-40. https://doi.org/10.1016/j.jneumeth.2019.01.007
[9] Bosl, W.J., Tager-Flusberg, H., Nelson, C.A. (2018). EEG analytics for early detection of autism spectrum disorder: A data-driven approach. Scientific Reports, 8: 6828. https://doi.org/10.1038/s41598-018-24318-x
[10] Anden, J., Mallat, S. (2014). Deep scattering spectrum. IEEE Transactions on Signal Processing, 62: 4114-4128. https://doi.org/10.1109/TSP.2014.2326991
[11] Bruna, J., Mallat, S. (2013). Invariant scattering convolution networks. IEEE Transactions on Pattern Analysis and Machine Intelligence, 35(8): 1872-1886. https://doi.org/10.1109/TPAMI.2012.230
[12] Buriro, A.B., Ahmed, B., Baloch, G., Ahmed, J., Shoorangiz, R., Weddell, S.J., Jones, R.D. (2021). Classification of alcoholic EEG signals using wavelet scattering transform-based features. Computers in Biology and Medicine, 139: 104969. https://doi.org/10.1016/j.compbiomed.2021.104969
[13] Anden, J., Mallat, S. (2011). Multiscale scattering for audio classification. Proceedings of the 12th International Society for Music Information Retrieval Conference, Miami, Florida, USA, pp. 657-662. https://www.di.ens.fr/data/publications/papers/ismir-final.pdf.
[14] Mallat, S. Bruna, J. (2011). Classification with scattering operators. IEEE Conference on Computer Vision and Pattern Recognition, Providence, RI, pp. 1561-1566. https://doi.org/10.1109/CVPR.2011.5995635
[15] Liu, Z., Yao, G., Zhang, Q., Zhang, J., Zeng, X. (2020). Wavelet scattering transform for ECG beat classification. Computational and Mathematical Methods in Medicine, 2020: 3215681. https://doi.org/10.1155/2020/3215681
[16] Rehman, A., Butt, M.A., Zaman, M. (2022). Liver Lesion Segmentation Using Deep Learning Models. Acadlore Transactions on AI and Machine Learning, 1(1): 61-67. https://doi.org/10.56578/ataiml010108
[17] Xie, J., Xi, R., Chang, D. (2022). Mask Wearing Detection Based on YOLOv5 Target Detection Algorithm under COVID-19. Acadlore Transactions on AI and Machine Learning, 1(1): 40-51. https://doi.org/10.56578/ataiml010106
[18] Mohi ud Din, Q., Jayanthy, A.K. (2022). Detection of autism spectrum disorder by feature extraction of eeg signals and machine learning classifiers. Biomedical Engineering: Applications, Basis and Communications. Advance online publication. https://doi.org/10.4015/s1016237222500466
[19] Sheikhani, A., Behnam, H., Mohammadi, M.R., Noroozian, M., Golabi, P. (2008). Connectivity analysis of quantitative Electroencephalogram background activity in Autism disorders with short time Fourier transform and Coherence values, 2008 Congress on Image and Signal Processing, Sanya, Haynan, China, 1: 207-212. http://dx.doi.org/10.1109/CISP.2008.595
[20] Sheikhani, A., Behnam, H., Mohammadi, M.R., Noroozian, M., Mohammadi, M. (2012). Detection of abnormalities for diagnosing of children with autism disorders using of quantitative electroencephalography analysis. Journal of Medical Systems, 36: 957-963. http://dx.doi.org/10.1007/s10916-010-9560-6
[21] Tawhid, M.N.A., Siuly, S., Wang, H. (2020), Diagnosis of autism spectrum disorder from EEG using a time-frequency spectrogram image-based approach. Electronics Letters, 56: 1372-1375. https://doi.org/10.1049/el.2020.2646
[22] Dong, H., Chen, D., Zhang, L., Ke, H., Li, X. (2021). Subject sensitive EEG discrimination with fast reconstructable CNN driven by Reinforcement Learning: A case study of ASD evaluation. Neurocomputing, 449: 136-145. https://doi.org/10.1016/j.neucom.2021.04.009
[23] Ahmadlou, M., Adeli, H., Adeli, A. (2010). Fractality and a wavelet-chaos-neural network methodology for EEG-based diagnosis of autistic spectrum disorder. Journal of Clinical Neurophysiology: Official Publication of the American Electroencephalographic Society, 27(5): 328-333. https://doi.org/10.1097/WNP.0b013e3181f40dc8
[24] Zhang, S., Chen, D., Tang, Y., Zhang, L. (2021). Children ASD evaluation through joint analysis of EEG and eye-tracking recordings with graph convolution network. Frontiers in Human Neuroscience, 15: 651349. https://doi.org/10.3389/fnhum.2021.651349
[25] Tawhid, M., Siuly, S., Wang, H., Whittaker, F., Wang, K., Zhang, Y. (2021). A spectrogram image based intelligent technique for automatic detection of autism spectrum disorder from EEG. PloS one, 16(6): e0253094. https://doi.org/10.1371/journal.pone.0253094
[26] Radhakrishnan, M., Ramamurthy, K., Choudhury, K.K., Won, D., Manoharan, T.A. (2021). Performance analysis of deep learning models for detection of autism spectrum disorder from EEG signals. Traitement du Signal, 38(3): 853-863. http://dx.doi.org/10.18280/ts.380332
[27] Mohi ud din, Q., Jayanthy, A.K. (2022). Automated classification of autism spectrum disorder using eeg signals and convolutional neural networks. Biomedical Engineering - Application Basis and Communication, 34(2). https://doi.org/10.4015/S101623722250020X
[28] Alhaddad, M.J., Kamel, M.I., Malibary, H.M., Alsaggaf, E.A., Thabit, K., Dahlwi, F., Hadi, A.A. (2012). Diagnosis autism by fisher linear discriminant analysis FLDA via EEG. International Journal of Bio-Science and Bio-Technology, 4(2): 45-54. https://www.academia.edu/download/35245146/Diagnosis_Autism_by_Fisher_Linear_Discriminant_Analysis_FLDA_via_EEG.pdf.
[29] Mullen, T., Kothe, C., Chi, Y.M., Ojeda, A., Kerth, T., Makeig, S., Cauwenberghs, G., Jung, T.P. (2013). Real-time modeling and 3D visualization of source dynamics and connectivity using wearable EEG. Annual International Conference of the IEEE Engineering in Medicine and Biology Society, Osaka, Japan, pp. 2184-2187. https://doi.org/10.1109/EMBC.2013.6609968
[30] Delorme, A., Makeig, S. (2004). EEGLAB: An open-source toolbox for analysis of single-trial EEG dynamics. Journal of Neuroscience Methods, 134(1): 9-21. http://dx.doi.org/10.1016/j.jneumeth.2003.10.009
[31] Ahmad, M.Z., Kamboh, A.M., Saleem, S., Khan, A.A. (2017). Mallat’s scattering transform based anomaly sensing for detection of seizures in scalp EEG. IEEE Access, 5: 16919-16929. https://doi.org/10.1109/ACCESS.2017.2736014
[32] Mohi-ud-Din, Q., Jayanthy, A.K. (2021). Autism Spectrum Disorder classification using EEG and 1D-CNN. In 2021 10th International Conference on Internet of Everything, Microwave Engineering, Communication and Networks (IEMECON), pp. 1-5. http://dx.doi.org/10.1109/IEMECON53809.2021.9689100
[33] Bouallegue, G., Djemal, R., Alshebeili, S.A., Aldhalaan, H. (2020). A dynamic filtering DF-RNN deep-learning-based approach for eeg-based neurological disorders diagnosis. IEEE Access, 8: 206992-207007. http://dx.doi.org/10.1109/ACCESS.2020.3037995
[34] Ari, B., Sobahi, N., Alçin, Ö.F., Sengur, A., Acharya, U.R. (2022). Accurate detection of autism using Douglas-Peucker algorithm, sparse coding based feature mapping and convolutional neural network techniques with EEG signals. Computers in Biology and Medicine, 143: 105311. https://doi.org/10.1016/j.compbiomed.2022.105311