Liping Liu* | Guangqiang Luo
© 2022 IIETA. This article is published by IIETA and is licensed under the CC BY 4.0 license (http://creativecommons.org/licenses/by/4.0/).
OPEN ACCESS
Farmers should provide high-quality agricultural products and companies should receive high-quality agricultural products, which is the purpose and pursuit of the business model of "companies plus farmers". In order to increase the stability of the cooperation mode between companies and farmers, it is necessary to detect the quality of agricultural products accurately, objectively and efficiently. Therefore, this article studies the quality inspection method of agricultural products based on image processing. Firstly, the traditional threshold calculation method and threshold function are improved to obtain more ideal denoising effect of agricultural products images. Aiming at the problem that the traditional image processing model cannot obtain fine-grained feature information of image objects, a multi-level feature dependence extraction network is constructed, and the structure and working principle of the network model are introduced in detail. Experimental results verify the effectiveness of the proposed algorithm and model for agricultural product quality inspection.
image processing, quality of agricultural products, image denoising, LSTM network
The business model of "companies plus farmers" began in 1980s. As its name implies, it connects "big companies" with "small farmers" and establishes mutually beneficial supply and marketing relations in the form of contracts [1-7]. This business model has played an active role in farmers' learning production technology and improving the quality of agricultural products. The quality and safety of agricultural products is related to the stability of cooperation between companies and farmers [8-13]. In this community of interests formed through contract mechanism, companies and farmers need to clarify their respective rights and obligations and liabilities for breach of contract. It is the purpose and pursuit of the business model of "companies plus farmers" for farmers to provide high-quality agricultural products and companies to receive high-quality agricultural products [14-19]. Therefore, the quality inspection of agricultural products needs to be accurate, objective and efficient. The traditional pattern recognition method of intelligent sensor system has a single function, which is prone to over-fitting, poor generalization ability and low detection efficiency [20-22]. Therefore, it’s of significance in research and practice to analyze and detect the quality of a variety of agricultural products based on image processing technology.
Current quality inspection, classification and distribution systems have the disadvantages of low yield, larger time consumption, high cost and complexity. Research on machine-controlled fruit selection using image processing aims to create higher quality fruit selection, quality maintenance and production, and reduce labor concentration. Liu et al. [23] comprehensively reviews the current work related to automatic classification and grading of agricultural products. A complete end-to-end automatic and efficient fruit classification and grading system based on image processing is also proposed. Preliminary experimental results prove the effectiveness of the structure. Chen et al. [24] takes agricultural products trademarks as the research object, and designs an image retrieval method based on the shape features of agricultural products trademarks. The boundary feature of trademark image is represented by classical Fourier descriptor, and the regional feature of trademark image is represented by the ratio of target pixel to background pixel. Agricultural products trademarks are retrieved based on the similarity measurement of boundary and regional features. Abbas et al. [25] attempts to identify important features by using weighted feature vectors, rough theory and fuzzy logic, and find higher accuracy in retrieval results, so as to identify the importance of each feature according to users' opinions in each feedback stage. This method is compared with fuzzy color histogram, combination method and fuzzy neighborhood entropy characterized by color location. Simulation results show that compared with the existing methods, the proposed method has higher applicability in image marketing. It’s essential to understand the optical properties of food and agricultural products for quality and safety assessment using optical technology. Wang et al. [26] aims to optimize the frequency region by inverse algorithm, so as to better quantify the optical absorption and reduce the scattering coefficient of double-layer food and agricultural products from the spatial frequency domain reflectivity. The frequency region defined by the start frequency and the end frequency is firstly optimized for the parameter estimation of the first layer and the second layer, respectively [27, 28].
The existing target detection model has too many parameters and computation, and its detection performance is inefficient. However, the above-mentioned methods mainly weigh the extracted image target features from spatial domain, channel domain and mixed domain, which is not conducive to obtaining more layers of attention from more detailed image target feature information, and finally leads to the limitation of image target detection effect. Therefore, this article studies the quality inspection method of agricultural products based on image processing. Firstly, in the second chapter, the traditional threshold calculation method and threshold function are improved to obtain more ideal denoising effect of agricultural products images. As the traditional image processing model ignores the relationship between the low-level features and the high-level features of the image object, it is impossible to obtain the fine-grained feature information of the image object. In the third chapter, a multi-level feature dependence extraction network is constructed, and the structure and working principle of the network model are introduced in detail. Experimental results verify the effectiveness of the proposed algorithm and model for quality inspection of agricultural products.
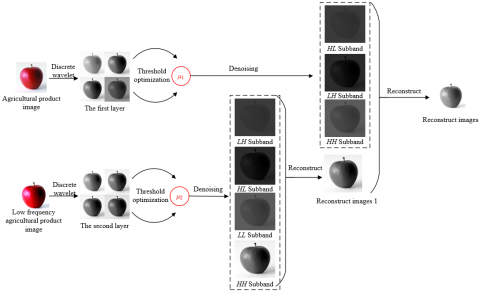
Traditional thresholding denoising theories have some limitations in the field of image processing. Some scholars mainly improve the traditional algorithm through threshold optimization and threshold function optimization, but these improvements are carried out unilaterally. This article improves the threshold calculation method as well as threshold function in order to obtain more ideal denoising effect of agricultural products images. Figure 1 shows the schematic diagram of agricultural product image denoising process.
Figure 1. Schematic diagram of agricultural product image denoising process
The more the wavelet basis function matches the image of agricultural products, the more accurate the quality information of agricultural products extracted by this function will be. The matching degree between wavelet basis function and noisy image of agricultural products can be characterized by the cross-correlation coefficient between the approximate coefficient obtained by discrete wavelet transform and the original agricultural product image. Assuming that the size of the original agricultural product image a(m) is represented by M, the l-th wavelet coefficient of a(m) on the x-th decomposition layer is represented by θP(x,l), the approximation coefficient on the x-th decomposition layer is represented by θP(x), and the average value of the noisy image of agricultural products is represented by a*, the following formula gives the definition formula of the cross-correlation coefficient between the approximation coefficient of noisy image of agricultural products and the original agricultural product image:
$s=\frac{\sum\limits_{l=1}^{M}{\left[ a\left( l \right)-{{a}^{*}} \right]}\left[ \theta P\left( x,l \right)-\overline{\theta P\left( x \right)} \right]}{\sqrt{\sum\limits_{l=1}^{M}{{{\left[ a\left( l \right)-{{a}^{*}} \right]}^{2}}}\sum\limits_{l=1}^{M}{{{\left[ \theta P\left( x,l \right)-\overline{\theta P\left( x \right)} \right]}^{\quad 2}}}}}$ (1)
Traditional threshold calculation methods do not calculate thresholds independently for each decomposition layer. In this article, threshold calculation is regarded as a numerical optimization problem, and the threshold of wavelet coefficients on each decomposition layer is solved based on genetic algorithm.
Firstly, the noisy image of agricultural products is transformed by wavelet basis function to obtain the noisy wavelet coefficients θj,l of each decomposition layer. Then the optimal thresholds μ1, μ2, … μm are obtained by using genetic algorithm to optimize θj,l. In this article, SNR is selected to evaluate the optimal threshold μm obtained on each decomposition layer of agricultural product image. Assuming that the size of agricultural product image is represented by N×M, the original agricultural product image is represented by g(i,j), and the denoised agricultural product image is represented by h(i,j), the following formula gives the definition formula of signal-to-noise ratio:
$XZ=101h\left( \f
Traditional image processing models ignore the relationship between low-level features and high-level features of image objects, so they cannot obtain fine-grained feature information of image objects, which affects the performance of target detection. That’s, it is difficult for low-level neurons in shallow network to obtain effective discriminative features, while the local features extracted by high-level neurons in deep network are prone to lack diversity. Therefore, this article constructs a multi-level feature dependence extraction network to solve the above problems.
In order to extract the local information of each decomposition layer, this article constructs the correlation between convolution channels of convolution neural network to obtain the channel information of each decomposition layer {X1,Xl,…,XL}, and then generates the bottom-up path from XL to X1. This path is combined with the existing top-down path with opposite direction, and can realize the connection of bidirectional paths of the model. It is assumed that the learnable parameters in the fully connected layer are represented by Qs and Qr, and the width, height and position coordinates of Gl in the spatial domain are represented by Q, F and (i,j), respectively. Through the processing of global average pooling layer and two fully connected layers, $X_L \in R^{F \times Q \times D}$ can be generated, specifically as follows:
${{X}_{l}}=sigmoid\left( {{Q}_{r}}\cdot \operatorname{Re}LU\left( {{Q}_{s}}\cdot GAP\left( {{G}_{l}} \right) \right) \right)$ (9)
$GAP\left( {{G}_{l}} \right)=\frac{1}{Q\times F}\sum\limits_{i=1}^{F}{\sum\limits_{j=1}^{Q}{{{G}_{l}}\left( i,j \right)}}$ (10)
Then, Gl is weighted and pooled by global average, and the key information in each decomposition layer is extracted to obtain the multi-level feature $N_l \in R^{1 \times D}$ of agricultural product image:
${{N}_{l}}=GAP\left( {{G}_{l}}\cdot {{X}_{l}} \right)$ (11)
In order to reduce the redundant information of local features of agricultural products, this article evaluates and selects the first largest feature map of agricultural products after descending order by using non-maximum inhibition method, and obtains the average value Gx of the feature map. The image region exceeding $\omega \times G_x$ is set to 0, and suppression is performed by a suppression mask R shown by the following formula:
$R\left( i,j \right)=\left\{ \begin{align} & 0,{{N}_{l}}>\omega \times {{G}_{x}} \\ & 1,otherwise \\ \end{align} \right.$ (12)
In order to further realize the mining of fine-grained features of agricultural product quality, this article gradually combines the more detailed local information in Nl with the key feature information learned in each decomposition layer, and introduces LSTM modeling and attention gating to solve the adaptive adjustment of attention degree of complementary fine-grained features among each decomposition layer. Figure 3 shows the framework of agricultural product quality inspection network model.
Figure 3. Network model framework of agricultural product quality inspection
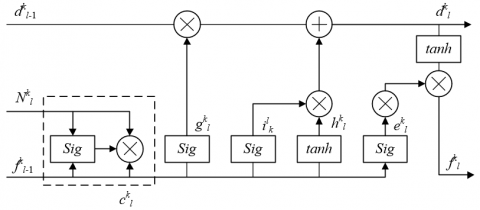
A conventional LSTM unit contains three gate structures, namely forgetting gate gkl, input gate ikl and output gate ekl, with the introduced attention gate represented by xkl. Assuming that the cell state is represented by dkl, in the network attention module, the input of the (k+1) layer is obtained based on the calculation of fkl and dkl. Let k∈[0,K], the number of layers of LSTM is denoted by K, the multiplication and addition of corresponding elements are denoted by $\oplus$ and $\otimes$ respectively, the forgetting gate of layer k is denoted by gkl, the cell state of the previous feature is denoted by dkl-1, the candidate state before entering the cell state is denoted by hkl, and the input gate and output gate of each cell are denoted by ikl and ekl respectively. The dkl and fkl of layer k can be calculated by the following formula:
$d_{l}^{k}=g_{l}^{k}\otimes d_{l-1}^{k}\oplus i_{l}^{k}\otimes h_{l}^{k}$ (13)
$f_{l}^{k}=e_{l}^{k}\otimes \tanh \left( d_{l}^{k} \right)$ (14)
The attention gate xkl can be regarded as a vector with the same size as Nl at the k-th layer. Figure 4 shows the structure diagram of LSTM unit with attention gating. xkl is set mainly for adaptively adjusting different inputs. Assuming that the weight of current input, the weight of previous hidden layer and the weight of offset in xkl are represented by Qx, Qy and yh respectively, then:
$x_{l}^{i}=sigmoid\left( {{Q}_{x}}\cdot N_{l}^{k}+{{Q}_{c}}\cdot f_{l-1}^{k}+{{y}_{h}} \right)$ (15)
xkl can effectively characterize the importance of the l-level feature Nkl and the l-level hidden layer fkl-1 to the fine-grained information of agricultural product quality in Nkl. Then, the response of Nkl in each decomposition layer to the fine-grained information of agricultural product quality is effectively adjusted by the gating of attention gate, and updated as dlkckl:
$c_{l}^{i}=N_{l}^{k}\cdot x_{l}^{k}$ (16)
Therefore, based on the updated input ckl, the calculation results of other activation and gating modules of the LSTM unit can be obtained, and the specific calculation formulas of gkl, ikl, hkl and ekl are given by the following formula:
$g_{l}^{k}=sigmoid\left( {{Q}_{g'}}\cdot c_{l}^{k}+{{Q}_{g}}\cdot \left[ f_{l-1}^{k},f_{f}^{k-1} \right]+{{y}_{g}} \right)$ (17)
$i_{l}^{k}=sigmoid\left( {{Q}_{i'}}\cdot c_{l}^{k}+{{Q}_{i}}\cdot \left[ f_{l-1}^{k},f_{l}^{k-1} \right]+{{y}_{i}} \right)$ (18)
$h_{l}^{k}=sigmoid\left( {{Q}_{h'}}\cdot c_{l}^{k}+{{Q}_{h}}\cdot \left[ f_{l-1}^{k},f_{l}^{k-1} \right]+{{y}_{h}} \right)$ (19)
$e_{l}^{k}=sigmoid\left( {{Q}_{e'}}\cdot c_{l}^{k}+{{Q}_{e}}\cdot \left[ f_{l-1}^{k},f_{l}^{k-1} \right]+{{y}_{e}} \right)$ (20)
After splicing {fk1, fk2,..., fkl,..., fkL} and then inputting them into the fully connected layer and softmax classifier for processing, the fine-grained feature classification of agricultural product quality can be realized, and finally the evaluation results of agricultural product quality can be obtained.
Figure 4. Structure diagram of LSTM unit with attention gating
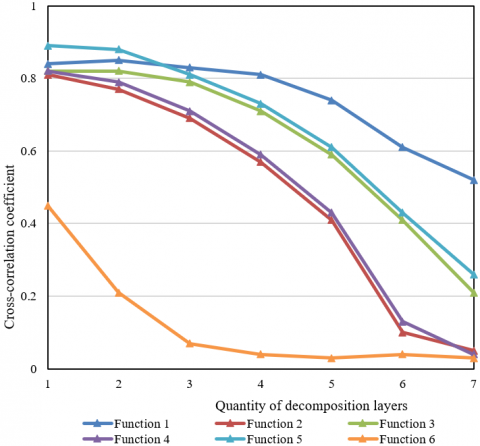
Six sample images of agricultural products were processed by five-layer discrete wavelet transform using six different series of wavelet basis functions. Based on six sample images of agricultural products and wavelet coefficients decomposed by wavelet basis functions, the cross-correlation coefficients corresponding to a single wavelet with the best performance are calculated. Figure 5 shows the change of cross-correlation coefficient under different decomposition levels. Based on Figure 5, the wavelet basis functions are selected, and Haar wavelet basis functions are selected as the most suitable wavelet basis functions for further experiments. Table 1 gives the final result of threshold calculation based on genetic algorithm after twice wavelet decomposition, and gives the maximum fitness function value after 200, 330, 250, 350, 430 and 470 iterations and the threshold of each decomposition layer at corresponding time.
Figure 5. Change of cross-correlation coefficient under different decomposition layers
Table 1. Final result of threshold calculation
|
|
Sample 1 |
Sample 2 |
Sample 3 |
Sample 4 |
Sample 5 |
Sample 6 |
|
Wavelet basis function |
Haar |
Haar |
Haar |
Haar |
Haar |
Haar |
|
Decomposition layer |
2 |
5 |
4 |
5 |
6 |
6 |
|
Iterations of SNR convergence |
200 |
330 |
250 |
350 |
430 |
470 |
|
Maximum SNR |
6.85 |
6.12 |
6.67 |
4.08 |
3.42 |
5.24 |
|
Maximum iterations |
600 |
600 |
600 |
600 |
600 |
600 |
|
Optimal threshold value at each decomposition level |
|
μ1=25 |
|
μ1=23 |
μ1=23 |
μ1=27 |
|
μ1=25 |
μ2=17 |
μ1=21 |
μ2=16 |
μ2=18 |
μ2=18 |
|
|
μ2=17 |
μ3=13 |
μ2=18 |
μ3=15 |
μ3=11 |
μ3=14 |
|
|
|
μ4=11 |
μ3=13 |
μ4=11 |
μ4=8 |
μ4=9 |
|
|
|
|
|
|
μ5=6 |
μ5=3 |
Two different threshold calculation methods, general method and genetic algorithm, are used to denoise agricultural product images, and can retain valuable agricultural product quality feature information and improve the identifiability of the model to image feature areas. For this article, SNR, PSNR, MSE and RMSE are selected to compare the advantages and disadvantages of the two threshold calculation methods. The experimental results are given in Table 2. It can be seen from Table 2 that the performance index values of the two threshold calculation methods after denoising agricultural product images are quite different. The threshold calculation based on genetic algorithm proposed in this article has better performance after denoising six samples of agricultural products, with SNR mean and PSNR mean increased, and MSE mean and RMSE mean decreased.
Table 2. Comparison results of threshold calculation methods
|
Threshold |
Evaluation parameter |
Sample 1 |
Sample 2 |
Sample 3 |
Sample 4 |
Sample 5 |
Sample 6 |
Mean |
|
Universal threshold |
SNR |
4.45 |
5.42 |
3.87 |
1.09 |
2.23 |
1.86 |
3.15 |
|
PSNR |
32.08 |
32.86 |
34.62 |
28.91 |
29.72 |
2.53 |
26.79 |
|
|
MSE |
40.16 |
33.07 |
45.53 |
85.03 |
67.08 |
73.45 |
57.39 |
|
|
RMSE |
6.45 |
5.63 |
6.4 |
9.23 |
8.21 |
8.62 |
7.42 |
|
|
Calculate threshold with genetic algorithm |
SNR |
9.87 |
9.35 |
10.52 |
10.81 |
9.68 |
10.61 |
10.14 |
|
PSNR |
37.62 |
37.12 |
38.69 |
38.49 |
37.42 |
38.62 |
37.99 |
|
|
MSE |
10.84 |
12.26 |
9.26 |
9.16 |
12.04 |
9.45 |
10.50 |
|
|
RMSE |
3.41 |
3.51 |
3.05 |
3.05 |
3.42 |
3.12 |
3.26 |
Table 3. Results of ablation experiment
|
Method |
Computation |
Parameters |
Classification accuracy |
|
Before the construction of channel correlation (A curve) |
17.1 |
26.4 |
84.2 |
|
Before non-maximum suppression method (B curve) |
26.5 |
26.4 |
85.1 |
|
Before key feature information fusion (C curve) |
26.5 |
26.4 |
86.8 |
|
Before the introduction of attention gating (D curve) |
30.2 |
29.2 |
88.7 |
|
Final model (E curve) |
31.9 |
30.5 |
90.9 |
In order to prove the effectiveness of the multi-level feature dependence extraction network for agricultural product quality inspection, this article designs an ablation experiment, and the experimental results are shown in Table 3. As can be seen from the table, the correlation between convolution channels of convolution neural network is constructed, the non-maximum inhibition method is used to evaluate and select the first largest agricultural product feature map after descending order, and the more detailed local information is gradually combined with the key feature information learned in each decomposition layer, and the model optimization measures such as attention gating are introduced to effectively improve the accuracy of the model for agricultural product quality detection.
Figure 6. PR curves before and after the implementation of different optimization measures
Figure 6 shows the PR curves before and after the implementation of different optimization measures. As can be seen from the figure, the PR curve of the model after the implementation of optimization measures is lower, and the mAP value is correspondingly reduced. This shows that the key feature information fusion effectively provides more detailed features of agricultural product quality, equivalent to data enhancement; by introducing attention gating, the salient areas in the image are suppressed and the background areas are eliminated at the same time, and the attention of the features of each decomposition layer to the fine-grained feature information of agricultural product quality is adaptively adjusted. Finally, the purpose of improving the effective classification of agricultural product quality evaluation results based on the network model is achieved.
This article studies the quality inspection method of agricultural products based on image processing. Firstly, the traditional threshold calculation method and threshold function are improved to obtain more ideal denoising effect of agricultural products images. Aiming at the problem that the traditional image processing model cannot obtain fine-grained feature information of image objects, a multi-level feature dependence extraction network is constructed, and the structure and working principle of the network model are introduced in detail. The experimental results show the change of cross-correlation coefficients under different decomposition levels. Haar wavelet basis function is selected as the most suitable wavelet basis function for further experiments. The final result of threshold calculation is given, which verifies the effectiveness of threshold calculation based on genetic algorithm proposed in this article. Ablation experiment is designed to verify the effectiveness of the multi-level feature dependence extraction network for agricultural product quality inspection.
This research was funded by National Social Science Foundation Key Project (Grant No.: 20AJY012).
[1] Xu, G., Jin, X. (2011). The evolutionary game analysis on the cooperative relationship stability of a tea company and a tea farmer. In International Conference on Advances in Education and Management, Springer, Berlin, Heidelberg, pp. 35-40. https://doi.org/10.1007/978-3-642-23065-3_6
[2] Fu, S., Li, Z., Wang, B., Han, Z., Huo, B. (2018). Cooperative behavior between companies and contract farmers in Chinese agricultural supply chains: Relational antecedents and consequences. Industrial Management & Data Systems, 118(5): 1033-1051. https://doi.org/10.1108/IMDS-05-2017-0194
[3] Zhao, Z., Song, P., Xu, Y. (2022). Research on competition and cooperation relationship of TV-Drama production company based on social network. Computational Intelligence and Neuroscience, 2022: 9913269. https://doi.org/10.1155/2022/9913269
[4] Liang, X., Wang, Y., Tan, K. (2022). Research on the cooperation model between railway company and express delivery company based on the transaction cost perspective. Alexandria Engineering Journal, 61(1): 785-794. https://doi.org/10.1016/j.aej.2021.06.009
[5] Li, X., Kuang, H., Hu, Y. (2021). Cooperation strategy of port and shipping company under emission control. System Engineering Theory and Practice, 41(7): 1750-1760. https://doi.org/10.12011/SETP2019-1091
[6] Malashkina, O.F., Kovaleva, E.A. (2021). Information analytical system for space products and services inter-company cooperation support. In Advances in the Astronautical Sciences, 174: 493-496.
[7] Purwanto, E.N., Sule, E.T., Soemaryani, I., Azis, Y. (2021). The Roles of Knowledge Management and Cooperation in Determining Company Innovation Capability: A literature review. Interdisciplinary Journal of Information, Knowledge, and Management, 16: 125-145. https://doi.org/10.28945/4739
[8] Kins, R., Cloppenburg, F., Thiel, J., Benning, J., Gries, T. (2020). Does 'data analytics' stop at the boundaries of your own company? New optimization possibilities through cross-company cooperation. Unitex, 2020(2): 10-13.
[9] Philipsen, R., Brauner, P., Valdez, A.C., Ziefle, M. (2018). Evaluating strategies to restore trust in decision support systems in cross-company cooperation. In International Conference on Applied Human Factors and Ergonomics, Orlando, Florida, USA, pp. 115-126. https://doi.org/10.1007/978-3-319-94196-7_11
[10] Brauner, P., Ziefle, M. (2019). Why consider the human-in-the-loop in automated cyber-physical production systems? Two cases from cross-company cooperation. In 2019 IEEE 17th International Conference on Industrial Informatics (INDIN), Helsinki, Finland, pp. 861-866. https://doi.org/10.1109/INDIN41052.2019.8972142
[11] Beutel, M.C., Gökay, S., Ohler, F., Kohl, W., Krempels, K.H., Rose, T., Terwelp, C. (2018). Mobility service platforms: Cross-company cooperation for transportation service interoperability. ICEIS 2018 - Proceedings of the 20th International Conference on Enterprise Information Systems, Funchal, Madeira, Portugal, pp. 151-161. https://doi.org/10.5220/0006705501510161
[12] Hurajova, L., Firsova, S., Glukhova, M.N. (2018). Project based learning and simulation of setting a company to enhance business mindset of master engineer students and international cooperation skills. In 2018 ELEKTRO, Mikulov, Czech Republic, pp. 1-4. https://doi.org/10.1109/ELEKTRO.2018.8398381
[13] Moshkin, I., Kucajevs, J. (2017). Solving company cooperation tasks in the construction of power transmission lines. In 2017 IEEE International Conference on Environment and Electrical Engineering and 2017 IEEE Industrial and Commercial Power Systems Europe (EEEIC/I&CPS Europe), Milan, Italy, pp. 1-5. https://doi.org/10.1109/EEEIC.2017.7977554
[14] Zhu, Y., Liu, T.S., Liang, D.P., Song, Y.Z. (2017). The study on continuous cooperation mode in virtual organizations based on projects: A case study of Biogen Idec Company. In 2017 International Conference on Management Science and Engineering (ICMSE), Nomi, Japan, pp. 172-177. https://doi.org/10.1109/ICMSE.2017.8574393
[15] Soviar, J., Holubčík, M., Vodák, J. (2017). Cooperation management on construction business market in the Slovak republic–an insight from a company. Procedia Engineering, 192: 818-823. https://doi.org/10.1016/j.proeng.2017.06.141
[16] Soviar, J., Lendel, V., Vodák, J., Kundríková, J. (2017). Sustainable Organization of Cooperation Activities in a Company. In Smart City 360°. The second EAI International Summit, Smart City 360°, Bratislava, Slovakia, November 22-24, 2016. Revised Selected Papers. http://dx.doi.org/10.4108/eai.14-2-2017.152177
[17] Rebelo, F., Noriega, P., Cotrim, T., Melo, R.B. (2016). Cooperation university and industry, a challenge or a reality: An example in an aircraft maintenance company. In Advances in Ergonomics in Design, Florida, USA, pp. 245-254. https://doi.org/10.1007/978-3-319-41983-1_22
[18] Radziszewska-Zielina, E. (2016). The application of multi-criteria analysis in the evaluation of partnering relations and the selection of a construction company for the purposes of cooperation. Archives of Civil Engineering, 62(2): 167-182. https://doi.org/10.1515/ace-2015-0072
[19] Vlčková, V. (2015). Ways of cooperation within supply chain in metallurgy from the point of view of company processing steel coils. In Proceedings of 24th International Conference on Metallurgy and Materials METAL 2015, Czech Republic, pp. 2118-2124.
[20] Li, L., Xu, W., Tian, J., Wang, M. (2022). Analysis of E-Commerce Sales Quality of Agricultural Products Based on Big Data. In CIBDA 2022; 3rd International Conference on Computer Information and Big Data Applications, Wuhan, China, pp. 1-4.
[21] Oki, A., Kataniwa, S., Dowaki, K. (2022). Proposal of a method for maintaining the quality of agricultural products under the cold environment. Journal of the Japan Institute of Energy, 101(1): 1-8. https://doi.org/10.3775/jie.101.1
[22] Sun, Y., Huang, Y., Fang, X., Yan, F. (2022). The purchase intention for agricultural products of regional public brands: Examining the influences of awareness, perceived quality, and brand trust. Mathematical Problems in Engineering, 2022: 4991059. https://doi.org/10.1155/2022/4991059
[23] Liu, S., Lei, M., Xu, L., Li, J., Sun, C., Yang, X. (2022). Development of reliable traceability system for agricultural products quality and safety based on blockchain. Transactions of the Chinese Society for Agricultural Machinery, 53(6): 327-337. https://doi.org/10.6041/j.issn.1000-1298.2022.06.035
[24] Chen, X., Ou, X.M., Liang, J.Y., Comite, U., Duarte, N., Yue, X.G. (2021). An empirical study on the effect of agricultural industrialization organization on the quality of agricultural products based on factor analysis and OLS model. In 2021 4th International Conference on E-Business, Information Management and Computer Science, Hong Kong, China, pp. 526-533. https://doi.org/10.1145/3511716.3511796
[25] Abbas, H.M.T., Shakoor, U., Khan, M.J., Ahmed, M., Khurshid, K. (2019). Automated sorting and grading of agricultural products based on image processing. In 2019 8th International Conference on Information and Communication Technologies (ICICT), Karachi, Pakistan, pp. 78-81. https://doi.org/10.1109/ICICT47744.2019.9001971
[26] Wang, Q., Qin, J., Xiang, X., Xie, B., Huang, H., Pan, L. (2015). Agricultural product trademark image retrieval method based on boundary and region features. Journal of Computational and Theoretical Nanoscience, 12(11): 4010-4016. https://doi.org/10.1166/jctn.2015.4311
[27] Pirozmand, P., Kalantari, K.R., Ebrahimnejad, A., Motameni, H. (2021). Improving the similarity search between images of agricultural products: An approach based on fuzzy rough theory. Journal of Intelligent & Fuzzy Systems, 40(5): 9645-9654. https://doi.org/10.3233/JIFS-202147
[28] Hu, D., Lu, R., Ying, Y. (2020). Spatial-frequency domain imaging coupled with frequency optimization for estimating optical properties of two-layered food and agricultural products. Journal of Food Engineering, 277: 109909. https://doi.org/10.1016/j.jfoodeng.2020.109909