Dawlat Mustafa Sulaiman | Adnan Mohsin Abdulazeez | Dilovan Asaad Zebari* | Diyar Qader Zeebaree | Salama A. Mostafa | Shereen Saleem Sadiq
© 2022 IIETA. This article is published by IIETA and is licensed under the CC BY 4.0 license (http://creativecommons.org/licenses/by/4.0/).
OPEN ACCESS
Finger vein biometrics is one of the most promising ways to identify a person because it can provide uniqueness, protection against forgery, and bioassay. Due to the limitations of the imaging environments, however, the finger vein images that are taken can quickly become low-contrast, blurry, and very noisy. Therefore, more robust and relevant feature extraction from the finger vein images is still open research that should be addressed. In this paper, we propose a new technique of deep learning that is based on the attention mechanisms for human finger vein image identification and recognition and is called deep regional learning. Our proposed model relies on an unsupervised learning method that depends on optimized K-Means clustering for localized finger vein mask generation. The generated binary mask is used to build our attention learning model by making the deep learning structure focus on the region-of-interest (ROI) learning instead of learning the whole feature domain. This technique makes the Deep Regional Attention Model learn more significant features with less time and computational resources than the regular deep learning model. For experimental validation, we used different finger vein imaging datasets that have been extracted and generated using our model. Original finger vein images, localized finger vein images (with no background), localized grayscale finger vein images (grayscale images with no background and projected finger vein lines), and localized colored finger vein images (colored images with no background and projected finger vein lines) are used to train and test our model, which gets better results than traditional deep learning and other methods.
biometrics, finger vein identification, deep regional attention, recurrent and residual neural network
Personal identity recognition has demonstrated its validity as being among the most reliable and trustworthy technologies, as well as being rapid in expanding the science of establishing the identification of people [1]. A combination of measurements (measurements that enable a computer to identify individuals in terms of their physical and behavioral traits) is known as biometrics [2-6]. Using biometrics can be identified as how identification can be validated and developed as a method of electroencephalography (EEG) authentication [7], anthropometric identification [8], and facial recognition [9], which can also serve as distinct forms of biometrics, although there are specific options, such as eye iris recognition [10] and ear recognition [11], in which additional features are involved. Finger vein recognition has several advantages as a biometric identification technique: 1) Forging is extremely difficult. 2) It is suitable for use in a contactless environment or under weak contact measurement conditions. 3) Fingerprints are difficult to remove. Authentication using fingerprint sensors is used on laptops and mobile devices. They are embedded into discreet multi-use notebooks and smartphones that use budget fingerprint readers. One of the significant components of the biometric systems for individual identification is fingerprints. This type of identification has been utilized in individual identification as well as in forensic applications due to its stability and uniqueness from one individual to another, even from an individual's birth to death. The ridge of a fingerprint holds some unique points, defined as "minutiae points." The biometric technology of finger veins is less expensive and less intrusive compared to other biometric technologies such as face readers or retina scans. Finger vein recognition can be used in any type of environment. Most individuals discover that they cannot capture images by using video cameras or speaking into a microphone. Systems based on finger veins are easier to use. Moreover, it is considered a flexible alternative due to the ability to register multiple fingers. Finger vein technology has been tested and used for a long time compared to new technologies [12].
Nowadays, finger vein recognition and identification attract attention as a promising method of framework-based biometric identification. In recent years, the finger vein has received much attention from researchers. Finger vein images have very strong and unique patterns that make them very interesting in the biometric recognition field, but with some issues, such as the dryness of fingers, the surface makes accurate performance kind of hard to achieve. Sweatiness will decrease the output of the device, while dryness on the finger can clear the finger pattern. Advances in the quest for alternatives to the inadequacies of finger biometrics have come to the fore because of the increased awareness of their existence. This claim is true, every vein pattern is specific and proves to be important in personal verification. Changing the patterns of finger veins is tricky as it is an inner feature. The captured vein pattern value is difficult to manipulate through the skin, for example in the palm or finger veins. In addition, biometrics are more precise when compared with manual methods because they use the handprint feature in the finger vein scanners, which can be reduced in size by half. Compared to biometric technologies that use the hands, finger vein systems could have smaller devices [13].
Finger vein identification and recognition systems are still a big challenge since they mainly rely on the finger vein patterns beneath the human skin surface. The blood vessels, which are the main finger vein features, are used to extract the significant pattern of an individual, which is almost impossible to counterfeit. However, the blood vessels are invisible and require different techniques to extract the correct pattern, and it depends on the living individual. The main issue with the finger vein application is that there are still some challenges that affect the performance of this system, such as finger vein image quality and well-defined or extracted feature levels [14]. With the growth of the digital economy and safety systems for networks, it is now common for identity information to be verified. Identity verification is needed in everyday situations like using ATMs, unlocking cell phones, logging into personal online accounts, and shopping online. Traditional authentication methods like passwords and PINs [15] have some problems, like being less secure and easy to forget or lose. This makes it hard to meet the security needs of many applications. In recent years, biometric identification technology has gotten more and more attention because of its benefits, such as being able to identify living people, being hard to steal, and having unique features [16].
Traditional techniques for recognizing finger veins do not work well for a lot of people, so they are slowly being phased out. Image processing methods that are based on machine learning are the same as these traditional methods. Among them, deep learning techniques can be more accurate, but they often need a lot of training data, so they are not used very often right now. Different approaches for finger-vein image recognition and identification have been applied using machine learning and deep learning methods, but they still do not meet the challenges in this field, such as finger vein data localization, finger vein pattern extraction, and performance results [17]. For this reason, in this paper, we address those two factors and propose a new finger vein biometric identification and recognition system that solves the issue of image quality and achieves significant levels of feature extraction. Therefore, this paper can summarize some research problems that are being considered and try to build a strong approach and framework that can solve and manage them. Finger vein localization method in which background details and unnecessary information from finger vein images are removed using an unsupervised learning algorithm (optimized k-means clustering). Two stages of finger vein feature extraction are applied to extract some significant features that help the weak classifier achieve higher performance for the human finger vein identification approach. The main contributions of this paper are summarized:
· A new deep regional learning approach for finger vein recognition is proposed. The regional deep attention learning model is applied to the localized finger vein images, such as the original and colored, to significantly achieve the highest performance results on one of the most challenging finger vein datasets.
· The designed model is based on innovatively using attention mechanisms. The Regular Attention Mechanisms framework is used to fine-tune the backpropagated synthesis in a regular deep network. Instead of that, we used the attention mechanisms to fine-tune both feedforward and backward propagated synthesis in the same deep network by using a regional mask to obtain the ROI learning area.
· This study used k-means and fuzzy c-means to cluster, locate, and isolate the finger image from the entire finger vein image, instead of relying on the traditional methodology of global image thresholding.
· This study extracts significant features based on globalized feature pattern map indication (GFPMI).
The rest of this article is organized as follows: Section 2 presents a review of the literature for feature extraction and auto-classification. Section 3 explains the methodology of the study. Section 4 describes the details of the proposed method. Section 5 explains the experimental results.
Several types of research have been introduced into different techniques for finger vein verification and identification based on various methods. For instance, globalized feature extraction depends on supervised learning utilizing the K-nearest neighbor (KNN) classifier or a localized feature descriptor based on deep learning named the convolutional neural network (CNN). Since deep learning-focused machine learning systems have mostly replaced traditional machine learning systems, CNN currently serves as the end-to-end system. It also has impressive speed in contrast to standard algorithms. Compared to conventional methods, it is distinguishable by higher levels of precision [18].
Lu et al. [19] proposed an adoption deep learning model based on the convolutional layer model (CNN) that includes five convolutional layers and two fully connected layers. Their design achieved a recognition rate of 99.53%. Fairuz et al. [20] introduced a CNN for finger vein identification and proposed the incorporation of a local element to depict the configuration of fingers. The presented method demonstrated that the CNN-based local feature descriptor (CNN-CO) and the feature-based discriminative finger fine can be extracted. Essentially, kernels of complex CNN can detect the same kind of functionality and have the same difficulty extracting local features based on the Gabor filter. Based on the results of the experimental system, it appears that the identification of descriptor-based local functions in the vein recognition system seems to work efficiently when extended to two public vein datasets. In the study of Zhu et al. [21], a recognition-based finger vein recognition system using the convolutional neural network (CNN) technique has been proposed. Their deep learning design model has five convolutional layers and four fully connected layers. Their model has achieved better accuracy with a score of 100% due to the experimental results that have been produced in their paper. A deep CNN approach for finger-vein image denoising has been proposed in the study of Hong et al. [22]. The main aim of this approach is to solve the feature extraction issue with data collection for finger vein images. The approach is based on non-linearity mapping of the noisy finger vein images, which are the input of the deep convolutional neural network. The denoising images (features) are then built through the hidden layers by learning the characteristics of the finger vein image. The proposed system has two stages. The first one is the convolution subnet, and the second stage is the deconvolution subnet. Both are implemented to obtain more features from the finger vein texture.
Song et al. [23] proposed a deep learning approach based on the convolutional neural network (CNN) to solve the degradation in performance recognition issues caused by finger positional variation, misalignment, and shading. They mainly used different inputs for their deep network by calculating the distance between the feature vectors that are extracted from the CNN by using a densely connected convolutional network (DenseNet). The proposed system has been tested on the SDUMLA-HMT finger vein dataset, which is the Shandong University homologous multi-modal traits. study [24] proposed a deep-learning approach for finger vein image identification based on low-quality images. CNN proposed this method for achieving stable and high-accuracy performance with varying finger vein image quality. The experimental results for this approach showed that the proposed system has achieved a 95% identification rate for all available public finger vein datasets. Table 1 shows how CNN-based deep learning methods, such as convolutional neural networks (CNNs), can be used to recognize images of finger veins.
Table 1. Biometric recognition-based finger vein using deep CNN architecture
|
Ref |
database |
FC |
Ai |
Input size |
CL |
Kernel size |
PL |
FC layers |
Loss function |
Reference CNN |
|
[21] |
Private |
300 |
Biometric Identification |
55×67×1 |
4 |
7×7 |
2 |
2 |
Mean square error |
- |
|
[22] |
Private SDUMLA |
318 636 |
Biometric Verification |
224×224×3 |
13 |
3×3 |
5 |
3 |
softmax |
VGG-16 |
|
[23] |
Private FVRC2016 |
300 1000 |
Biometric Verification |
128×128×2 |
10 |
3×3 |
4 |
2 |
Cross entropy error |
VGG-16 |
|
[24] |
Private |
300 |
PAD - Inkjet printed artefact |
224×224×3 |
8 |
11×11 3×3 5×5 |
3 |
2+3 |
softmax |
Alex-Net |
|
[25] |
FV-USM HKPU |
492 302 |
Finger-vein image quality assessment |
80×240×1 |
4 |
3×3 5×5 |
2 |
2 |
softmax |
- |
|
[26] |
FV-USM HKPU |
492 302 |
Finger-vein segmentation and recovery |
15×15×1 39×146×1 |
3 2 |
3×3 5×5 9×9 5×5 |
2 0 |
2 1 |
Mean square error softmax |
- |
|
[27] |
HKPU FV-USM SDUMLA UTFVP |
210 492 636 360 |
Finger-vein Identification |
65×153×1 |
5 |
5×5 |
3 |
1 |
softmax |
- |
Note: C=Finger classes, CL=Conv layer, PL=Pooling layers
There are three well-defined and practical ways to use deep learning for finger vein recognition. First, utilize a deep learning method for finger vein pattern extraction and compare templates for a vein pattern in the image to be able to determine whether it is accurate. Second, a new feature extraction algorithm is applied to find the fingertip print, which is then used as the basis for the deep learning algorithm. In the end, the processing method could directly identify the original picture of the finger veins by using deep learning.
Parts of our two-stream approach can be applied to all types of deep learning due to the third technique, which uses an end-to-end architecture that enables it to maximize the benefits. To the best of our knowledge, no progress has been made on merging CNNs. This is a challenge while collaborating with CNN since sufficient criteria need to be found to yield the best recognition levels. By this method, we started a series of experiments where we constantly increased a single variable until it reached the point where it was completely saturated and then checked the response of the system. To keep the number of tests below three critical parameters, we selected three parameters first. We looked for an activation mechanism that produced the highest possible accuracy. We checked until we found a suitable filter size, and lastly, we found the number of CNN layers that would work. To create the received model, the CNN design was combined with the combined architecture and the rest of the network's architecture. As it turns out, our approach was comparable to all of the approaches that were evaluated in Table 1.
3.1 Image acquisition
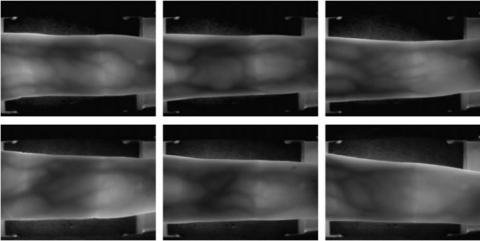
In this research, we utilized an available finger vein database named DUMLA-HMT. This dataset was constructed based on the computer designed by the Joint Lab for Wuhan University's Intelligent Computing and Systems, an ICT School lab within the WU that has gained a strong reputation. This dataset includes images of each person's hands: one has an index finger, the other has his middle finger, and the third hand is shown by the applicant. One information value is obtained six times to expand into a collection of six information images for each of the fingers, which works out to be six times more efficient. This database of finger veins consists of 6×6×106=3,816 images and each image has been stored in "BMP" format in 320×240 pixels size. Some sample images are shown in Figure 1 [28].
Figure 1. Sample images of finger vein dataset
3.2 Convolutional neural network (CNN)
A traditional approach to machine learning revolves around layer-by-layering, which is the idea of training successive layers of the network. Same as traditional machine learning, deep learning is a concept in machine learning that is focused on the notion of building successive layers of abstract representations. This type of hierarchical representation provides an opportunity for training data to be used for understanding and building concepts [28]. In practice, most methods of machine learning use two or three layers of neurons, whereas deep learning utilizes hundreds of layers. One of the most robust deep learning methods widely used in the literature is CNN. The CNNs are implemented to differentiate among various classes by producing such a vector of probabilities that are indicated by $\hat{y}=f(x)$ for all evaluated images in the dataset. If y is the true label of image x, the CNN performance of true label y of image x is measured by a loss function $l y(\hat{y}) \in R$ which assigns a penalty to classification errors.
3.2.1 Deep learning using convolutional neural network (CNN) mechanisms
The convolutional layer can convolve the outcome of the former layer with a group of earnable filters, where the convolution filter can be specified based on weights. This results in a more accurate filter classification per filter in the volume. Their volume height and width vary from filter to filter, producing a 2-dimensional activation chart. Similarly, the depth of the input is the same with both of the filters [29]. Three hyperparameters govern the size of the overall performance. The number of levels and the model's stride can be defined with the width, and zero padding can be adjusted separately.
Assume that we have some N×N square neuron layer which is followed by the convolutional layer of our layer. If we utilize an m×m filter with ω, the convolutional layer will be of size (N-m+1). To calculate the pre-nonlinearity input to some unit $x_{i j}^{\ell}$ our layer, we need to sum up the contributions (weighted by the filter components) from the former layer cells (See Eq. (1)):
$x_{i j}^{\ell}=\sum_{a=0}^{m-1} \sum_{b=0}^{n-1} w_{a b} y_{(i+a)(j+b)}^{l-1}$ (1)
After that, the convolutional layer implements its nonlinearity using Eq. (2):
$y_{i j}^{\ell}=\sigma\left(x_{i j}^{\ell}\right)$ (2)
The pooling layer works by reducing the size of the total input as well as the number of inputs, so multi-scale analysis is possible. Both operators, maxpooling and average pooling, are the two most commonly used pooling operators. Using these operators, the maximum or average value of a small block of data is found within a spatial entity. Pooling filters are considered the optimal filters based on their size 2×2 as well as their stride of 2. Eventually, all neurons of the former layer will be completely linked and bound to one another based on a fully connected layer. In addition, fully connected layers are usually used as the last classifier in a network, and they are often mostly used as decision classifiers.
3.2.2 Attention learning mechanisms
The attention keyword represents an action that guides directly to the object, has specific aims, and focuses attention. It can be known as giving need as it is the mind's ability to assign uneven consideration through the area of sensation. Furthermore, concentration confirms input to the center of attention while diminishing or ignoring others.
Technically, the attention given to the current activity has helped find the value of the system in the neural networks. The action of paying attention assists in terms of credit assignment. The key challenge of that action is ensuring that the range across which it applies is reliable and durable. A way of putting it is that the prediction has become stronger and more influenced by the other facts. The central Markov assumption is used to be employed in the attention network's Markov model to allow various likelihood values for different choices in the set of all possible states of the network (see Eq. (3)).
$P\left(w_1 w_2 \ldots w_n\right) \approx \prod_i P\left(w_i \mid w_{i-k} \ldots w_{i-1}\right)$ (3)
In other words, at a high level, the attention network has the capability of highlighting important information in the input and suppressing extraneous noise for the sake of the neural network's analysis. This means that it is concentrated on more relevant parts of the input instead of irrelevant parts during the prediction task. Although this attention network does make it possible to gather knowledge at the human level, in this situation, attention is required. Thus, the attention network described in this case may catch the nature of the input series in a single hidden state.
Here, the pre activation residual has been modified. The output of attention module H is given using Eq. (4):
$H_{i, c}=M_{i, c}(x) \times T_{i, c}(x)$ (4)
where, ranges are the overall spatial locations and the channel index. It is possible to train the entire structure end-to-end. When it comes to backward propagation, the focus filter can not only act as a feature selector but can also be used as a part of the step-size control mechanism. In the soft mask section, the gradient of the mask for the input feature can be calculated using Eq. (5):
$\frac{\partial M(x, \theta) T(x, \theta)}{\partial \phi}=M(x, \theta) \frac{\partial T(x, \theta)}{\partial \phi}$ (5)
where, the $\theta$ is the mask section parameters and the N is the trunk section parameters. Attention Modules could be powerful against noise labels due to this property. The branches of the mask can prevent incorrect gradients (from noisy labels) to update trunk parameters.
Similarly, if it can establish a soft mask unit with identical mapping, the performance should not be worse than that of its counterpart without attention, according to the opinion in residual learning. Therefore, the output of the attention module has been modified using Eq. (6).
$H_{i, c}(x)=\left(1+M_{i, c}(x)\right) \times F_{i, c}(x)$ (6)
where, M(x) ranges from [0, 1], with M(x) approximating 0, H(x) will approximate original features F(x). Thus, this approach can be named as attention to residual learning.
3.3 Proposed method
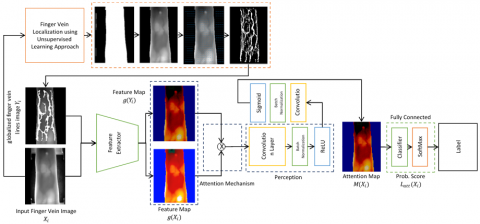
Many authors provided many methods for detecting and identifying the finger and palm veins, which have been described in Table 1. This work proposed a model of finger vein image identification and verification based on a deep regional learning (DRL) approach using an attention mechanisms (AM) model, shown in Figure 2. It mainly has three different major phases. The first phase is the globalized finger vein lines image construction based on the Globalized Finger Vein Lines Extraction Based (GMFPI) method. In this stage, we used our second model of double stages of feature extraction-based GFPMI for colored finger vein identification [30, 31] to automatically generate a perfect globalized finger vein line image that will be used for the next stage. The next stage is the feature extractor, which uses a convolutional neural network to extract the main feature map using the original finger vein images. The third stage uses the attention mechanisms by using the two generated maps (original and globalized line feature maps) to generate the final deep attention features map that will be used for the final stage, which is the classification stage.
Figure 2. Deep regional learning approach-based attention mechanisms model proposed system
3.3.1 Globalized finger vein lines image constriction-based (GMFPI)
This stage has been proposed in our second model of double phases of feature extraction using GFPMI for colored finger vein detection [31, 32].
Figure 3. (a) Original finger vein image, (b) localized finger vein image mask, (c) localized finger vein image, (d) gmpi map, (e) projected gmpi on the orginal finger vein image, (f) extracted finger vein lines, (g) localized grayscale featured finger vein image, (h) localized colored featured finger vein image
It has many steps; our first model proposed a method based on using unsupervised learning based on an optimized k-means clustering approach to generate a perfect localized binary image mask, which will be used later for the next step, as is shown in Figure 3 (b). Based on the localized binary mask, the localized finger vein image is generated, as shown in Figure 3 (c). The second step is the localized finger vein feature extraction. In this step, the finger vein lines are extracted based on the proposed globalized finger map as shown in Figure 3 (d), and they are projected onto the localized finger vein image as shown in Figure 3 (e). Finally, the finger vein feature extraction model based on the globalized feature orientation map is used to extract the finger vein lines, as shown in Figure 3 (f). The extracted finger vein lines were projected onto different finger vein image versions (grayscale and color) generated previously by our second model [31], as shown in Figures 3 (g) and (h), respectively.
3.3.2 Deep regional learning model
In our proposed model, we have eight differentiable layers of varying weights; the first five of these are considered convolutional, and the remaining layers are fully connected. The last completely connected layer of the network outputs values, which are fed to a 2-way softmax layer, which generates a probability allocation for the two-class labels. The statistical models we have developed make our network fully use the multinomial logistic regression goal, which is equal to increasing the average through cases of training of the log probability of the right label under the allocation of prediction. In the former, the kernels of the second, fourth, and fifth layers are not related to each other, and hence only the kernels of the next and subsequent layers are involved.
In the third and second convolutional layers, all kernel maps are connected. Moreover, neurons in fully connected layers and former layers are connected. The first and second layers of convolutional neural networks are followed by response-normalization layers. The max-pooling layer has been followed by both the fifth convolutional and response-normalization layers, which choose both response-normalized and pooled as input, and the first convolutional layer with filters based on 256 kernels in 5×5×48 sizes. Furthermore, the same thing was implemented on the third, fourth, and fifth layers. The nonlinearity of ReLU is implemented in the results produced by fully connected as well as convolutional layers. The first convolution layer performs a filtering operation with 96 convolution kernels of 11×11×3 with a stride of 4 pixels on the 227×227×3 input image. This is the number of neurons that are further apart from one another than they need to allow for more signal overlap to detect targets in a kernel. The second convolutional layer is connected to other convolutional layers without any intervention in both layers' pooling and normalization. The third convolutional layer consists of 384 kernels, and it is linked to the second convolutional layer outputs, which are based on normalized and pooled layers with a size of 3×3×256. The number of fourth and fifth convolutional layers is 384 and 256 kernels, with a size of 3×3×192 and 3×3×192, respectively. Finally, each fully connected layer has 4096 different neurons. The whole structure of our Deep Regional Learning Approach-based Attention Mechanisms Model is described in Table 2.
Table 2. Deep regional learning model structure description
|
Layer Number |
Layer Type |
Kernel |
Size |
Layer Number |
Layer Type |
Kernel |
Size |
|
I1 |
Image Input |
- |
227×227×3 |
C5 |
Convolution |
256 |
3x3x192 |
|
C1 |
Convolution |
96 |
11×11×3 |
R5 |
ReLU |
- |
- |
|
R1 |
ReLU |
- |
- |
A5 |
Attention Model |
1 |
- |
|
A1 |
Attention Model |
1 |
- |
P6 |
Max Pooling |
1 |
3x3 |
|
N1 |
Normalization |
- |
- |
F7 |
Fully Connected |
1 |
4096 |
|
P1 |
Max Pooling |
1 |
3×3 |
R7 |
ReLU |
- |
- |
|
C2 |
Convolution |
256 |
5×5×48 |
A7 |
Attention Model |
1 |
- |
|
R2 |
ReLU |
- |
- |
D7 |
Dropout |
- |
- |
|
A2 |
Attention Model |
1 |
- |
F8 |
Fully Connected |
1 |
4096 |
|
N2 |
Normalization |
- |
- |
R8 |
ReLU |
- |
- |
|
P2 |
Max Pooling |
1 |
3×3 |
A8 |
Attention Model |
1 |
- |
|
C3 |
Convolution |
384 |
3×3×256 |
D8 |
Dropout |
- |
- |
|
R3 |
ReLU |
- |
- |
F9 |
Fully Connected |
1 |
4096 |
|
A3 |
Attention Model |
1 |
- |
R9 |
ReLU |
- |
- |
|
C4 |
Convolution |
384 |
3×3×192 |
A9 |
Attention Model |
1 |
- |
|
R4 |
ReLU |
- |
- |
D9 |
Dropout |
- |
- |
|
A4 |
Attention Model |
1 |
- |
|
|
|
|
The designed network has an input layer (I1) that has an input size of 227×227×3. The image normalization process is applied to each input. The second layer of our design is (C1), which is the first convolutional layer with a kernel size of 11×11×3 using 96 kernels with stride [4 4], padding [0 0 0 0]. The third layer is the R1, which is the ReLU. The fourth layer is the attention layer (A1). The fifth layer in our design is the normalization layer, followed by the sixth layer, which is P1. P1 is the first pooling layer in our design, with a 3x3 kernel size, stride [2 2], and padding [0 0 0 0]. The next layer (seventh layer) is C2, which is the second convolutional layer. This layer contains 256 kernels, each with a size of 5x5x48 and stride [1 1], as well as padding [2 2 2 2]. The next layer is R2, which is the second ReLU. The design is followed by A2, which is the ninth layer. The ninth layer is the second attention layer, followed by the normalization layer (N2) and max pooling (P2) with a 3x3 kernel size, stride [2 2], and padding [0 0 0 0]. C3, C4, and C5 are the next three convolutional layers, with 384, 384, and 256 kernels, respectively, using 3x3x256, 3x3x192, and 3x3x192 kernel sizes. Both are used with stride [1 1] and padding [2 2 2 2]. The convolutional and max-pooling layers are both followed by the ReLU and Attention Model layers. The last max-pooling layer is P6, which is used with a 3x3 kernel size, stride [2 2], and padding [0 0 0 0]. Finally, the fully connected layer with a feature size of 4096 is followed by the response layer (R7), response locality unit (ReLU), and attention layer (A8). A dropout of 50% is used with ReLU (D8). Another fully connected layer (F9) is used with the ReLU, Attention, and Dropout layers.
3.3.3 Deep attention model for globalized finger vein feature map extraction and classification
The stacked of residual learning differs from our attention residual learning [31]. The residual learning of original ResNet is performed using Eq. (7):
$H_{i, c}(x)=x+F_{i, c}(x)$ (7)
Approximates the residual function, in our formulation, Fi,c(x) represents the features that are extracted based on deep convolutional networks. The key lies in our mask branches M(x). They work as feature selectors that improve features and eliminate noises from trunk features.
4.1 Dataset
To evaluate the proposed model, we use the SDUMLA-HMT [29] finger vein dataset. In training, a set of images is selected, then they are divided into five different folds. The set of all folds is equal to that randomly selected. Only one-fold is withheld for the validation step. In the training and testing steps, the same folds are utilized to train classifiers, where, based on the result of voting among all classifiers of each fold, the classifier with the best performance is selected. In Table 3, the dataset distribution based on training, validation, and testing datasets is given in Table 3.
Table 3. Total number of subject and finger vein images in the training and testing dataset
|
Subjects |
Total |
Training (80%) |
Testing (20%) |
|
|
Training (60%) |
Validation (20%) |
|||
|
10 |
360 |
216 |
72 |
27 |
4.2 Performance results of training dataset
In the evaluation, we use the results of experiments on accuracy and validation assessments to compare the classification methods. Confusion matrix to see if the classification method validates the findings. A confusion matrix for the identification system is known as an m × m matrix, where m indicates the class number. Information about both classifications is predicted as well as actualized within the confusion matrix, which is done by an identification system. The performance of these models is typically evaluated using the matrix's existing data. The predicted class in the matrix is represented by the column, whereas the actual class is represented by the row in the matrix. Classes that have been correctly or incorrectly classified can be shown based on the confusion matrix.
The evaluation of performance is computed by utilizing three different measurements: recognition rate (RR), precision (PR), sensitivity (SE), and specificity (SP) [32]. The results of the performance evaluation of the proposed system (Deep Regional Learning Approach-Based Attention Mechanisms Model for Finger Vein Human Image Recognition and Identification) for the training dataset Our original localized finger vein image dataset achieves the highest accuracy (100%) compared with the original finger vein image dataset (without localization).
The convergence of the model was achieved by using a sigmoid loss function throughout the training process, with the goal being to achieve the lowest possible global loss. To achieve faster convergence, the loss function was minimized using the Adam optimizer with a learning rate of 0.0001. During the training process, a batch size of 32 was utilized, and 64 epochs were utilized in total. When the network hyperparameters have been tuned and saturation has been reached in both training and validation losses, it is imperative that the training of the model be terminated at this time. To do this, we utilized a method known as early stopping, in which the training was terminated at the point where it was determined that there would be no more improvements to the loss of validation data in comparison to the training epochs. Tables 4 to 7 present an illustration of the generalized learning curves produced by the proposed model when applied to the training dataset. Even though the training epoch was set to 64. At this moment, training ended, and the model eventually grew resistant to overfitting as a result of intensive training. Additionally, it can be noticed that the model offered extremely high convergence in the loss function for the identification of the vein images.
Table 4 shows the experimental results of the finger vein identification-based deep learning model using our localized finger vein image dataset. We can notice that the highest score has been achieved based on using 64 epochs and 500-learning patch size.
Table 5 shows the experimental results of the finger vein identification-based deep learning model using the original finger vein image dataset (without localization). We have used different epochs for the original images (8, 16, 32, and 64). The proposed model obtained the lowest accuracy for epoch 16. However, it is obvious that the highest score has been achieved based on using 64 epochs and 500 learning patch sizes.
Table 6 shows the experimental results of the finger vein identification-based deep learning model using the localized feature extraction finger vein image dataset (gray localized localization approach). The proposed model achieved the lowest score at epochs 64 and 32. However, a good score is obtained at epoch 8. We can notice that the highest score was 100%, which was achieved based on using 16 epochs and 100 learning patch sizes.
Table 4. Performance results on training dataset using our localized finger vein image dataset
|
Model |
Epoch |
Patch Size |
Learning Rate |
Ac |
|
Localized Finger Vein Image Dataset |
64 |
20 |
0.0001 |
70.00 |
|
40 |
74.55 |
|||
|
100 |
91.82 |
|||
|
200 |
93.64 |
|||
|
500 |
100 |
|||
|
32 |
20 |
0.0001 |
75.45 |
|
|
40 |
87.27 |
|||
|
100 |
98.18 |
|||
|
200 |
99.09 |
|||
|
500 |
98.18 |
|||
|
Localized Finger Vein Image Dataset |
16 |
20 |
0.0001 |
96.36 |
|
40 |
98.18 |
|||
|
100 |
100 |
|||
|
200 |
100 |
|||
|
500 |
100 |
|||
|
8 |
20 |
0.0001 |
96.36 |
|
|
40 |
99.09 |
|||
|
100 |
100 |
|||
|
200 |
100 |
|||
|
500 |
100 |
Table 5. Performance results on training dataset using our original finger vein image dataset
|
Model |
Epoch |
Patch Size |
Learning Rate |
Ac |
|
Original |
64 |
20 |
0.0001 |
70.00 |
|
40 |
74.55 |
|||
|
100 |
91.82 |
|||
|
200 |
93.64 |
|||
|
500 |
100 |
|||
|
32 |
20 |
0.0001 |
75.45 |
|
|
40 |
87.27 |
|||
|
100 |
98.18 |
|||
|
200 |
99.09 |
|||
|
500 |
98.18 |
|||
|
Original |
16 |
20 |
0.0001 |
79.09 |
|
40 |
80.91 |
|||
|
100 |
99.09 |
|||
|
200 |
99.09 |
|||
|
500 |
96.36 |
|||
|
8 |
20 |
0.0001 |
91.82 |
|
|
40 |
93.64 |
|||
|
100 |
100 |
|||
|
200 |
100 |
|||
|
500 |
100 |
Table 6. Performance Results on Training Dataset using our localized grayscale featured finger vein image dataset
|
Model |
Epoch |
Patch Size |
Learning Rate |
Ac |
|
Localized Feature Extraction (Gray) |
64 |
20 |
0.0001 |
67.27 |
|
40 |
71.82 |
|||
|
100 |
90.00 |
|||
|
200 |
91.82 |
|||
|
500 |
91.82 |
|||
|
32 |
20 |
0.0001 |
75.45 |
|
|
40 |
80.00 |
|||
|
100 |
96.36 |
|||
|
200 |
94.55 |
|||
|
500 |
93.64 |
|||
|
Localized Feature Extraction (Gray) |
16 |
20 |
0.0001 |
76.36 |
|
40 |
90.00 |
|||
|
100 |
100 |
|||
|
200 |
100 |
|||
|
500 |
100 |
|||
|
8 |
20 |
0.0001 |
90.19 |
|
|
40 |
85.45 |
|||
|
100 |
97.27 |
|||
|
200 |
96.36 |
|||
|
500 |
99.09 |
Table 7. Performance results on training dataset using our localized colored featured finger vein image dataset
|
Model |
Epoch |
Patch Size |
Learning Rate |
Ac |
|
Localized Feature Extraction (Gray) |
64 |
20 |
0.0001 |
66.36 |
|
40 |
86.36 |
|||
|
100 |
97.27 |
|||
|
200 |
98.18 |
|||
|
500 |
99.09 |
|||
|
32 |
20 |
0.0001 |
83.64 |
|
|
40 |
96.36 |
|||
|
100 |
95.45 |
|||
|
200 |
95.45 |
|||
|
500 |
96.36 |
|||
|
Localized Feature Extraction (Gray) |
16 |
20 |
0.0001 |
94.55 |
|
40 |
97.27 |
|||
|
100 |
100 |
|||
|
200 |
94.55 |
|||
|
500 |
94.55 |
|||
|
8 |
20 |
0.0001 |
94.55 |
|
|
40 |
95.45 |
|||
|
100 |
98.18 |
|||
|
200 |
95.45 |
|||
|
500 |
98.18 |
Table 7 shows the experimental results of the finger vein identification-based deep learning model using the localized colored feature extraction finger vein image dataset (colored localized localization approach). We can also notice that the highest score was 100%, which was achieved based on using 16 epochs and 100 learning patch sizes.
4.3 Performance results of testing dataset
The performance results of the proposed system on the testing dataset using the original finger vein image dataset are shown in Table 8. The performance results show that on the original dataset, the proposed system achieves the highest accuracy of 100% and also 100% on precision, recall, and F1 Score. The experiential results of the testing dataset for all the classes using different parameters such as epoch and patch size are shown in Table 7. For instance, (epoch 8, patch size 100), (epoch 16, patch size 100), (epoch 32, patch size 100), and (epoch 64, patch size 100) all achieved the higher accuracy of 100%. Using the original dataset.
The performance results of the proposed system on the testing dataset using the localized finger vein image dataset are shown in Table 9. The performance results show the proposed system achieves the highest accuracy of 100% and higher performance on precision, recall, and F1 score. The experiential results of the testing dataset for all the classes using different parameters such as epoch and patch size are shown in Table 8. For instance, epoch 16 with patch size 100 and epoch 64 with patch size 500 both achieved a higher accuracy of 100%.
The performance results of the proposed system on the testing dataset using the localized gray features on the finger vein image dataset are shown in Table 10. The performance results show the proposed system achieves the highest accuracy of 100% and higher performance on precision, recall, and F1 score. The experiential results of the testing dataset on all the classes using different parameters such as epoch and patch. For instance, (epoch 16, patch size 100) has achieved a higher accuracy of 100%. The performance results of the proposed system on the testing dataset using the localized colored feature finger vein image dataset are shown in Table 10.
Table 8. Performance Results on the Testing Dataset using the original of finger vein images dataset
|
Model |
Epoch |
Patch Size |
Accuracy |
Precision |
Recall |
F1 Score |
Model |
Epoch |
Patch Size |
Accuracy |
Precision |
Recall |
F1 Score |
|
Original |
8 |
20 |
99.27 |
96.4 |
96.7 |
96.3 |
Original |
32 |
20 |
99 |
95.5 |
96.5 |
95.4 |
|
40 |
99.82 |
99.1 |
99.2 |
99.1 |
40 |
99 |
93.7 |
95.3 |
93.4 |
||||
|
100 |
100 |
100 |
100 |
100 |
100 |
100 |
100 |
100 |
100 |
||||
|
16 |
20 |
99.27 |
96.4 |
97.3 |
98.5 |
64 |
20 |
94 |
74.7 |
77.8 |
72.1 |
||
|
40 |
99.45 |
98.2 |
95.8 |
98.2 |
40 |
98 |
94.6 |
95.8 |
94.6 |
||||
|
100 |
100 |
100 |
100 |
100 |
100 |
100 |
100 |
100 |
0.00 |
Table 9. Performance Results on the Testing Dataset using the localized of finger vein images dataset
|
Model |
Epoch |
Patch Size |
Accuracy |
Precision |
Recall |
F1 Score |
Model |
Epoch |
Patch Size |
Accuracy |
Precision |
Recall |
F1 Score |
|
Localized Finger Vein Images |
16 |
20 |
95.82 |
79.1 |
81.3 |
77.8 |
Localized Finger Vein Images |
32 |
200 |
99.8 |
100 |
99.2 |
98.6 |
|
40 |
95.28 |
82.8 |
88.5 |
79.0 |
500 |
99.6 |
98.2 |
98.5 |
98.2 |
||||
|
100 |
100 |
100 |
100 |
100 |
64 |
20 |
94 |
69.9 |
80.6 |
67.8 |
|||
|
200 |
99.27 |
96.4 |
96.8 |
96.4 |
40 |
94.9 |
74.5 |
83.3 |
71.9 |
||||
|
500 |
99.27 |
96.4 |
96.4 |
96.6 |
100 |
98.3 |
91.9 |
93.3 |
91.7 |
||||
|
32 |
20 |
95.09 |
75.5 |
79.8 |
74.7 |
200 |
98.7 |
93.7 |
95.3 |
93.4 |
|||
|
40 |
97.30 |
86.8 |
90.2 |
85.1 |
500 |
100 |
100 |
100 |
100 |
||||
|
100 |
100 |
98.2 |
98.4 |
98.2 |
Table 10. Performance Results on the Testing Dataset using the localized grayscaled feature of the finger vein images dataset
|
Model |
Epoch |
Patch Size |
Accuracy |
Precision |
Recall |
F1 Score |
Model |
Epoch |
Patch Size |
Accuracy |
Precision |
Recall |
F1 Score |
|
localized grayscale feature |
8 |
20 |
98.18 |
91 |
92.6 |
91 |
localized grayscale featured |
32 |
40 |
95.09 |
75.6 |
76.2 |
74.3 |
|
40 |
99.27 |
96.4 |
96.7 |
96.4 |
100 |
99.2 |
96.5 |
97.1 |
96.4 |
||||
|
200 |
99.82 |
99.1 |
99.2 |
99.1 |
200 |
98.9 |
94.6 |
95.2 |
94.4 |
||||
|
16 |
20 |
99.82 |
99.1 |
99.2 |
99.1 |
500 |
98.7 |
93.7 |
94.3 |
93.7 |
|||
|
40 |
98. |
90.1 |
92.1 |
89.7 |
64 |
100 |
98 |
90 |
91.3 |
89.3 |
|||
|
100 |
100 |
100 |
100 |
100 |
200 |
98.5 |
92.8 |
94.1 |
92.4 |
||||
|
32 |
20 |
95.09 |
75.6 |
76.2 |
74.3 |
500 |
98.3 |
91.8 |
93.1 |
91.2 |
After the training of the network was completed without a hitch, the test set was utilized to conduct a performance assessment of the proposed model for finger vein identification. As mentioned before, a variety of images from each class were selected for the purposes of testing to show the proposed model's performance in terms of recognition. Original finger vein images, localized finger vein images, a localized grayscale feature of the finger vein images, and a localized colored feature of finger vein images are used in testing. During the process of evaluating the proposed model, preprocessed data from test images from each data set was utilized as input to the proposed model so that corresponding probability scores could be obtained. Tables 8 to 11 compare the recognition accuracy, precision, recall, and F1-score produced by the proposed model to other given findings based on the application of a variety of epochs and patch sizes. We can see that, for original finger vein images, the proposed method obtained 100% accuracy in epochs 8, 16, 32, and 64 at patch size 100. Our proposed model obtained good accuracy for the localized finger vein images dataset. For this dataset, we witnessed the lowest accuracy of 94% obtained at epoch 64 with patch size 20, whereas epoch 64 obtained 100% at epoch 500. Moreover, we have achieved 100% accuracy at epochs 16 and 32 at patch size 100. Furthermore, our proposed model achieved 99.82% accuracy for epoch 8 at patch size 200, 99.2% accuracy for epoch 32 at patch size 100, and 98.5% accuracy for epoch 64 at patch size 200 for the localized grayscale features of the finger vein images. For epoch 16 with patch size 100, the proposed model achieved 100% greater accuracy. Moreover, the proposed model has been evaluated using a localized colored feature of finger vein images. This dataset has the lowest accuracy of 96.7% using 32 epochs with 20. We scored a higher accuracy of 99.8% for this dataset at epoch 16 with patch size 100.
The accuracy of the proposed technique is greater for both the original finger vein image and the localized finger vein image datasets. This is due to the fact that the method makes its best attempt to capture the feature information of the finger vein as much as possible. However, the localized grayscale feature of the finger vein image and the localized colored feature of the finger vein image datasets are both slightly lower. In addition to this, due to the nature of the vein patterns that are associated with low-quality images, which are highly vague, the network of feature extraction of the existing models is unable to extract distinctive features from these vein patterns, making it extremely challenging to achieve higher recognition accuracy. This is because the vein patterns are extremely vague. Besides, the proposed model has a feature extraction network that is able to capture huge and ambiguous instances of the input by making use of much bigger kernels in the main layers. Because of this, it is possible to realize a notable accumulation of features at the final layer, which is sufficient to properly identify every sample, whatever the visual quality of the sample. In addition, as mentioned, the incorporation of the proposed model makes it possible for the network to capture the fundamental textural vein patterns regardless of the size of the veins, which greatly contributes to an improvement in recognition accuracy.
Table 11. Performance Results on the Testing Dataset using the localized colored feature of finger vein images dataset
|
Model |
Epoche |
Patch Size |
Accuracy |
Precision |
Recall |
F1 Score |
Model |
Epoche |
Patch Size |
Accuracy |
Precision |
Recall |
F1 Score |
|
Localized Colored Feature Finger Vein Images |
8 |
20 |
98.91 |
94.6 |
95.2 |
94.5 |
Localized Colored Feature Finger Vein Images |
32 |
20 |
96.7 |
83.7 |
85.7 |
82.4 |
|
40 |
98.91 |
94.6 |
95.4 |
94.6 |
40 |
99.2 |
96.4 |
96.7 |
96.3 |
||||
|
100 |
99.45 |
97.3 |
97.6 |
97.2 |
100 |
99 |
95.5 |
95.8 |
95.5 |
||||
|
200 |
99.09 |
91.9 |
96.4 |
95.4 |
200 |
99 |
95.5 |
96.3 |
95.4 |
||||
|
500 |
99.64 |
98.2 |
98.3 |
98.2 |
500 |
99 |
95.5 |
96.3 |
95.4 |
||||
|
16 |
20 |
99.64 |
98.2 |
98.3 |
98.2 |
64 |
20 |
98.3 |
91.8 |
93.1 |
91.2 |
||
|
40 |
99.45 |
97.3 |
97.7 |
97.3 |
40 |
98.9 |
92.4 |
93.7 |
91.8 |
||||
|
100 |
99.8 |
98.2 |
98.5 |
98.2 |
100 |
98.5 |
92.8 |
94.1 |
92.4 |
||||
|
200 |
99.8 |
98.2 |
98.5 |
98.2 |
200 |
98.8 |
93.1 |
94.4 |
92.7 |
||||
|
500 |
98.9 |
94.9 |
95.4 |
94.5 |
500 |
99.1 |
92.6 |
93.9 |
92 |
In this paper, we describe the design of a deep regional learning approach-based attention learning mechanism for finger vein image identification and recognition. The designed model is based on using attention mechanisms in an innovative way. The regular Attention Mechanisms framework is used to fine-tune the backpropagated synthesis in a regular deep network. Instead of that, we used the attention mechanisms to fine-tune both feedforward and backward-propagated synthesis in the same deep network by using a regional mask to obtain the ROI learning area. The proposed approach shows significant performance when applied to one of the most challenging finger vein datasets. The experimental results of the proposed system show that our approach has achieved the highest accuracy on the testing dataset in most cases using different versions of finger vein image datasets that are generated using our proposed approach, including the original, localized, localized grayscale-featured, and localized colored-featured finger vein images.
As is the case with any new approach, there are some problems that remain unsolved and should be given more thought. For the particular development of the proposed model, we present a feature extraction method to extract image information, and we were successful in achieving our goals regarding performance. However, more exploration in future research is required to extract more effective information from images. A significant amount of training data is necessary in order to effectively train the model that has been presented. Nevertheless, it is frequently the case that it will be impossible to acquire this quantity of data in many of the experimental setups that are used. As a result, the expansion of training data through the incorporation of proper data augmentation is scheduled to take place in future work. In addition, the approach that was proposed will be used to analyze various kinds of vein images, such as palm-vein or hand-vein images, and their results will be analyzed. Furthermore, we will undertake a study on the multi-modal combining of various types of biometric data using the approach that was proposed in this research.
[1] Rui, Z., Yan, Z. (2018). A survey on biometric authentication: Toward secure and privacy-preserving identification. IEEE Access, 7: 5994-6009. https://doi.org/10.1109/ACCESS.2018.2889996
[2] Jain, A., Kumar, A. (2012). Biometric recognition: An overview second generation biometrics: the ethical, legal and social context, E. Mordini and D. Tzovaras, pp. 49-79.
[3] Dargan, S., Kumar, M. (2020). A comprehensive survey on the biometric recognition systems based on physiological and behavioral modalities. Expert Systems with Applications, 143: 113114. https://doi.org/10.1016/j.eswa.2019.113114
[4] Yang, W., Wang, S., Hu, J., Zheng, G., Valli, C. (2019). Security and accuracy of fingerprint-based biometrics: A review. Symmetry, 11(2): 141. https://doi.org/10.3390/sym11020141
[5] Zhou, X., Zhou, K., Shen, L. (2020). Rotation and translation invariant palmprint recognition with biologically inspired transform. IEEE Access, 8: 80097-80119. https://doi.org/10.1109/ACCESS.2020.2990736
[6] Rathore, A.S., Li, Z., Zhu, W., Jin, Z., Xu, W. (2020). A survey on heart biometrics. ACM Computing Surveys (CSUR), 53(6): 1-38. https://doi.org/10.1145/3410158
[7] Damaševičius, R., Maskeliūnas, R., Kazanavičius, E., Woźniak, M. (2018). Combining cryptography with EEG biometrics. Computational Intelligence and Neuroscience, 2018: 1867548. https://doi.org/10.1155/2018/1867548
[8] Camalan, S., Sengul, G., Misra, S., Maskeliunas, R., Damaševičius, R. (2018). Gender detection using 3d anthropometric measurements by kinect. Metrology and Measurement Systems, 25(2): 253-267. https://doi.org/10.24425/119568
[9] Kortli, Y., Jridi, M., Al Falou, A., Atri, M. (2020). Face recognition systems: A survey. Sensors, 20(2): 342. https://doi.org/10.3390/s20020342
[10] Ma, L., Tan, T., Wang, Y., Zhang, D. (2003). Personal identification based on iris texture analysis. IEEE Transactions on Pattern Analysis and Machine Intelligence, 25(12): 1519-1533. https://doi.org/10.1109/TPAMI.2003.1251145
[11] Olanrewaju, L., Oyebiyi, O., Misra, S., Maskeliunas, R., Damasevicius, R. (2020). Secure ear biometrics using circular kernel principal component analysis, Chebyshev transform hashing, and Bose–Chaudhuri–Hocquenghem error-correcting codes. Signal, Image and Video Processing, 14(5): 847-855. https://doi.org/10.1007/s11760-019-01609-y
[12] Kono, M., Ueki, H., Umemura, S.I. (2002). Near-infrared finger vein patterns for personal identification. Applied Optics, 41(35): 7429-7436. https://doi.org/10.1364/AO.41.007429
[13] Himaga, M., Ogata, H. (2020). Evolution of finger vein biometric devices in terms of usability. In Handbook of Vascular Biometrics, pp. 159-177.
[14] Akintoye, K.A., Rahim, M.S.M., Abdullah, A.H. (2018). Challenges of finger vein verification system: A theoretical perspective. Advanced Science Letters, 24(5): 3602-3608. https://doi.org/10.1166/asl.2018.11445
[15] Kapoor, K., Rani, S., Kumar, M., Chopra, V., Brar, G.S. (2021). Hybrid local phase quantization and grey wolf optimization based SVM for finger vein recognition. Multimedia Tools and Applications, 80(10): 15233-15271. https://doi.org/10.1007/s11042-021-10548-1
[16] Rida, I., Al-Maadeed, N., Al-Maadeed, S., Bakshi, S. (2020). A comprehensive overview of feature representation for biometric recognition. Multimedia Tools and Applications, 79(7): 4867-4890. https://doi.org/10.1007/s11042-018-6808-5
[17] Shaheed, K., Liu, H., Yang, G., Qureshi, I., Gou, J., Yin, Y. (2018). A systematic review of finger vein recognition techniques. Information, 9(9): 213. https://doi.org/10.3390/info9090213
[18] Sundararajan, K., Woodard, D.L. (2018). Deep learning for biometrics: A survey. ACM Computing Surveys (CSUR), 51(3): 1-34. https://doi.org/10.1145/3190618
[19] Lu, Y., Xie, S., Wu, S. (2019). Exploring competitive features using deep convolutional neural network for finger vein recognition. IEEE Access, 7: 35113-35123. https://doi.org/10.1109/ACCESS.2019.2902429
[20] Fairuz, S., Habaebi, M.H., Elsheikh, E.M.A., Chebil, A.J. (2018). Convolutional neural network-based finger vein recognition using near infrared images. In 2018 7th international conference on computer and communication engineering (ICCCE), pp. 453-458. https://doi.org/10.1109/ICCCE.2018.8539342
[21] Zhu, C., Yang, Y., Jang, Y. (2019). Research on denoising of finger vein image based on deep convolutional neural network. In 2019 14th International Conference on Computer Science & Education (ICCSE), pp. 374-378. https://doi.org/10.1109/ICCSE.2019.8845517
[22] Hong, H.G., Lee, M.B., Park, K.R. (2017). Convolutional neural network-based finger- vein recognition using NIR image sensors. Sensors, 17(6): 1297. https://doi.org/10.3390/s17061297
[23] Song, J.M., Kim, W., Park, K.R. (2019). Finger-vein recognition based on deep DenseNet using composite image. IEEE Access, 7: 66845-66863. https://doi.org/10.1109/ACCESS.2019.2918503
[24] Das, R., Piciucco, E., Maiorana, E., Campisi, P. (2018). Convolutional neural network for finger-vein-based biometric identification. IEEE Transactions on Information Forensics and Security, 14(2): 360-373. https://doi.org/10.1109/TIFS.2018.2850320
[25] Hong, H.G., Lee, M.B., Park, K.R. (2017). Convolutional neural network-based finger-vein recognition using NIR image sensors. Sensors, 17(6): 1297. https://doi.org/10.3390/s17061297
[26] Huang, H., Liu, S., Zheng, H., Ni, L., Zhang, Y., Li, W. (2017). DeepVein: Novel finger vein verification methods based on deep convolutional neural networks. In 2017 IEEE International Conference on Identity, Security and Behavior Analysis (ISBA), pp. 1-8. https://doi.org/10.1109/ISBA.2017.7947683
[27] Raghavendra, R., Venkatesh, S., Raja, K.B., Busch, C. (2017). Transferable deep convolutional neural network features for fingervein presentation attack detection. In 2017 5th International Workshop on Biometrics and Forensics (IWBF), pp. 1-5. https://doi.org/10.1109/IWBF.2017.7935108
[28] Qin, H., El-Yacoubi, M.A. (2017). Deep representation-based feature extraction and recovering for finger-vein verification. IEEE Transactions on Information Forensics and Security, 12(8): 1816-1829. https://doi.org/10.1109/TCSVT.2017.2684826
[29] Yin, Y., Liu, L., Sun, X. (2011). SDUMLA-HMT: a multimodal biometric database. In Chinese Conference on Biometric Recognition, pp. 260-268. https://doi.org/10.1007/978-3-642-25449-9_33
[30] Sulaiman, D.M., Abdulazeez, A.M., Haron, H. (2020). Double stages of feature extraction based GFPMI for colored finger vein identification, Indonesian Journal of Electrical Engineering and computer science.
[31] Sulaiman, D.M., Abdulazeez, A.M., Haron, H., Sadiq, S.S. (2019). Unsupervised learning approach-based new optimization K-means clustering for finger vein image localization. In 2019 International Conference on Advanced Science and Engineering (ICOASE), pp. 82-87. https://doi.org/10.1109/ICOASE.2019.8723749
[32] He, K., Zhang, X., Ren, S., Sun, J. (2016). Deep residual learning for image recognition. In Proceedings of the IEEE Conference on Computer Vision and Pattern Recognition, pp. 770-778.