Yujia Wang | Chen Wang | Bo Wu | Tong Chen | Hengge Xie | Atsushi Ogihara | Xiaowen Ma | Siyu Zhou | Shouqiang Huang | Shuwu Li | Jiakang Liu | Kai Li*
© 2022 IIETA. This article is published by IIETA and is licensed under the CC BY 4.0 license (http://creativecommons.org/licenses/by/4.0/).
OPEN ACCESS
Alzheimer's disease (AD), an incurable disease, poses a major health problem. It is important to identify patients with mild cognitive impairment (MCI) and early AD. Clock rendering test (CDT) is an effect way to screen AD patients quickly in the community. However, the current CDT methods require specific equipment to collect features, and the existing prediction models are inefficient in early warning of MCI. To solve the problem, this paper replaces digital pen with fingertip interaction, and proposes an early warning model for AD early dCDT images based on ResNet50. The dCDT tests were carried out on normal cognitive elderly, MCI patients and mild AD patients, and the results were used to verify the analysis and classification ability of the ResNet50-based early AD prediction model, in contrast to the clock score-based early AD prediction model. The comparison shows that the ResNet50-based early AD prediction model is efficient in early warning than the other model, and is suitable for large-scale screening of AD patients in the community, in the absence of doctors.
Alzheimer's disease (AD), human-computer interaction (HCI), deep learning, early warning
Alzheimer's disease (AD), which affects over 44 million people worldwide, has emerged as one of the key challenges [1, 2]. There is currently no treatment available for AD due to a bottleneck in pharmacological development [3]. Preclinical AD, AD-related moderate cognitive impairment, and AD-related dementia are the three stages of the disease [4]. The first stage of mild cognitive loss is known as mild cognitive impairment (MCI) [5]. Earlier research [6] shows that people could regain normal cognition if they are properly diagnosed and treated. Therefore, it is crucial to identify patients with MCI and early AD.
One of the most explored neuropsychological tests is the clock drawing test (CDT), which is frequently utilized in clinical evaluations [7, 8]. On a piece of blank paper, the test asks the participants to draw a clock that reads 10mins after 11. The clock drawing behavior can assess a variety of cognitive abilities including but not limited to memory, motor control, and visuospatial ability [9, 10]. It has been employed in the community to rapidly screen for AD patients, due to its benefits of low cost, high acceptance, and fast completion. The screening must still be carried out and the data analyzed by medical personnel. Additionally, the doctor's clinical background may have an impact on how the results are assessed [11-13].
To compensate for these limitations, recent research automates the scoring and classification of AD patients using digital versions of the clock drawing test (dCDT) based on human-computer interaction (HCI) and machine learning algorithms [14, 15]. For instance, Müller et al. [16] used a forward stepwise logistic regression model to examine participants' speed and other clock test features. For normal cognition (NC) and MCI, the model's classification accuracy was 77.5%. Using a machine learning model, Yasunori Yamada et al. [17] investigated the stress and other factors involved in the testing procedure. The model's NC and AD classification accuracy was 80%. Ishikawa et al. [18] analyzed the features of multiple tasks through the fusion of three-classification models, and achieved a final accuracy of 74.6%. However, the aforementioned models require the use of a digital pen to gather characteristics and have poor MCI patient early warning effectiveness, making them unsuitable for screening large communities.
Therefore, this study designs a dCDT test model with high prediction efficiency using fingertip interaction rather than digital pen to address the needs of large-scale screening in the community, in the absence of doctors. The authors came up with a new early warning method of AD HCI based on deep learning, and designed two prediction models, namely, an early AD prediction model based on clock score, and an early AD dCDT image prediction model based on ResNet50. The classification ability of the two models were verified through dCDT tests on NC elderly, MCI patients and mild AD patients. The results show that the ResNet50-based early AD prediction model is efficient in early warning than the other model, and is suitable for large-scale screening of AD patients in the community, in the absence of doctors.
2.1 Data acquisition
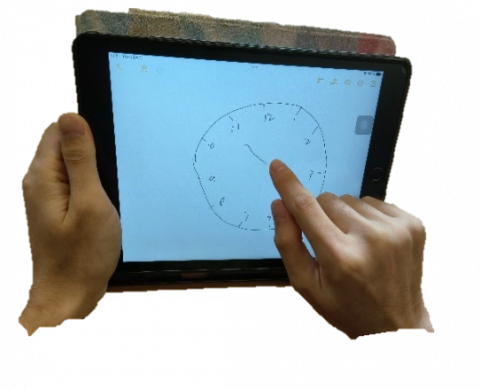
In this study, we developed the human-computer interaction dCDT early warning paradigm of AD. The mobile devices with related systems are used to record the evaluation data of the dCDT by the participants, and the digital pen was replaced by fingertip interaction. After the test began, participants were required to draw the 11:10 clock, including the outline of the clock, numbers and hands, with their fingers on the tablet according to voice and text prompts. The paradigm evaluation scenario of mobile terminal is shown in Figure 1.
Figure 1. Paradigm evaluation scenario of mobile terminal
2.2 Data preprocessing
The collected image data needed to be preprocessed. First of all, damaged and blurred pictures were removed by the combination of automatic machine cleaning and manual audit. Then the image was uniformly resized to 1917*762 px.
2.3 Prediction model based on clock score calculation
2.3.1 Extraction and analysis of digital biomarkers
Figure 2. Evaluation results
Digital biomarkers are defined as objective, quantifiable, physiological, and behavioral data that are collected and measured by means of digital devices [19] We used the mobile devices to collect the CDT images of participants. For the above dCDT images collected by digital mobile devices after preprocessing, we selected three digital biomarkers from the Angle of image features based on analytic hierarchy process (AHP) method: Clock contour fraction, Numeric fraction, and Pointer fraction. Evaluation results is shown in Figure 2.
DBM1: Clock contour fraction is used to determine whether the clock profile is closed;
DBM2: Numeric fraction is used to judge whether the number in the clock is correct.
DBM3: Pointer fraction is used to determine whether the clock hands are correct.
Through the corrosion in the morphological operation, we burred the clock images to improve the calculation accuracy.
$\left[\varepsilon_A(X)\right](x)=\min \left\{X_A\right\}$ (1)
where, $\left[\varepsilon_A(X)\right](x)$ represents the method by which structure element A corrodes from the child element x of set X. $X_A$ is the value of x within structure element A.
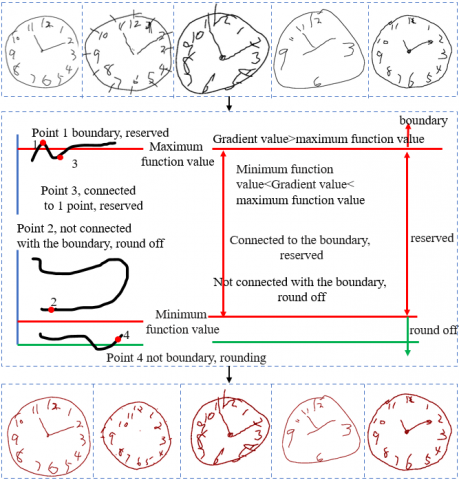
Based on the contour edge detection technology, we judge the closing condition of the outer contour of the clock, and record the results in a binary way. Contour edge detection process is shown in Figure 3.
Figure 3. Contour edge detection process
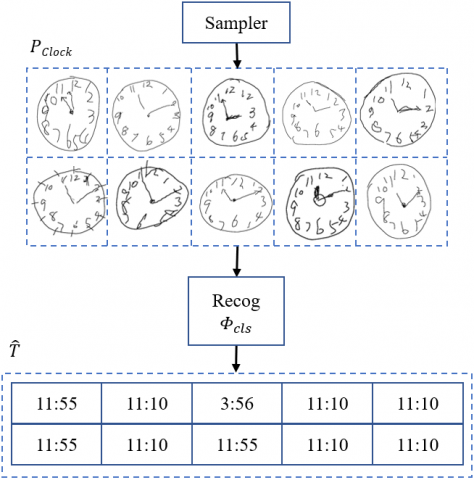
Optical character recognition (OCR) technology was used to recognize the numbers written by the participants and the results was recorded in a binary way. As shown in figure 4, the Space Converter Network (STN) was used to identify the clock architecture [20] to achieve end-to-end clock alignment and recognition training. The real clock picture was used to further narrow the gap between the simulation and real data, so as to realize the clock time reading and record the results in a binary way. The clock time calculation formula is as follows:
$\widehat{T}=\Phi_{\text {cls }}\left(P_{\text {clock }}\right) \in D^{720}$ (2)
where, $\hat{T}$ is the prediction of clock time; $\Phi_{c l s}$ is classification network; $P_{\text {clock }}$ is the dCDT images drawn by the participants. If we quantify the time, there were 12 possibilities for the hour and 60 possibilities for the minute. with a total of 720 possibilities. $D^{720}$ is 720 -way classification.
Figure 4. Evaluation results
2.3.2 Traditional statistical analysis
The SPSS 25.0 software package (IBM, Armonk, NY) was used for statistical analysis. The above digital biomarkers were used as input indicators of the multiple logistic regression model, and classification labels were set according to the inclusion results. The relevant formulas are as follows:
$s(x)=\frac{1}{1+e^{-x}}$ (3)
$f(x)=w_1 x_1+w_2 x_2+\cdots+w_n x_n+b$ (4)
According to Formula (4), we can get:
$f(x)=\sum_{i=1}^n w_i x_i+b=w^T x+b$ (5)
In formula (5), $b=w_0, x_0=1$ , we can get:
$f(x)=w^T x$ (6)
$y=\frac{1}{1+e^{-f(x)}}=\frac{1}{1+e^{-w^T x}}$ (7)
where, x is the digital biomarker extracted in this study, y is the early prediction results of NC, MCI and mild AD, and w is the parameter:
$\operatorname{Softmax}\left(z_i\right)=\frac{\exp \left(z_i\right)}{\sum_{j=1}^K \exp \left(z_j\right)}$ (8)
where, zi is the output value of the i node, and K is the number of output nodes, that is, the number of categories. Because the classification label of this study includes three categories: NC, MCI and mild AD, K=3.
2.4 Prediction model based on ResNet50
2.4.1 Increment of data
Since A larger dataset can prevent the model from learning features that are not relevant to the purpose, to improve the performance of deep learning models, it is important to use a large database for training. However, due to the overall small number of images in our used dataset, this paper is prepared to use traditional data expansion methods to increase the amount of data on the basis of pre-processing data. We increased each image by 20, using methods such as Adapting the hue, random angle rollback, randomly changing the length of the image, randomly changing the width of the image, random scaling, random horizontal flipping and random vertical flipping.
$\left[\begin{array}{l}x_n \\ y_n\end{array}\right]=\left[\begin{array}{cc}\cos \theta & -\sin \theta \\ \sin \theta & \cos \theta\end{array}\right]\left[\begin{array}{l}x_o \\ y_o\end{array}\right]$ (9)
where, $x_o$ and $y_o$ are the original coordinate of the image, $\theta$ is the rotation angle, $x_n$ and $y_n$ are the coordinate of the image after rotation.
2.4.2 Model pre-training
Because training machine learning (ML) models often requires the use of very large datasets, in practice it is rare to train an entire convolutional network from scratch.
Therefore, through transfer learning (TL), we pre train convolutional neural networks (ConvNet, CNN) on a very large dataset, and then use them as the initialization of the target task, which means that the constructed and trained ML model can be used as the basis for the second related task.
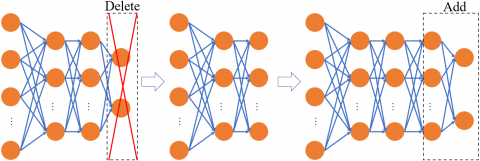
Specifically, as shown in Figure 5, the essence of the TL concept is to eliminate the final layer of the base model and adapt and append new layers for learning according to the purpose, in order to save training time and adapt to small sample sizes. When the target dataset is small (smaller than the amount of data used for training the originally trained model), the TL concept can be applied to build a more accurate ML model.
Figure 5. Principles of transfer learning
The ResNet50 V2 model is used in this paper for ML model training was trained first on the ImageNet dataset, and this model is now being repurposed to learn features to be trained on the dataset of clock painting which collected by our experiments. When the model is initially trained, TL allows us to start with features extracted from the ImageNet dataset and adapt the learned features to the structure of the model and the requirements of the new dataset. The loss function is as follows:
$L=-\frac{1}{N} \sum_i \sum_{c=1}^M y_{i c} \log \left(p_{i c}\right)$ (10)
where, M is the classified quantity, M=3, $y_{i c}$ is a function symbol. If the true category of sample a is c, $y_{i c}$=1, otherwise $y_{i c}$ =0, $p_{i c}$ is the prediction probability that observation sample i belongs to category c.
2.4.3 Construction of prediction model
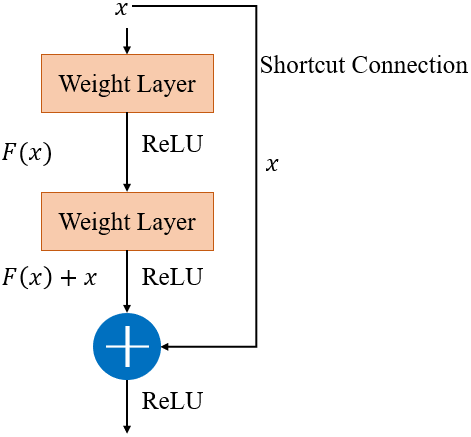
ResNet50 is a multi-layered convolutional neural network have 50 layers deep, which used deep bottleneck architecture and the shortcut to perform better neural networks [21]. The ResNet network consists of the remaining blocks [22], unlike a traditional neural network where each layer is connected to the next layer, in a network like ResNet with remaining building blocks, in addition to connecting to the next layer, each block is also connected directly to the layer which is 2-3 layers deeper as a shortcut connection.
As shown in Figure 6, in a residual block, the input x can be directed through many convolutional layers (function F) to eventually obtain the result F(x). Unlike CNNs that possess similar logic, ResNet subsequently adds the input x to the result F(x), which becomes F(x)+x as an element-wise addition (+). Which means that the using of residual blocks allows the information in x to penetrate deeper into the neural network via a shortcut, in a way that allows us to train a much deeper network. Including opposite direction, the deeper the CNN, the path of information from the input layer to the output layer becomes larger. ResNet networks can be implemented by stacking many remaining blocks together to form a network.
Figure 6. Residual block
Therefore, it is possible to use intermediate activations to let the residual blocks go deeper into the neural network, allowing us to continue training deeper neural networks without losing performance [23, 24]. As an application, this feature of ResNet means that the users do not have many data for training can load a pretrained version of the network trained on more than a million images from the ImageNet database [23]. We take the enhanced image of the sample as the input of the model, divide the training set and test set according to the proportion of 8:2, and set the classification label according to the grouping results to build the early model of three categories of AD, with the relevant formula as follows.
$y= F \left(x, w_f\right)+x$ (11)
where, it is conventional convolution neural network.
$y= F (x, w)+x$ (12)
where, it is ResNet.
$W_N=\frac{W_o-F+2 P}{S}+1$ (13)
$H_N=\frac{H_o-F+2 P}{S}+1$ (14)
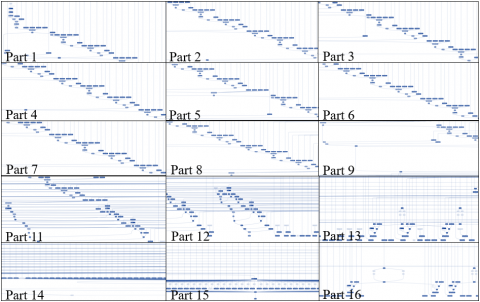
where, it is feature map size calculation. The input clock image size is $W_o{ }^* H_o$, the convolution kernel size is $F ^* F$, the stride is $S$, then the output image size is $W_N{ }^* H_N$. The visualization results of the model are shown in Figure 7.
Figure 7. Proposed ResNet-50 Model visualization results
3.1 Data acquisition result
A total of 127 participants aged 50-85 years from a third-class hospital in Beijing were recruited for the study, including 42 NC elderly, 46 patients with MCI, and 13 patients with mild AD. Finally, 127 pictures of dCDT were collected. Grouping of participants is based on the hospital's existing clinical diagnosis (according to NIA–AA criteria [25, 26]). The study was approved by the ethics committee of Zhejiang Chinese Medical University, and all participants voluntarily participated in the experiment and signed informed consent prior to the experiment. The clinical diagnosis was based on the clinical evaluation of hospital physicians (including imaging examinations such as MRI and PET, neuropsychological tests, laboratory examination, etc.). Exclusion criteria included meeting the diagnostic criteria for Parkinson's disease, frontotemporal dementia, dementia with Lewy bodies or Huntington's disease; other causes of dementia, such as cerebrovascular disease, central nervous system trauma, etc.; a history of schizophrenia, severe anxiety and depression; aphasia, consciousness disorders and other diseases affecting cognitive evaluation; tumor; a history of epilepsy or use of antiepileptic medications, and any medical conditions (including arm disability, etc.) that may prevent completion of the experimental paradigm.
3.2 Results of data preprocessing
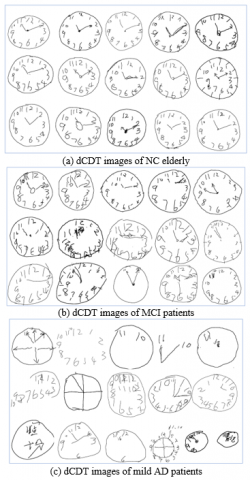
127 dCDT images collected in the hospital were preprocessed before. Finally, as shown in Table 1, we included 118 dCDT images in this study. dCDT images of different categories of participants are given in Figure 8.
Table 1. dCDT images included in the study
|
No. |
Type |
Abbr. |
Amount |
|
1 |
Mild Cognitive Impairment |
MCI |
60 |
|
2 |
Normal Cognition |
NC |
36 |
|
3 |
Alzheimer's Disease |
AD |
22 |
Figure 8. dCDT images of different participants
3.3 Data increment results
As a result, a total of 2258 images were ultimately used for deep learning by ResNet50 in this study. Dataset with data augmentation is shown in Table 2.
3.4 Experimentation settings of prediction model based on ResNet50
For the experiments, we used the anaconda platform and the well-established Keras with Tensorflow framework to train the process as well as to test the proposed models. The specific experimental environments such as the PC used in this study are showed in Table 3.
Table 2. Dataset with data augmentation
|
No. |
Type |
Abbr. |
Amount |
|
1 |
Mild Cognitive Impairment |
MCI |
1132 |
|
2 |
Normal Cognition |
NC |
697 |
|
3 |
Alzheimer's Disease |
AD |
429 |
Table 3. Experimental environment
|
Description |
Type |
|
OS |
64-bit operating system Windows 10 |
|
RAM |
32 GB |
|
Graphics Cards |
Nvidia GeForce RTX 2080 Ti 11GB GDDR6 |
|
Programming Languages |
Python 3.8.8 |
|
Framework |
Keras 2.10.0 |
|
Model |
ResNet-50 v2 [23] |
3.5 Evaluation index
3.5.1 Confusion matrix
The 2 by 2 Confusion Matrix is an important measure to evaluate the performance, which is shown in Table 4.
Table 4. Confusion matrix
|
|
Predicted Class |
|
|
Positive |
Negative |
|
|
Actual Class |
True Positive (TP) |
False Negative (FN) |
|
False Positive (FP) |
True Negative (TN) |
|
3.5.2 Performance metrics
Performance analysis is carried out using Accuracy, Precision, Recall (Sensitivity), Specificity. The performance metrics are mathematically calculated as follows:
Accuracy $=\frac{T P+T N}{T P+F P+F N+T N}$ (15)
Precision $=\frac{T P}{T P+F P}$ (16)
$\operatorname{Recall}($ Sensitivity $)=\frac{T P}{T P+F N}$ (17)
Specificity $=\frac{T N}{T N+F P}$ (18)
3.6 Performance analysis
3.6.1 Analysis results of traditional statistical analysis
As shown in Figure 9, the 3 by 3 confusion matrix is used to evaluate the performance.
Figure 9. 3 by 3 confusion matrix
Table 5. Performance metrics of traditional statistical analysis
|
Description |
Accuracy |
Precision |
Recall |
Specificity |
|
NC |
0.00 |
0.0 |
0.0 |
0.0 |
|
MCI |
0.95 |
0.51 |
0.95 |
0.95 |
|
Mild AD |
0.18 |
0.57 |
0.18 |
0.18 |
The prediction results of traditional statistical analysis are quite bad. Accuracy of prediction model is 0.52. Performance metrics of traditional statistical analysis are shown in Table 5.
3.6.2 Analysis results of ResNet50 prediction model
In this study, we used the traditional setup of using 80% of the data for training ResNet-50 model and the remaining 20% for testing the accuracy of the generated models. All data extraction was carried out randomly.
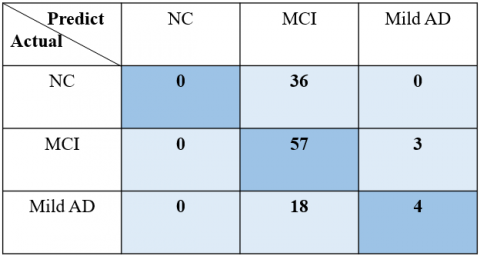
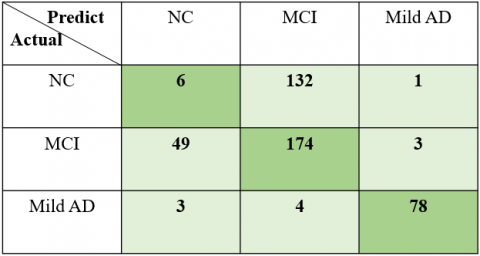
As shown in Figure 10, the 3 by 3 confusion matrix is used to evaluate the performance of ResNet50 prediction model.
The proposed model achieved an accuracy of 85% approximately. The accuracy generated is relatively high since the data is very complex.as shown in Table 6.
Figure 10. 3 by 3 confusion matrix
Table 6. Performance metrics of ResNet50 prediction model
|
Description |
Accuracy |
Precision |
Recall |
Specificity |
|
NC |
0.87 |
0.72 |
0.95 |
0.83 |
|
MCI |
0.86 |
0.95 |
0.77 |
0.96 |
|
Mild AD |
0.98 |
0.95 |
0.92 |
0.99 |
In this study, the traditional early AD prediction model based on clock score calculation did not show a good prediction ability. This may be due to the fact that the traditional prediction method based on clock score calculation is aimed at the dCDT of digital pen [14-17]. However, in this study, fingertip interaction was used instead of digital pen. Therefore, the current mainstream clock score calculation methods for the evaluation of dCDT images in this study did not accord with the reality, and were difficult to achieve the correct classification of NC, MCI and mild AD. It is also possible that the cognitive impairment of MCI is subtle, and simple score calculation cannot distinguish NC from MCI. In addition, the early AD prediction model based on clock score calculation did not enhance the samples, so the limited sample size may also be the reason for its low prediction effectiveness. The early AD dCDT image prediction model based on ResNet50 avoided the deficiency of small sample size to some extent through sample enhancement. This image prediction model automatically extracts and learns the features of three kinds of human images, and adapts to the new way of fingertip interaction instead of digital pen for community screening. At present, developing countries such as Asia and Africa are facing the dilemma of rapidly aging population and relative shortage of medical resources [27-29]. To some extent, this a new early warning method of AD human-computer interaction based on deep learning technology can reduce the cost of community screening and is more conducive to the promotion of community screening in developing countries such as Asia and Africa.
There is no doubt that the lack of samples has become the biggest regret of this study. However, it is gratifying that a new early warning method of AD human-computer interaction based on deep learning technology still shows good early warning effectiveness under small samples. In the future, we will collect more clinical dCDT images to further enhance the reliability and accuracy of this early warning method.
In summation, we proposed a new early warning method of AD human-computer interaction based on deep learning technology, and designed two prediction model including the early AD prediction model based on clock score calculation and the early AD dCDT image prediction model based on ResNet50. The dCDT test results of NC elderly, MCI patients and mild AD patients were collected to test the predictive performance of the two models. The results showed that, compared with the early AD prediction model based on clock score calculation, the early AD dCDT image prediction model based on ResNet50 had good early warning efficiency. The new early warning method of AD human-computer interaction based on deep learning technology is suitable for large-scale screening of AD patients in the community without doctors.
This research is supported by “Integrated equipment package for individualized intelligent rehabilitation diagnosis and treatment of traditional Chinese medical encephalopathy at home-Take insomnia and epilepsy as an example based on traditional Chinese medical intelligent syndrome differentiation for treatment” which is Key R&D Program (Grant No.: 2021C03116) of Zhejiang Province, “Research and development of early stage multimodal fusion early warning system and new non-invasive neuroregulatory techniques for Alzheimer's disease” which is Key R&D Program (Grant No.: 2022C03064) of Zhejiang Province and “A full cycle intelligent rehabilitation system for future TCM multimodal perception enhanced diagnosis and integrated treatment of medicine and medical equipment for Alzheimer’s Disease” which is a scientific research project (Grant No.: 2021JKZDZC04) of Zhejiang Chinese Medical University. Besides, Yujia Wang Chen Wang, Bo Wu, and Tong Chen contributed equally to this work and should be considered co-first authors.
[1] Jia, L., Quan, M., Fu, Y., et al. (2020). Dementia in China: epidemiology, clinical management, and research advances. The Lancet Neurology, 19(1): 81-92. https://doi.org/10.1016/S1474-4422(19)30290-X
[2] Scheltens, P., Strooper, B.D., Kivipelto, M., Holstege, H., Chételat, G., Teunissen, C.E., Cummings, J. (2021). Flier WMvd: Alzheimer’s disease. Lancet, 397: 1577-1590. https://doi.org/10.1016/s0140-6736(20)32205-4
[3] Hernandez, C., Shukla, S. (2022). Liposome based drug delivery as a potential treatment option for Alzheimer's disease. Neural Regeneration Research, 17(6): 1190-1198. https://doi.org/10.4103/1673-5374.327328
[4] Knopman, D.S., Amieva, H., Petersen, R.C., Chételat, G., Holtzman, D.M., Hyman, B.T., Nixon, R.A., Jones, D.T. (2021). Alzheimer disease. Nature Reviews Disease Primers, 7(1): 33. https://doi.org/10.1038/s41572-021-00269-y
[5] Lindbergh, C.A., Dishman, R.K., Miller, L.S. (2016). Functional disability in mild cognitive impairment: A systematic review and meta-analysis. Neuropsychology Review, 26(2): 129-159. https://doi.org/10.1007/s11065-016-9321-5
[6] Tian, Q., Studenski, S.A., An, Y., Kuo, P.L., Schrack, J.A., Wanigatunga, A.A., Simonsick, E.M. Resnick, S.M., Ferrucci, L. (2021). Association of combined slow gait and low activity fragmentation with later onset of cognitive impairment. JAMA Network Open, 4(11): e2135168-e2135168. https://doi.org/10.1001/jamanetworkopen.2021.35168
[7] Tuokko, H., Hadjistavropoulos, T., Miller, J.A., Beattie, B.L. (1992). The clock test: A sensitive measure to differentiate normal elderly from those with Alzheimer disease. Journal of the American Geriatrics Society, 40(6): 579-584. https://doi.org/10.1111/j.1532-5415.1992.tb02106.x
[8] Tran, J., Nimojan, T., Saripella, A., et al. (2022). Rapid cognitive assessment tools for screening of mild cognitive impairment in the preoperative setting: A systematic review and meta-analysis. Journal of Clinical Anesthesia, 78: 110682. https://doi.org/10.1016/j.jclinane.2022.110682
[9] Ruchinskas, R.A., Singer, H.K., Repetz, N.K. (2001). Clock drawing, clock copying, and physical abilities in geriatric rehabilitation. Archives of Physical Medicine and Rehabilitation, 82(7): 920-924. https://doi.org/10.1053/apmr.2001.23993
[10] Shulman, K.I. (2000). Clock-drawing: is it the ideal cognitive screening test? International Journal of Geriatric Psychiatry, 15(6): 548-561. https://doi.org/10.1002/1099-1166(200006)15:6%3C548::AID-GPS242%3E3.0.CO;2-U
[11] Piers, R.J., Devlin, K.N., Ning, B., et al. (2017). Age and graphomotor decision making assessed with the digital clock drawing test: The Framingham heart study. Journal of Alzheimer's Disease, 60(4): 1611-1620. https://doi.org/10.3233/jad-170444
[12] Juby, A. (1999). Correlation between the Folstein Mini-Mental State Examination and three methods of clock drawing scoring. Journal of Geriatric Psychiatry and Neurology, 12(2): 87-91. https://doi.org/10.1177/089198879901200209
[13] Cahn, D.A., Salmon, D.P., Monsch, A.U., Butters, N., Wiederholt, W.C., Corey-Bloom, J., Barrett-Connor, E. (1996). Screening for dementia of the Alzheimer type in the community: The utility of the clock drawing test. Archives of Clinical Neuropsychology, 11(6): 529-539. https://doi.org/10.1016/0887-6177(95)00041-0
[14] Davoudi, A., Dion, C., Amini, S., Tighe, P. J., Price, C. C., Libon, D. J., Rashidi, P. (2021). Classifying non-dementia and Alzheimer’s disease/vascular dementia patients using kinematic, time-based, and visuospatial parameters: the digital clock drawing test. Journal of Alzheimer's Disease, 82(1): 47-57. https://doi.org/10.3233/jad-201129
[15] Zheng, X., Zhang, W., Wang, X., et al. (2021). extended application of digital clock drawing test in the evaluation of Alzheimer’s disease based on artificial intelligence and the neural basis. Current Alzheimer Research, 18(14): 1127-1139. https://doi.org/10.2174/1567205018666211210150808
[16] Müller, S., Herde, L., Preische, O., et al. (2019). Diagnostic value of digital clock drawing test in comparison with CERAD neuropsychological battery total score for discrimination of patients in the early course of Alzheimer’s disease from healthy individuals. Scientific Reports, 9(1): 3543. https://doi.org/10.1038/s41598-019-40010-0
[17] Yamada, Y., Kobayashi, M., Shinkawa, K., Nemoto, M., Ota, M., Nemoto, K., Arai, T. (2022). Characteristics of drawing process differentiate Alzheimer’s disease and dementia with Lewy bodies. Journal of Alzheimer's Disease, 90(2): 693-704. https://doi.org/10.3233/jad-220546
[18] Ishikawa, T., Nemoto, M., Nemoto, K., et al. (2019). Handwriting features of multiple drawing tests for early detection of Alzheimer’s disease: A preliminary result. Studies in Health Technology and Informatics, 264: 168-172. https://doi.org/10.3233/shti190205
[19] Lio, G., Fadda, R., Doneddu, G., Duhamel, J.R., Sirigu, A. (2019). Digit-tracking as a new tactile interface for visual perception analysis. Nature Communications, 10(1): 5392. https://doi.org/10.1038/s41467-019-13285-0
[20] Yang, C., Xie, W., Zisserman, A. (2022). It's about time: Analog clock reading in the wild. In Proceedings of the IEEE/CVF Conference on Computer Vision and Pattern Recognition, Orleans, LA, USA, pp. 2508-2517. http://dx.doi.org/10.1109/CVPR52688.2022.00254
[21] Yang, X., Yang, D., Huang, C. (2021). An interactive prediction system of breast cancer based on ResNet50, chatbot and PyQt. In 2021 2nd International Seminar on Artificial Intelligence, Networking and Information Technology (AINIT), Shanghai, China, pp. 309-316. https://doi.org/10.1109/AINIT54228.2021.00068
[22] Yari, Y., Nguyen, T.V., Nguyen, H.T. (2020). Deep learning applied for histological diagnosis of breast cancer. IEEE Access, 8: 162432-162448. https://doi.org/10.1109/ACCESS.2020.3021557
[23] He, K., Zhang, X., Ren, S., Sun, J. (2016). Identity mappings in deep residual networks. In European Conference on Computer Vision, Amsterdam, The Netherlands, pp. 630-645. https://doi.org/10.1007/978-3-319-46493-0_38
[24] Krizhevsky, A., Sutskever, I., Hinton, G.E. (2017). Imagenet classification with deep convolutional neural networks. Communications of the ACM, 60(6): 84-90. https://doi.org/10.1145/3065386
[25] Albert, M.S., DeKosky, S.T., Dickson, D., et al. (2011). The diagnosis of mild cognitive impairment due to Alzheimer's disease: recommendations from the National Institute on Aging-Alzheimer's Association workgroups on diagnostic guidelines for Alzheimer's disease. Alzheimer's & Dementia, 7(3): 270-279. https://doi.org/10.1016/j.jalz.2011.03.008
[26] McKhann, G.M., Knopman, D.S., Chertkow, H., et al. (2011). The diagnosis of dementia due to Alzheimer’s disease: Recommendations from the National Institute on Aging-Alzheimer’s Association workgroups on diagnostic guidelines for Alzheimer's disease. Alzheimer's & Dementia, 7(3): 263-269. https://doi.org/10.1016/j.jalz.2011.03.005
[27] Wang, Q., Wang, L. (2021). The nonlinear effects of population aging, industrial structure, and urbanization on carbon emissions: A panel threshold regression analysis of 137 countries. Journal of Cleaner Production, 287: 125381. https://doi.org/10.1016/j.jclepro.2020.125381
[28] Crisp, N., Chen, L. (2014). Global supply of health professionals. New England Journal of Medicine, 370(10): 950-957. https://doi.org/10.1056/NEJMra1111610
[29] Hay Burgess, D.C., Wasserman, J., Dahl, C.A. (2006). Global health diagnostics. Nature, 444(1): 3. https://doi.org/10.1038/nature05440