Vedat Tümen
© 2022 IIETA. This article is published by IIETA and is licensed under the CC BY 4.0 license (http://creativecommons.org/licenses/by/4.0/).
OPEN ACCESS
Using deep learning techniques on radiological lung images for detecting COVID-19 is a promising technique in shortening the diagnosis time. In this study, we propose a hybrid deep learning model, detecting the COVID-19 and Pneumonia virus using Chest X-ray images. The proposed model, named SpiCoNET, first runs multiple well-known deep learning models combined with Spiking Neural Network (SNN) in order to identify the models with higher accuracy rates. Then, SpiCoNET combines the features of the two models with the highest accuracy rates among the well-known models and hands the combined features over to a different SNN layer as an input. Finally, the features are classified by using the SEFRON learning algorithm. The proposed hybrid deep learning model takes advantage of the features of the well-known models combined with SNN providing the highest accuracy rate. Moreover, the proposed model makes use of the SEFRON learning algorithm to provide better classification. The proposed model provides an accuracy rate of 97.09% for the classification of images of the COVID-19, Pneumonia and Normal, which outperforms AlexNet (91.27%) and DenseNet201 (90.40%). The results reveal that deep learning based systems for the identification of COVID-19 and Pneumonia can help healthcare professionals control the COVID-19 pandemic in an effective manner.
COVID-19, pneumonia, X-ray radiology images, spiking neural network, convolutional neural network
The COVID-19 virus was first seen at the end of December 2019, which is spreading rapidly across the World [1, 2]. The COVID-19 pandemic goes on to demolish lives of the people and economies of countries all over the world, threatening our work, social relationship and health. It is stated by the World Health Organisation (WHO) that the COVID-19 virus is a derivative of the Middle East Respiratory Syndrome (MERS) and Severe Acute Respiratory Syndrome Coronavirus (SARS) viruses [3].
Early diagnosis of COVID-19 can be beneficial for countries and for timely referral and treatment of the patient to quarantine, as well as for the rapid connection of severe cases to the respiratory device and controlling the spread of the disease. Methods used to diagnose COVID-19 are real-time reverse transcription-polymerase chain reaction (RT-PCR), computed tomography (CT), and X-ray methods [4]. Although the RT-PCR method does not yield a high success rate in a patient’s diagnosis, it is a frequently used method in the detection of diseases [5]. CT and X-ray are also commonly used in the detection of COVID-19. However, due to a large number of harmful radioactive rays of CT scanning compared to X-ray method, the X-ray method is more often used in the diagnosis of the COVID-19. X-ray method is less harmful than CT scanning and is used as an easier and faster diagnostic procedure [6]. For these reasons, the use of X-ray images for the diagnosis of the COVID-19 is considered a convenient, fast and effective solution. Failure to detect the virus early and delay in treatment may lead to increased loss of life and an increased risk of infection [7].
Machine learning (ML) methods are now used as an indispensable solution for physicians [8]. Due to the limited number of radiologists in hospitals, diagnosis can be made with artificial intelligence techniques as a rapid and low-cost solution, thus reducing the workload of radiologists. While artificial intelligence (AI) methods play an important role in the detection of the disease, the existing AI methods need significant improvements to provide an accuracy rate similar to a radiologist. The development of artificial intelligence-based diagnosis systems with much higher accuracy rates can aid in making well-informed decisions for effective diagnosis of COVID-19 in a rapid manner. Additionally, these techniques significantly reduce the cost of testing [9-11]. For these reasons, the use of X-ray images to diagnose COVID-19 is considered a quick and effective solution.
The diagnosis of diseases such as MERS-CoV and SARS-CoV viruses which emerged before COVID-19 using X-ray images and ML techniques has been first studied in reference [12]. Many different ML applications have been also developed to strengthen the decisions on diagnosis as an alternative diagnosis tool [13]. ML techniques developed for the classification, recognition, and diagnosis of diseases provide promising results [14-17]. Deep Learning (DL), a special area of machine learning, provides automatic recognition performing end-to-end learning and using pre-produced weights [18-21]. Compared to ML techniques, DL provides higher accuracy rates in addition to the less human interference, workload and short time requirement in the development phase [22-26].
Looking at the existing studies on Chest X-ray images, many different DL models have been used to diagnose COVID-19. Transfer learning and fine-tuning methods in addition to DL methods, e.g., CNN, are exploited to detect COVID-19 [27-32]. Since these studies mainly focus on diagnosis of only the COVID-19, their accuracy rates are significantly high. However, the studies related to diagnosis of multiple diseases on the X-ray images have achieved much lower accuracy rates. To give an example, Ozturk et al. detected COVID-19 and Pneumonia on X-ray images using the DarkNet model with 17 convolutional and different filtering layers. The authors achieved a 98.08% accuracy rate for two classes (COVID-19, non-COVID-19), but 87.02% for multiple classes in their study [32]. Irfan et al. [33] made triple classification on both X-ray and CT images employing a hybrid method built using LSTM and CNN models. Their accuracy rate of 98.7% is much lower than our model’s. Almalki et al. [34], using Transfer learning and Random forest classifier, performed quadruple classification on the dataset containing 284 COVID-19, 310 Healthy, 330 Pneumonia and 327 Viral-pneumonia images. They achieved the highest success rate 97.29% exploiting the Random forest algorithm. By using the augmentation method, Brunese et al. classified 3520 Healthy and 3003 Disease-infected (including COVID-19) X-ray images using the Transfer learning-Vgg16 model with 96% success rate. They also classified 250 COVID-19-tagged images among 3003 infected images (other images were tagged with different infection diseases), and the performance was 98% for COVID-19 detection [35]. Although an augmentation method is employed, their model’s performance was lower than our study. Panwar et al. [36] achieved 97.62% accuracy rate in his two-class study on 142 COVID-19 and 142 Healthy images using the Vgg-16 model. Their accuracy result was also lower than the detection success of the COVID-19 images using our model. Overall, when we look at the state of the art methods about disease detection on the x-Ray images, while they have limited success on two classes, they have a very low accuracy rate on the three class disease recognition. In this work we struggle to fill this gap.
Toğaçar et al. [37] detect skin cancer by using disease images and also [38] make a weather forecast using aerial images by employing a method used in this study. Four different weather conditions images were exploited with GoogleNet and VggNet CNN models. The features are combined, then delivered to the SNN method. To achieve a higher success rate, a SWAT learning algorithm is employed to classify them. The results show that the highest success rates are in sunny and cloudy weather images (98.48%). While in our work we first run multiple well-known CNN models to find the best ones for a dataset, the work of Toğaçar et al. [38] runs only fix two CNN methods selected based on the experience. Moreover, in our work we prefer the SEFRON classifier versus SWAT classifier due to its superiority to SWAT according to Jeyasothy et al. [39]. Overall, the proposed model is unique in the state of the art both in the diseases detection and in other applications.
It is clearly seen that deep learning-based hybrid studies provide higher accuracy rates for the classification of diseases on the X-ray images. One of the best examples of these models is the work proposed by Toğaçar et al. [38]. CNN+SNN+SWAT models were combined, thus providing a relatively higher success rate for the classification of the diseases [38]. Besides, a SEFRON-based study suggested by Jeyasothy et al. produces better results compared to the SWAT based learning algorithm and other learning algorithms [39]. Inspired by the result of reference [39], we consider that the COVID-19 detection studies' relatively low success rates can be increased. To this end, we build a hybrid model called SpiCoNET, which includes SEFRON-based SNN and CNN models. A CNN+SNN model using the SEFRON learning algorithm was applied on COVID-19 images for the first time. Furthermore, the features obtained from the CNN models with the best results were combined and delivered to the SNN layer, thus enabling the successful use of SNNs + SEFRON learning models. Such two techniques showing their success in the different areas are employed together to enhance the accuracy rate for the COVID-19 detection on the X-ray images for the first time in our work, which shows the uniqueness of the proposed model.
In this study, since traditional CNN models and existing hybrid models provide a limited accuracy rate in recognition of the diseases on the X-ray images, we propose a hybrid deep learning model, named SpiCoNET, providing a much better accuracy rate in the classification of multiple disease classes. SpiCoNET first acquires the features produced by well-known CNN models combined with SNN. The features of the most successful two models among the well-known models are combined with a different SNN layer. Finally, to provide a better classification, SpiCoNET exploits the Synaptic Efficacy Function-based leaky-integrate-and-fire neuRON (SEFRON) learning algorithm. The extensive experimental results denote that SpiCoNET provides a considerably higher accuracy rate compared to well-known CNN methods combined with SNN. While the proposed method achieves 97.09% accuracy rate, the AlexNet and DenseNet201 provide 91.27% and 90.40% accuracy rates, respectively. In this study, COVID-19 and Pneumonia disease is diagnosed for the first time by using CNN + SNN + SEFRON method on X-ray images achieving high performance values. Analysis results show that the proposed model achieved 99.91% (COVID-19), 97.39% (Pneumonia), and 97.48% (Healthy) test success results for 3 different classes.
The remainder of the paper is organized as follows. Information about the dataset, model, method, and the proposed approach are given in Section 2. Experimental results are presented in Section 3. The Section 4 consists of the elaborated discussions. The paper is concluded in Section 5.
In this section, we will present the required information about technologies employed in construction of the proposed model.
2.1 Convolutional neural network models
Deep learning has become a popular method nowadays, especially in biomedical data classification [40]. CNNs are a specific type of deep neural network (DNN), which focus on image recognition. CNN models generally consist of convolutional, pooling, activation, normalization, flattening and classification layers. A convolutional layer with different properties (e.g., stride, size) is used to extract features from the images in the input layer. Pooling layers with different features (e.g., max, avg.) are used to reduce the enormous amount of numerical data and to obtain the most meaningful ones. Pooling layers not only reduce the data size but also reveal data blocks with different features. After the pooling layer, different activation methods (e.g., ReLU, Leaky ReLU, sigmoid, linear, tanh) are exploited to reduce the numerical characteristics of the data. AlexNet [19], GoogLeNet [41], DenseNet201 [42], ResNet [43], InceptionNet [44], VggNet [45], ShuffleNet [46] are the best known methods with successful recognition results. However, the successes of these models vary depending on the data types and number and quality of the datasets. Using transfer learning techniques, CNN model could provide much better results and the training time could sharply decrease.
2.2 Spiking neural network
Spiking Neural Network (SNN) is an artificial neural network model, working like natural neural networks and mimicking synaptic states over time. The neurons in the SNN do not transmit data; instead, they enable other neurons to manipulate the value of the data. SNN triggers the propagation cycles of neurons and directly affects the increase and decrease of signal potentials of other neurons near these neurons [47].
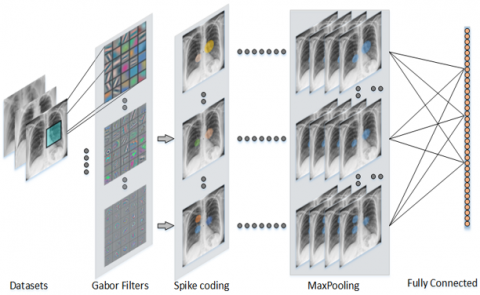
Figure 1. Working principle of SNN
If the triggering values of the neurons exceed the specified threshold value, triggering occurs; otherwise, the neuron is terminated. Upon exceeding the determined threshold value, the signal is processed, and a change in the signal value increase or decrease is observed. The SNN is shaped according to the increase or decrease in the signals. Sudden decreases and increases in neuron frequencies are seen as events, and these values are calculated as seen in Eq. (1) [48].
$I(t)-\frac{V_m(t)}{R_m}=C_m \frac{\partial V_m(t)}{\partial t}$ (1)
In Eq. (1), I is the current, Vm is the voltage, Cm is the capacitor, Rm is the resistance, and t represent time. SNN model has few outputs, and the data coming with these outputs are correlated. Each neuron deals with neurons close to it and takes into account its value. SNNs use the time concept for triggering. The values of dominant neurons become apparent with nearby neurons, and these neurons resemble the process of filtering windows in convolutional layers in CNN models. Generally, SNN architecture consists of input layer, gabor filters, spike coding, maxPooling and fully connected layers as seen in Figure 1 [48]. A linear Gabor filter is used to identify lesions found in x-ray images taken from the relevant dataset. Thus, edges extending in a certain direction are detected. Edges with similarity and proximity are combined with Spike coding to identify areas of regional lesions. These steps are repeated, resulting in growth in unrelated areas. The maxPooling layer is used to reduce areas that do not contain lesion information. Finally, the different parameters obtained are combined to be classified by the fully connected layer.
SNNs produce new values based on time intervals instead of generating continuous values like artificial neural networks [49]. SNN uses different methods except for the Softmax classifier, which serves to classify the triggered neurons in the output layer. This study uses a new, time-varying, long-term Synaptic Activity Function-based leak-integrated and firing neuRON model (SEFRON) and spike-time plasti (STDP) learning rule [39]. The parameters used in the SNN model are given in Table 1.
Table 1. Parameters and values of the determined spiking neural network model
|
Parameter |
Value |
|
Number of receptive field neurons in the population encoding scheme |
6 |
|
Presynaptic spike interval in milliseconds |
3 |
|
Postsynaptic spike interval in milliseconds |
4 |
|
Desired postsynaptic firing time in milliseconds |
2 |
|
Precision of time-step |
0.01 |
|
Learning rate of weight update |
0.63 |
|
Sigma of time-varying weight kernel in milliseconds |
0.5 |
|
The time constant of spike response function in milliseconds |
3 |
|
Number of maximum epochs |
100 |
|
Time-constant of STDP learning window |
1.7 |
2.3 Synaptic efficacy function-based leaky-integrate-and-fire neuRON (SEFRON) learning algorithm
The synapse model needs different attributes and stimuli to generate both excitatory and inhibitory features and to model the data distribution in the feature space. The selection of synapses is fulfilled by looking at the ignition and warning value [39]. In Eq. (2), i mathematical calculation of the presynaptic jump time of the synapse is shown.
$F_i=\left\{t_i^k ; 1 \leq k \leq n_i\right\}$ (2)
where, ni: the total number of presynaptic jump fired by the ith synapse, k: firing order, $t_i^k$: defined as the kth presynaptic firing time fired by the ith input neuron. Eq. (3) is used to calculate postsynaptic firing neurons as well as the presynaptic firing neuron of SEFRON [39].
$v(\hat{t})=\sum_{i=1}^m \sum_{k=1}^{n_i} \omega_i\left(t_i^k\right) \cdot \epsilon\left(\hat{t}-t_i^k\right)$ (3)
where, the parameters used to calculate the postsynaptic potential of SEFRON; $\omega_i t$: product of instantaneous weights in the network, $\epsilon(t)$: immediate response function. The SEFRON neuron is determined by evaluating the sum of all instantaneous weights formed by the Eqns. (2) and (3).
The postsynaptic spike is correctly classified by SEFRON, if the spike is within the desired firing range. Correctly classified instances are not used for the weight update of the network [39]. Removing unnecessary new information during the training phase improves generalization in data distribution between the classes.
The X-ray images used in this study were obtained from different sources to detect COVID-19 and Pneumonia diseases. Most of these images were obtained from open-access datasets derived by Cohen et al. [50, 51]. These images have different sizes (i.e., between: 240x320 px and 800x880 px), quality and features. There are also randomly selected images of COVID-19, pneumonia and disease-free images of men and women. The created dataset has 162 COVID-19, 650 Pneumonia, and 682 non-infection X-ray images. Since these images were collected from different countries and different health institutions, they have a lack of standard. However, they were converted to the same standards with image processing techniques. Images with different depth characteristics were converted to different (between 8-32) bit depth and gray formats. When the transformation phase of the images is done quickly, it does not cause any delay in real-time detection systems. After the necessary labeling process was done in the chest X-ray dataset, the images for the training and test stages of the proposed model were randomly converted into datasets to be used for 70% training and 30% testing. All images were labeled and converted into random datasets. Figure 2 shows preparation steps of the proposed method.
As seen in Figure 2, images collected from different environments are left in a database and then pre-processed. Images with various sizes and properties are formatted to equal size with resize. Images are cropped at the edges that are irrelevant and affect performance.
Figure 2. The preparation steps of the proposed model consisting of image processing, preprocessing dataset preparation and comparison stages
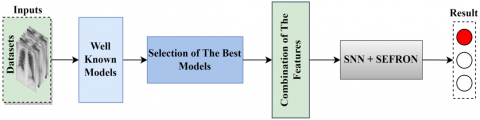
Figure 3. The workflow of the proposed approach
Figure 4. The block diagram of SpiCoNET built for the chest X-ray dataset
Table 2. Analysis of the results (%) obtained in the first step of the proposed model (CNN models and SNN model)
|
CNN Models |
1000 Features Layers Name |
Num. of Features |
CNN Acc. |
SNN Acc. |
RoI |
Contribution of SNN (Up-Down) |
|
AlexNet |
FC8 |
1,000 |
88.95 |
91.279 |
2.62 |
Up |
|
DenseNet-201 |
FC1000 |
1,000 |
87.79 |
90.407 |
2.98 |
Up |
|
GoogLeNet |
Loss3-classifier |
1,000 |
77.03 |
87.209 |
13.21 |
Up |
|
Inceptionv3 |
Predictions |
1,000 |
70.64 |
89.244 |
26.34 |
Up |
|
NasNetMobile |
Predictions |
1,000 |
65.7 |
86.628 |
31.85 |
Up |
|
ResNet-50 |
FC1000 |
1,000 |
86.63 |
86.337 |
-0.34 |
Down |
|
ShuffleNet |
Node_202 |
1,000 |
79.94 |
87.5 |
9.46 |
Up |
|
VGG-16 |
FC8 |
1,000 |
93.6 |
87.209 |
-6.83 |
Down |
In this proposed study, X-Ray images with different qualities are resized to provide single images. The proposed method consists of two steps. In the first stage, it runs the well-known CNN models (e.g., AlexNet, DenseNet etc.) combined with SNN to see their accuracy rate results on the dataset.
SpiCoNET selects two models with the highest accuracy rates to build a model used in the classification of chest diseases on the X-ray images. SpiCoNET employs the features of the selected well-known models to benefit from their feature extraction layers. By doing so, the proposed model exploits the feature extraction power of the well-known models. After that, by combining the features of the selected models, SpiCoNET hands them over a new SNN layer. The SNN model improves the feature extraction capability of the SpiCoNET by spiking the extreme features on the images. After the SNN layer, the proposed method makes use of a classifier method (SEFRON), which efficiently picks the neurons for better classification. The design of SpiCoNET is illustrated in Figure 3.
In the proposed model, we aim at increasing classification performance by obtaining the features with high distinctiveness. To do this, in the first stage, accuracy results of multiple well-known models are obtained to select two models with highest accuracy rates. After finding the best two models for such images, SpiCoNET employs well-known two models permanently. The structure of the proposed SpiCoNET is demonstrated in Figure 4.
The images contained in the dataset are used as input parameters of well-known models. The results of using these CNN models with SNN are examined. The selected well-known models have two different fully connected layers containing 1,000 features. By combining these features, a new feature set with 2,000 features was created. In this way, efficient features are provided to contribute to the training of models by aiming to increase the success of the classification process.
In this study, a CNN & SNN-based hybrid model (SpiCoNET) is proposed for early detection of COVID-19 disease using Chest X-ray images. The success of the proposed model is evaluated with performance metrics, i.e., recall, precision, F1-score. These metrics are calculated using the parameters True-Positive (TP), False-Negative (FN), True-Negative (TN), and False-Positive (FP) [52-54].
The entire study is carried out on a system with a computer with an NVIDIA GeForce 8 GB graphic card, Intel© i5 - Core @3.2 GHz processor and 8 GB of memory. In addition, MATLAB is used as a simulation software. 30% of the dataset was used for the analysis of the study.
5.1 Efficiency of the SNN on the CNN models
The features derived from the two CNN models providing the highest accuracy results are fed to the SNN model in one dimension. Rate of Increase (RoI) is computed using the (AccCNN) and (AccSNN ) according to Eq. (4).
Rate of Increase $(R o I)=\frac{A c c_{S N N}-A c c_{C N N}}{A c c_{C N N}} \cdot 100$ (4)
In the first step of the study, the dataset is trained and classified by CNN models (GoogLeNet, AlexNet, DenseNet-201, ResNet, InceptionNetv3, VGGNet, NasNetMobile, and ShuffleNet). Then, the features obtained with the CNN modelsare used as the input parameters of the SNN model. While some CNN models present an increase in the success rates, the others introduce a decrease in the accuracy rates. All classification performance and parameters are shown in Table 2.
As seen in Table 2, pre-trained well-known CNN models are classified using different-named layers that provide 1000 features. The VGG-16 and AlexNet models achieve 93.6% and 88.95% accuracy, respectively, in the FC8 layer. In the FC1000 layer, the DenseNet-201 and ResNet-50 models achieve 87.79% and 86.63% accuracy, respectively. Inceptionv3 and NasNetMobile models give the lowest results with 70.64% and 65.7% accuracy rates using prediction layers. Lastly, while GoogLeNet achieved 77.03% success with the Loss3-classifier layer, the ShuffleNet model achieved 79.94% success using the Node_202 layer.
The results of the well-known CNN models are compared with the CNN + SNN models. The highest increase is in the NasNetMobile model (31.85%), followed by the Inceptionv3 model (26.34%). The SNN model has a negative effect of 6.83% on the VGG-16 model, although it has the highest accuracy itself. It also negatively affects the success of the ResNet-50 model by 0.34%. In this study, AlexNet and DenseNet-201 models introduced the highest success when used with the SNN models, 2.62% and 2.98%, respectively. According to the results, the features of AlexNet and DenseNet-201 CNN models give the highest success when used with the SNN model, 91.279%, 90.407%, respectively.
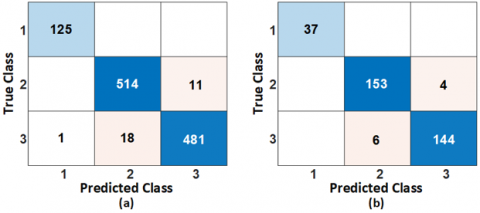
In the light of the obtained results, we prefer employing the features of only two models with the highest success versus exploiting the features derived from all models in order to avoid the complexity. 2,000 features are acquired by combining the two models’ features before handing them over the SNN model. Thus, more efficient features were selected to increase the success of the classification process and to contribute to the training of the models. Combined features are used as an input to a new SNN model. The classification results of COVID-19, Pneumonia and Healthy are denoted in the confusion matrix results shown in Figure 5.
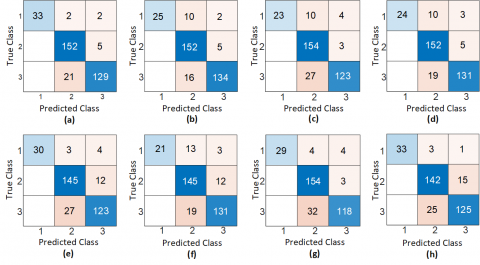
Figure 5. Confusion matrix representation of the results obtained with the CNN & SNN method (1. COVID-19, 2. Healthy, 3. Pneumonia); a) AlexNet & SNN, b) DenseNet201 & SNN, c) GoogLeNet & SNN, d) InceptionNet & SNN, e) NasNetMobile & SNN, f) ResNet-50 & SNN, g) ShuffleNet & SNN, h) VGG-16 & SNN
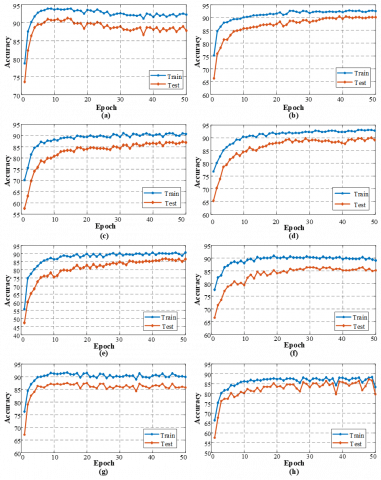
Figure 6. Accuracy rate of examined CNN & SNN models; (a) AlexNet & SNN, (b) DenseNet-201 & SNN, (c) GoogLeNet & SNN, (d) InceptionNet & SNN, (e) NasNetMobile & SNN, (f) ResNet-50 & SNN, (g) ShuffleNet & SNN, (h) VGG-16 & SNN
Table 3. Detail analysis results (%) of CNN & SNN models of the experiment
|
Method |
Classes |
Accuracy |
Precision |
Recall |
F1 Score |
|
AlexNet & SNN |
COVID-19 |
98.84 |
0.89 |
1.0 |
0.94 |
|
Healthy |
91.86 |
0.97 |
0.87 |
0.92 |
|
|
Pneumonia |
91.86 |
0.86 |
0.95 |
0.90 |
|
|
DenseNet-201 & SNN |
COVID-19 |
96.51 |
0.68 |
1.0 |
0.81 |
|
Healthy |
90.99 |
0.97 |
0.85 |
0.91 |
|
|
Pneumonia |
93.31 |
0.89 |
0.95 |
0.92 |
|
|
GoogLeNet & SNN |
COVID-19 |
95.93 |
0.62 |
1.0 |
0.77 |
|
Healthy |
88.37 |
0.98 |
0.81 |
0.89 |
|
|
Pneumonia |
90.12 |
0.82 |
0.95 |
0.88 |
|
|
InceptionNet & SNN |
COVID-19 |
96.22 |
0.65 |
1.0 |
0.79 |
|
Healthy |
90.12 |
0.97 |
0.84 |
0.90 |
|
|
Pneumonia |
92.15 |
0.87 |
0.94 |
0.91 |
|
|
NasNetMobile & SNN |
COVID-19 |
97.97 |
0.81 |
1.0 |
0.90 |
|
Healthy |
87.79 |
0.92 |
0.83 |
0.87 |
|
|
Pneumonia |
87.50 |
0.82 |
0.88 |
0.85 |
|
|
ResNet-50 & SNN |
COVID-19 |
95.35 |
0.57 |
1.0 |
0.72 |
|
Healthy |
87.21 |
0.92 |
0.82 |
0.87 |
|
|
Pneumonia |
90.12 |
0.87 |
0.81 |
0.89 |
|
|
ShuffleNet & SNN |
COVID-19 |
97.67 |
0.78 |
1.0 |
0.88 |
|
Healthy |
88.66 |
0.98 |
0.81 |
0.89 |
|
|
Pneumonia |
88.66 |
0.79 |
0.94 |
0.86 |
|
|
VGG-16 & SNN |
COVID-19 |
98.34 |
0.89 |
1.0 |
0.94 |
|
Healthy |
85.47 |
0.90 |
0.80 |
0.85 |
|
|
Pneumonia |
86.05 |
0.79 |
0.88 |
0.83 |
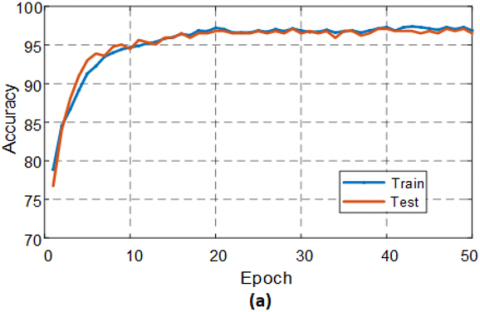
Figure 7. Performance graph of the proposed approach (SpiCoNET) on CNN & SNN architectures; (a) accuracy performance graph, (b) loss performance graph
The confusion matrix of eight different analysis results is denoted in Figure 5. While class one and two contain images of lungs infected with COVID-19 and non-COVID-19, class three includes Pneumonia-infected lungs images. The test data includes 37 COVID-19-infected chest X-ray images, 157 healthy chest X-ray images, and 150 Pneumonia-infected chest X-ray images. Table 2 shows that the highest success rates are achieved by AlexNet & SNN and DenseNet & SNN models. As seen in Figure 5 (a), while AlexNet & SNN model correctly detects 33 COVID-19-infected images, it incorrectly classifies two images, in which one of them is healthy and the other one is pneumonia-infected. Only five of 157 healthy Chest images were misclassified as pneumonia-infected. Twenty-one of the 150 Pneumonia-infected images were incorrectly predicted as healthy. As demonstrated in Figure 5 (b), the DenseNet & SNN model introduces low success by misclassifying ten of the COVID-19-infected images as healthy, the other two as pneumonia-infected. Sixteen pneumonia-infected images were incorrectly detected as healthy. Also, only five of 157 healthy chest images were misclassified as pneumonia-infected.
In Figure 6, accuracy results of the well-known CNN models combined with SNN model are denoted. Figure 6 shows that in all models, the training phase is almost completed in the 50th epochs, and achieves a stable state after the 40th epoch. The test and training accuracy rates go up in parallel. In Figure 6 (a), It is seen that the AlexNet & SNN model achieves the highest success in the 9th epoch at 91.27%. In Figure 6 (b), In the DenseNet201 & SNN model, an increase was observed in test performance and achieved in the 41st epoch at 90.40%. Detailed analysis results of this study are given in Table 3.
Considering the analysis results, the SNN model significantly contributes to the success of the CNN models. Figure 7 shows accuracy and loss graphs of the model according to 50 epochs during the train and test stages of the proposed model (SpiCoNET).
5.2 The comparison of SpiCoNET performance values
Figure 7 shows the classification performance and loss performances of combined features of AlexNet and DenseNet-201 CNN & SNN models, namely SpiCoNET. Figure 7 (a) demonstrates that the accuracy in the training and test stages increase in parallel. The increase in performance stops after the 20th epoch and achieves a stable value. In Figure 7 (b), the loss graph demonstrates that the error rate in the classification of the images decreases during the progress of the training phase. Successful completion of the training phase of the proposed model can be seen on both the accuracy and the loss graph.
The comparison of performance values of the SpiCoNET, single CNN, and CNN & SNN models are shown in Table 4.
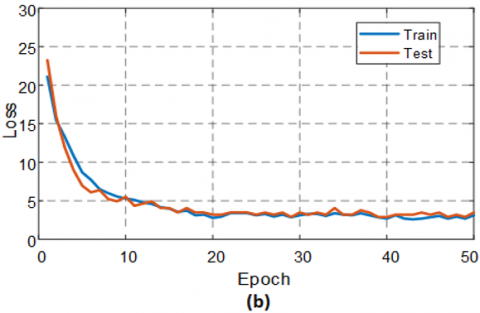
Confusion matrix results of the proposed SpiCoNET are shown in Figure 8. In Figure 8 (a), the training of 125 COVID-19 images is completed in the training stage of the proposed model. However, 11 of the 525 healthy images are incorrectly classified as Pneumonia-infected. 18 of 500 Pneumonia-infected images are wrongly classified as healthy, and one is as COVID-19-infected. In Figure 8 (b), all COVID-19 images are correctly classified in the testing phase, achieving high success by inaccurately classifying only 4 of 157 health images as pneumonia-infected. 6 of 150 Pneumonia-infected images are falsely diagnosed as healthy.
Figure 8. Confusion matrix of proposed combined model
Table 4. The accuracy rate of single CNN&SNN and combined features & SNN models
|
Models |
Feature Size |
Single CNN models Accuracy |
CNN&SNN Accuracy |
Combined Features & SNN Accuracy |
|
AlexNet |
1000 |
89.00% |
91.27% |
97.39% (Train) 97.09% (Test) |
|
DenseNet-201 |
1000 |
87.80% |
90.40% |
Table 5. Detail analysis results AlexNet & DenseNet & SNN combined method performance values
|
Step |
Classes |
Accuracy |
Precision |
Recall |
F1 Score |
|
Train |
COVID-19 |
100% |
1.0 |
1.0 |
1.0 |
|
Healthy |
97.09% |
0.97 |
0.96 |
0.97 |
|
|
Pneumonia |
97.09% |
0.96 |
0.97 |
0.97 |
|
|
Test |
COVID-19 |
99.91% |
1.0 |
0.99 |
1.0 |
|
Healthy |
97.48% |
0.98 |
0.97 |
0.97 |
|
|
Pneumonia |
97.39% |
0.96 |
0.98 |
0.97 |
Table 6. Comparison of the proposed approach with the COVID-19 detection studies made with the X-ray image dataset
|
Reference |
Model/Method |
Data Type |
Number/Dataset |
Class Number |
Accuracy (%) |
|
[27] |
Transfer Learning Models CNN |
X-ray images |
224 / COVID-19 504 / Healthy 700 / Pneumonia |
2 / 3 |
MobilNet v2 94.72(3 class) 96.78 (2 class) |
|
[28] |
ResNet-50 + SVM Wavelet transform Contourlet transform Shearlet transform SVM |
X-ray images |
361 / COVID-19 200 / Healthy |
2 |
95.71 92.85 96.07 85.39 99.29 |
|
[29] |
Transfer Learning Models & SVM, BSIF |
X-ray images |
180 / COVID-19 200 / Healthy |
2 |
94.70 |
|
[30] |
CovidNet |
X-ray images |
183 / COVID-19 5521 / Pneumonia 7766 / Healthy |
3 |
93.90 |
|
[31] |
Transfer Learning Models |
X-ray images |
50 / COVID-19 50 / Healthy |
2 |
99.70 |
|
[32] |
DarkNet & YOLO |
X-ray images |
127 / COVID-19 500 / Healthy 500 / Pneumonia |
2 / 3 |
98.08 (two class) 87.02 (multi class) |
|
[33] |
HDNNs (LSTM + CNN) |
CT images and X-ray images |
1200+1000 / COVID-19 500+600 / Healthy 1000+700 / Pneumonia |
3 |
98.7 (COVID-19) 89 (Healthy) 96.5 (Pneumonia) |
|
[34] |
CoVIRNet (Inception-ResNet model) + Random Forest |
X-ray images |
284 / COVID-19 310 / Healthy 330 / Pneumonia 327 / Viral-pneumonia |
4 |
95.7 (Avg.) (CoVIRNet) 97.29(Avg.) (CoVIRNet + RF) |
|
[35] |
Transfer Learning VGG-16 |
X-ray images + data augmentation (rotation) |
3520 / Healthy 3003 / Disease (COVID-19 included) 2753 /Disease 250 / COVID-19 |
2 |
Model 1: 96 (Avg.) Model 2: 98 (Avg.) |
|
[36] |
nCOVnet CNN - VGG-16 |
X-ray images |
142 / COVID-19 142 / Healthy |
2 |
97.62% (COVID-19) |
|
Proposed Approach |
SpiCoNET Transfer Learning Models & SNN |
X-ray images |
162 / COVID-19 682 / Healthy 650 / Pneumonia |
3 |
97.09 (Avg.) 99.91 (COVID-19 type) |
The accuracy results of the SpiCoNET are given in Table 5. The detailed analysis results denote that the proposed model significantly contributes to disease detection in all performance values. Table 6 shows the comparison of the proposed model with the existing studies conducted to detect COVID-19 disease on the X-ray images.
It is noteworthy that most of the studies take advantage of transfer learning and fine-tuning techniques. To the best of our knowledge, the combination of feature technique and SNN method are used for the first time in our study. Using these two techniques together enables the SNN model to spike additional neurons’ extreme features, which highlights the characteristic features for better classification of COVID-19 and Pneumonia disease. Thus, it has been proven in this study that spiking networks integrated with CNN models outperform their stand-alone use. As a result, we observed that the classification process of spiking networks contributes to the overall success of the CNN models.
Table 6 represents that the classification studies on COVID-19 datasets include different numbers of classes. Using different Transfer Learning Models, Apostolopoulos et al. [27] conducted studies on 224 COVID-19, 504 Healthy and 700 Pneumonia X-ray images (both for two and three-class diseases). They achieved the highest success using the MobilNet-v2 model (96.78-two class, 94.72-three class). Despite the high number of images, lower success rate was achieved in both binary and triple classification compared to our model. Ismail et al. made binary (361 COVID-19 / 200 Healthy images) classification (99.29%) using Transfer learning, SVM, Wavelet transform, Contourlet transform and Shearlet transform methods in their studies [28, 29]. Despite the use of many complex techniques, their accuracy rate was lower than our study. Narin et al. [31] made binary classification using Transfer Learning Models on an equal number of 50 COVID-19, 50 Healthy X-ray images, and their success rate was 99.70%. Despite using a near equal number of images and Transfer Learning models, its performance was lower than the proposed study. By increasing the number of images using the augmentation method, Brunese et al. classified 3520 Healthy and 3003 Disease (COVID-19 include) X-ray images using the Transfer learning-Vgg16 model with 96% success rate. They also classified 250 COVID-19-tagged images among 3003 disease images (other images were tagged with different infection diseases), and the performance was 98% for COVID-19 detection [35]. Although the same images were increased by an augmentation method, its performance was lower than the proposed study. Panwar et al. [36] achieved 97.62% accuracy rate in his two-class study on 142 COVID-19 and 142 Healthy images using the Vgg-16 model. This result was also lower than the detection success of the COVID-19 images found in the proposed study.
When we look at the studies focusing on multiple classification, we see the following prominent studies: Luz et al. [30] achieved 93.90% accuracy rate in the classification of 183 COVID-19, 5521 Pneumonia and 7766 Healthy X-ray images with the CNN method they developed. Despite using a high number of unbalanced images, their study achieved a lower success rate compared to our study. Ozturk et al. [32] made both binary and triple classification using Darknet - Yolo Algorithms on 127 COVID-19, 500 Pneumonia and 500 Healthy images. While the success of binary classification was 98.08%, their study achieved a very low result (87.02%) in triple classification. Irfan et al. [33] made a triple classification on both X-ray and CT images with the hybrid method built using LSTM and CNN models, and their success rate for COVID-19 detection was 98.7%. In triple classification, our model outperforms their hybrid model. Almalki et al. [34], using Transfer learning and Random forest classifier, performed quadruple classification on the dataset containing 284 COVID-19, 310 Healthy, 330 Pneumonia and 327 Viral-pneumonia images. They achieved the highest success rate using the Random forest algorithm, 97.29%.
In this study, the SpiCoNET model developed based on CNN and SNN was used. This model is used for analysis of Chest X-ray images. Analysis results show that SpiCoNET achieved 99.91%, 97.39%, and 97.48% test success results for 3 different classes (COVID-19, Pneumonia and Healthy), respectively. These results denote that the proposed model outperforms all existing approaches classifying multiple diseases using similar datasets. The result indicates that the features derived from AlexNet and DenseNet-201 enable SpiCoNET to provide the highest accuracy rates for the COVID-19 and Pneumonia diseases.
In the proposed approach, deep learning models, i.e., CNN and SNN models, are employed for the classification of the diseases on X-ray images. This study shows that when SNNs are used together with CNN models, they significantly contribute to increase of accuracy rates in the recognition of the diseases. Pneumonia symptoms are hard to distinguish from other COVID-19 symptoms, as they are so similar to COVID-19. However, this method was able to detect both these infections with high accuracy rates.
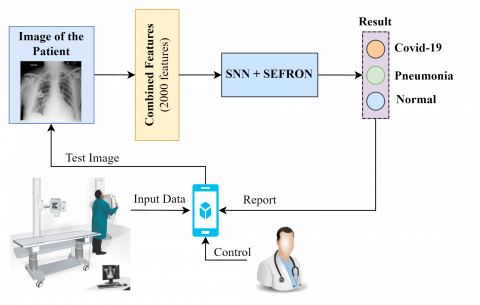
Figure 9 shows that the proposed model running on a cloud based mobile application can help the doctors to easily access and assess the patient's X-ray images. Using this application, the doctors spend less time to recognize the COVID-19 and Pneumonia diseases, enabling identification of the COVID-19 diseases in a short time. In hospitals where the proposed system is used, x-ray images of patients (upon permission) are uploaded to the cloud-based system. These images can be used for the ongoing training process of the proposed model. Thus, disease information in a patient's x-ray image can be detected with higher accuracy over time.
Figure 9. Application of the proposed model in the real world hospital system
Advantages of the proposed approach;
(1) By employing the CNN and SNN methods together, X-ray images of both COVID-19 and Pneumonia patients detected for the first time, thus correctly classifying all images with COVID-19 infection.
(2) For the detection of COVID-19 diseases, SEFRON in addition to the CNN+SNN model tried for the first time in this study.
(3) This method can diagnose X-ray images on the web or using smartphones with high performance without the risk of contamination.
Disadvantages of the proposed approach;
(1) The lack of sufficient X-ray images and balanced distribution may have affected the results.
(2) Resizing the small size pictures could result in loss of accuracy.
The proposed approach enables SNNs to use successfully with deep learning techniques, combining the features of CNN models with SNN. The usability of different CNN models in the SpiCoNET provides the flexibility for adaptation to different classification. The featured structure of the proposed method is that it provides efficient features to SNNs employing CNN models.
Contribution to the society of the proposed approach:
(1) The proposed approach can be used to assist medical professionals and radiologists.
(2) It will not be possible to carry out this process correctly with personal expertise examinations. Thanks to the proposed approach, the system can process many incoming images at the same time and give analysis results in a short time.
(3) With the proposed approach, it will be possible to perform the diagnosis-treatment process of many COVID-19 cases quickly and accurately, to save time and low cost.
(4) Doctors will be able to reach the diagnosis process of the patient in a short time with high performance.
(5) It would be useful in local hospitals without the need for specialist radiologists to quickly analyze X-ray images of patients with suspected COVID-19.
In the future, analyzes will be made with the proposed model (SpiCoNET) using images of other organs affected by the virus by interviewing experts working on COVID-19 disease. In order to increase the usability of the proposed model, we plan to make it accessible to health institutions. Doctors will be able to make free and fast diagnosis using this model.
The lungs of people with COVID-19 infection can be permanently damaged resulting in death if not treated early. People with lung damage caused by COVID-19 should be also isolated from other healthy individuals or those suffering from Pneumonia. In this study, to detect the COVID-19 diseases in the early stage, COVID-19 images are classified employing a deep learning based disease detection tool for X-ray images. For this purpose, in the first stage, the proposed model employs well-known CNN + SNN methods to obtain features of the two models with the highest success rates. The features of the two models are combined and delivered to a new SNN layer to improve the features quality. In addition, to provide an enhanced classification, the SpiCoNET exploits SEFRON learning algorithm. By using SpiCoNET, X-ray images with COVID-19, Pneumonia, and infection-free images are correctly classified with 99.91%, 97.39%, and 97.48%, respectively, which demonstrates that the proposed method provides remarkably higher accuracy than the existing works, which classify multiple diseases such as COVID-19, Pneumonia. To provide higher quality features of the COVID-19 and Pneumonia, in this work, we exploit well known models with the highest success rates together with a spiking network, which significantly help the proposed model. In addition, the spiking network is used with convolution models for COVID-19 analyses for the first time.
This study was carried out using the workstation in the Artificial Intelligence laboratory created in cooperation with Bitlis Eren University & Eren Holding Company. We thank them for their support.
[1] https://www.who.int/emergencies/disease-outbreak-news/item/2020-DON229, accessed on 15 June 2022.
[2] Wu, F., Zhao, S., Yu, B., et al. (2020). A new coronavirus associated with human respiratory disease in China. Nature, 579(7798): 265-269. https://doi.org/10.1038/s41586-020-2008-3
[3] https://www.worldometers.info/coronavirus/, accessed on 15 June 2022.
[4] Wang, Y., Kang, H., Liu, X., Tong, Z. (2020). Combination of RT‐qPCR testing and clinical features for diagnosis of COVID‐19 facilitates management of SARS-CoV-2 outbreak. Journal of Medical Virology, 92(6): 538-539. https://doi.org/10.1002%2Fjmv.25721
[5] Xie, X., Zhong, Z., Zhao, W., Zheng, C., Wang, F., Liu, J. (2020). Chest CT for typical coronavirus disease 2019 (COVID-19) pneumonia: Relationship to negative RT-PCR testing. Radiology, 296: E41-E45. https://doi.org/10.1148/radiol.2020200343
[6] Pan, F., Ye, T., Sun, P., et al. (2020). Time course of lung changes at chest CT during recovery from coronavirus disease 2019 (COVID-19). Radiology, 295(3): 715-721. https://doi.org/10.1148/radiol.2020200370
[7] Rehman, A., Sadad, T., Saba, T., Hussain, A., Tariq, U. (2021). Real-time diagnosis system of COVID-19 using X-ray images and deep learning. It Professional, 23(4): 57-62. https://doi.org/10.1109/MITP.2020.3042379
[8] Ngiam, K.Y., Khor, W. (2019). Big data and machine learning algorithms for health-care delivery. The Lancet Oncology, 20(5): e262-e273. https://doi.org/10.1016/S1470-2045(19)30149-4
[9] Hosny, A., Parmar, C., Quackenbush, J., Schwartz, L.H., Aerts, H.J. (2018). Artificial intelligence in radiology. Nature Reviews Cancer, 18(8): 500-510. https://doi.org/10.1038/s41568-018-0016-5
[10] Liew, C. (2018). The future of radiology augmented with artificial intelligence: A strategy for success. European Journal of Radiology, 102: 152-156. https://doi.org/10.1016/j.ejrad.2018.03.019
[11] Pesapane, F., Codari, M., Sardanelli, F. (2018). Artificial intelligence in medical imaging: threat or opportunity? Radiologists again at the forefront of innovation in medicine. European Radiology Experimental, 2(1): 35. https://doi.org/10.1186/s41747-018-0061-6
[12] Hamimi, A. (2016). MERS-CoV: Middle East respiratory syndrome corona virus: Can radiology be of help? Initial single center experience. The Egyptian Journal of Radiology and Nuclear Medicine, 47(1): 95-106. https://doi.org/10.1016/j.ejrnm.2015.11.004
[13] Rajkomar, A., Dean, J., Kohane, I. (2019). Machine learning in medicine. New England Journal of Medicine, 380(14): 1347-1358. https://doi.org/10.1056/NEJMra1814259
[14] Acharya, U.R., Hagiwara, Y., Koh, J.E.W., Oh, S.L., Tan, J.H., Adam, M., San Tan, R. (2018). Entropies for automated detection of coronary artery disease using ECG signals: A review. Biocybernetics and Biomedical Engineering, 38(2): 373-384. https://doi.org/10.1016/j.bbe.2018.03.001
[15] Acharya, U.R., Oh, S.L., Hagiwara, Y., Tan, J.H., Adeli, H. (2018). Deep convolutional neural network for the automated detection and diagnosis of seizure using EEG signals. Computers in Biology and Medicine, 100: 270-278. https://doi.org/10.1016/j.compbiomed.2017.09.017
[16] Litjens, G., Kooi, T., Bejnordi, B.E., et al. (2017). A survey on deep learning in medical image analysis. Medical Image Analysis, 42: 60-88. https://doi.org/10.1016/j.media.2017.07.005
[17] McBee, M.P., Awan, O.A., Colucci, A.T., et al. (2018). Deep learning in radiology. Academic radiology, 25(11): 1472-1480. https://doi.org/10.1016/j.acra.2018.02.018
[18] Goodfellow, I., Bengio, Y., Courville, A. (2016). Deep Learning. MIT Press.
[19] Krizhevsky, A., Sutskever, I., Hinton, G.E. (2017). Imagenet classification with deep convolutional neural networks. Communications of the ACM, 60(6): 84-90. https://doi.org/10.1145/3065386
[20] LeCun, Y., Bengio, Y., Hinton, G. (2015). Deep learning. Nature, 521(7553): 436-444. https://doi.org/10.1038/nature14539
[21] Schmidhuber, J. (2015). Deep learning in neural networks: An overview. Neural Networks, 61: 85-117. https://doi.org/10.1016/j.neunet.2014.09.003
[22] Hu, Z., Tang, J., Wang, Z., Zhang, K., Zhang, L., Sun, Q. (2018). Deep learning for image-based cancer detection and diagnosis - A survey. Pattern Recognition, 83: 134-149. https://doi.org/10.1016/j.patcog.2018.05.014
[23] Lakhani, P., Sundaram, B. (2017). Deep learning at chest radiography: Automated classification of pulmonary tuberculosis by using convolutional neural networks. Radiology, 284(2): 574-582. https://doi.org/10.1148/radiol.2017162326
[24] Shiraishi, J., Li, Q., Appelbaum, D., Doi, K. (2011). Computer-aided diagnosis and artificial intelligence in clinical imaging. Seminars in Nuclear Medicine, 41(6): 449-462. https://doi.org/10.1053/j.semnuclmed.2011.06.004
[25] Yasaka, K., Akai, H., Abe, O., Kiryu, S. (2018). Deep learning with convolutional neural network for differentiation of liver masses at dynamic contrast-enhanced CT: A preliminary study. Radiology, 286(3): 887-896. https://doi.org/10.1148/radiol.2017170706
[26] Yıldırım, Ö., Pławiak, P., Tan, R.S., Acharya, U.R. (2018). Arrhythmia detection using deep convolutional neural network with long duration ECG signals. Computers in Biology and Medicine, 102: 411-420. https://doi.org/10.1016/j.compbiomed.2018.09.009
[27] Apostolopoulos, I.D., Mpesiana, T.A. (2020). COVID-19: Automatic detection from X-ray images utilizing transfer learning with convolutional neural networks. Physical and Engineering Sciences in Medicine, 43(2): 635-640. https://doi.org/10.1007/s13246-020-00865-4
[28] Ismael, A.M., Şengür, A. (2020). The investigation of multiresolution approaches for chest X-ray image based COVID-19 detection. Health Information Science and Systems, 8(1): 29. https://doi.org/10.1007/s13755-020-00116-6
[29] Ismael, A.M., Şengür, A. (2021). Deep learning approaches for COVID-19 detection based on chest X-ray images. Expert Systems with Applications, 164: 114054. https://doi.org/10.1016/j.eswa.2020.114054
[30] Luz, E., Silva, P., Silva, R., et al. (2022). Towards an effective and efficient deep learning model for COVID-19 patterns detection in X-ray images. Research on Biomedical Engineering, 38(1): 149-162. https://doi.org/10.1007/s42600-021-00151-6
[31] Narin, A., Kaya, C., Pamuk, Z. (2021). Automatic detection of coronavirus disease (COVID-19) using x-ray images and deep convolutional neural networks. Pattern Analysis and Applications, 24(3): 1207-1220. https://doi.org/10.1007/s10044-021-00984-y
[32] Ozturk, T., Talo, M., Yildirim, E.A., Baloglu, U.B., Yildirim, O., Acharya, U.R. (2020). Automated detection of COVID-19 cases using deep neural networks with X-ray images. Computers in Biology and Medicine, 121: 103792. https://doi.org/10.1016/j.compbiomed.2020.103792
[33] Irfan, M., Iftikhar, M.A., Yasin, S., et al. (2021). Role of hybrid deep neural networks (HDNNs), computed tomography, and chest X-rays for the detection of COVID-19. International Journal of Environmental Research and Public Health, 18(6): 3056. https://doi.org/10.3390/ijerph18063056
[34] Almalki, Y.E., Qayyum, A., Irfan, M., et al. (2021). A novel method for COVID-19 diagnosis using artificial intelligence in chest X-ray images. Healthcare, 9(5): 522. https://doi.org/10.3390/healthcare9050522
[35] Brunese, L., Mercaldo, F., Reginelli, A., Santone, A. (2020). Explainable deep learning for pulmonary disease and coronavirus COVID-19 detection from X-rays. Computer Methods and Programs in Biomedicine, 196: 105608. https://doi.org/10.1016/j.cmpb.2020.105608
[36] Panwar, H., Gupta, P.K., Siddiqui, M.K., Morales-Menendez, R., Singh, V. (2020). Application of deep learning for fast detection of COVID-19 in X-rays using nCOVnet. Chaos, Solitons & Fractals, 138: 109944. https://doi.org/10.1016/j.chaos.2020.109944
[37] Toğaçar, M., Cömert, Z., Ergen, B. (2021). Intelligent skin cancer detection applying autoencoder, MobileNetV2 and spiking neural networks. Chaos, Solitons & Fractals, 144: 110714. https://doi.org/10.1016/j.chaos.2021.110714
[38] Toğaçar, M., Ergen, B., Cömert, Z. (2021). Detection of weather images by using spiking neural networks of deep learning models. Neural Computing and Applications, 33(11): 6147-6159. https://doi.org/10.1007/s00521-020-05388-3
[39] Jeyasothy, A., Sundaram, S., Sundararajan, N. (2018). SEFRON: A new spiking neuron model with time-varying synaptic efficacy function for pattern classification. IEEE Transactions on Neural Networks and Learning Systems, 30(4): 1231-1240. https://doi.org/10.1109/TNNLS.2018.2868874
[40] Cao, C., Liu, F., Tan, H., et al. (2018). Deep learning and its applications in biomedicine. Genomics, Proteomics & Bioinformatics, 16(1): 17-32. https://doi.org/10.1016/j.gpb.2017.07.003
[41] Szegedy, C., Liu, W., Jia, Y., et al. (2015). Going deeper with convolutions. In Proceedings of the IEEE Conference on Computer Vision and Pattern Recognition, Boston, MA, pp. 1-9. https://doi.org/10.1109/CVPR.2015.7298594
[42] Huang, G., Liu, Z., Van Der Maaten, L., Weinberger, K.Q. (2017). Densely connected convolutional networks. Proceedings of the IEEE Conference on Computer Vision and Pattern Recognition, pp. 4700-4708. https://doi.org/10.1109/CVPR.2017.243
[43] He, K., Zhang, X., Ren, S., Sun, J. (2016). Deep residual learning for image recognition. In Proceedings of the IEEE Conference on Computer Vision and Pattern Recognition (CVPR), Vegas, NV, USA, pp. 770-778. https://doi.org/10.1109/CVPR.2016.90
[44] Szegedy, C., Vanhoucke, V., Ioffe, S., Shlens, J., Wojna, Z. (2016). Rethinking the inception architecture for computer vision. In Proceedings of the IEEE Conference on Computer Vision and Pattern Recognition, Vegas, NV, USA, pp. 2818-2826. https://doi.org/10.1109/CVPR.2016.308
[45] Simonyan, K., Zisserman, A. (2014). Very deep convolutional networks for large-scale image recognition. arXiv preprint arXiv:1409.1556.
[46] Zhang, X., Zhou, X., Lin, M., Sun, J. (2018). Shufflenet: An extremely efficient convolutional neural network for mobile devices. In Proceedings of the IEEE Conference on Computer Vision and Pattern Recognition, Lake City, UT, USA, pp. 6848-6856. https://doi.org/10.1109/CVPR.2018.00716
[47] Lobo, J.L., Del Ser, J., Bifet, A., Kasabov, N. (2020). Spiking neural networks and online learning: An overview and perspectives. Neural Networks, 121: 88-100. https://doi.org/10.1016/j.neunet.2019.09.004
[48] Tavanaei, A., Ghodrati, M., Kheradpisheh, S.R., Masquelier, T., Maida, A. (2019). Deep learning in spiking neural networks. Neural Networks, 111: 47-63. https://doi.org/10.1016/j.neunet.2018.12.002
[49] Wang, W., Pedretti, G., Milo, V., et al. (2019). Computing of temporal information in spiking neural networks with ReRAM synapses. Faraday Discussions, 213: 453-469. https://doi.org/10.1039/C8FD00097B
[50] Cohen, J.P., Morrison, P., Dao, L., Roth, K., Duong, T. Q., Ghassemi, M. (2020). COVID-19 image data collection: Prospective predictions are the future. arXiv preprint arXiv:2006.11988.
[51] Wang, X., Peng, Y., Lu, L., Lu, Z., Bagheri, M., Summers, R.M. (2017). Chestx-ray8: Hospital-scale chest x-ray database and benchmarks on weakly-supervised classification and localization of common thorax diseases. In Proceedings of the IEEE Conference on Computer Vision and Pattern Recognition (CVPR), Honolulu, HI, USA, pp. 2097-2106. https://doi.org/10.1109/CVPR.2017.369
[52] Ay, B., Yildirim, O., Talo, M., Baloglu, U.B., Aydin, G., Puthankattil, S.D., Acharya, U.R. (2019). Automated depression detection using deep representation and sequence learning with EEG signals. Journal of Medical Systems, 43(7): 205. https://doi.org/10.1007/s10916-019-1345-y
[53] Cömert, Z., Kocamaz, A.F. (2018). Fetal hypoxia detection based on deep convolutional neural network with transfer learning approach. In Computer Science On-line Conference, Vsetin, Czech Republic, pp. 239-248. https://doi.org/10.1007/978-3-319-91186-1_25
[54] Çınar, A., Yıldırım, M., Eroğlu, Y. (2021). Classification of pneumonia cell images using improved ResNet50 model. Traitement du Signal, 38(1): 165-173. https://doi.org/10.18280/ts.380117