Mua’ad Abu-Faraj* | Ziad. Alqadi | Mohammad Zubi
© 2022 IIETA. This article is published by IIETA and is licensed under the CC BY 4.0 license (http://creativecommons.org/licenses/by/4.0/).
OPEN ACCESS
The stage of calculating the features of digital images is considered as one of the most important stages used in the construction of recognition and discrimination systems, and the rudder of these systems depends on the values of the features obtained at this stage. In this research, we will discuss a new method for calculating the features of a digital image, regardless of its size or type. This method will be used practically morphological hit and miss operation to detect and count the appearance of certain objects in the image, and these counts will be used to form image features. The proposed method will be efficiently used to create a unique features vector for any image. The size of the features vector will be controlled by the number of structuring elements selected for each image, and for the image features database to be created the number of structuring elements that must be fixed. The proposed method will be capable of detecting any object or shape in the image, also this object must be specified by a structuring element which will be used in the hit and miss operation needed to seek for the object. It will be shown how this method will speed up the process of features extraction by decreasing the features extraction time compared with the K-means clustering method of features extraction. The selected objects can be changed, and the proposed method can be used to find the count of any selected object.
clustering methods, digital images, feature extraction, image recognition, morphology
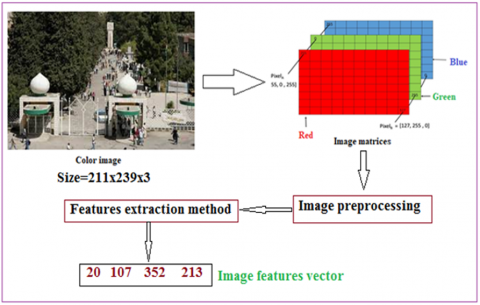
Digital images are considered as one of the most widely used types of data since they are used in many applications and vital systems such as facial recognition systems, fingerprint recognition systems, and many others [1-4]. The digital image is characterized by the ease of processing because it is represented by a three-dimensional matrix (one dimension for each of the red, green, and blue colors) and as shown in Figure 1, (Instead of using color image with huge size, we can use the image features vector, which contains a fixed small number of elements extracted from the image using a method of features extraction).
Figure 1. Color image representation
Applications that use color digital images require a high speed of implementation, but the size of the digital image is usually very large, which may lead to a negative impact on the performance of the system that uses the digital color image. This in turn requires searching for alternatives. The most important of which is the use of the features vector to represent the image and as it is shown in Figure 1.
Image features vector is an array of a fixed number of values, and this array can be used as an identifier or key to identify the image. To use the features vectors in the recognition system, the features vector must satisfy the following requirements [5-14]:
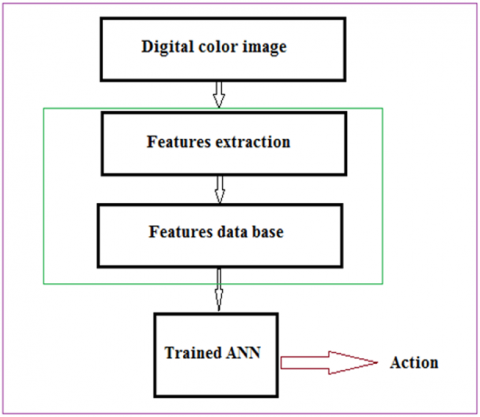
Figure 2. Features extraction phase in the color image recognition system
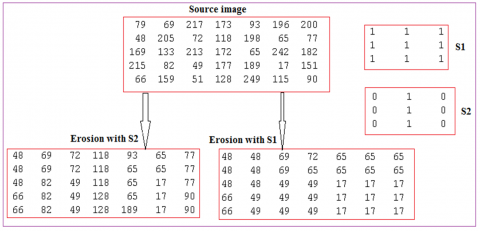
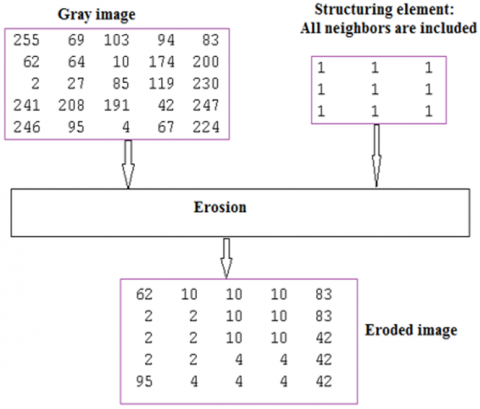
Figure 3. Erosion example
The stage of extracting the features of digital images and preserving these features is one of the important stages in building the discrimination system (see Figure 2) (extracted image features must be added to images features database, which will be used in a classification system, based for example on artificial neural network (ANN)), which in the future will affect its efficiency and the accuracy of reactions to this system [6, 7].
Color digital images are processed in a variety of ways. What we need in this research is the use of some simple operations, including the erosion process. The erosion process is considered as one of the most important basic digital image morphological operations, and it is implemented using a structuring element (SE) that is composed of an array of values of one or zero, where one indicates the entry of the neighbor into the executing process, while zero indicates the exclusion of the neighbor from the processing process [14, 15].
Erosion selects the minimum neighbor value from the neighbor's values which are included by the selected SE; Figure 3 shows an example of executing erosion operation (erosion uses the input image and the structuring elements and it returns the minimum neighbor value which is cover by the structuring element) [16-23].
The organization of this paper is as follows. Section 2 presents K-means clustering. Section 3 demonstrates the proposed approach. Implementation and experimental results are conducted in Section 4, followed by result analysis in Section 5. Section 6 provides the conclusions of this research paper.
The aim of this research is to provide a simple and easy to implement method for extracting the properties of any color digital image to reduce as much as possible the extraction time and retrieve unique properties for each image. So, those properties can be used as an identifier or key to the image.
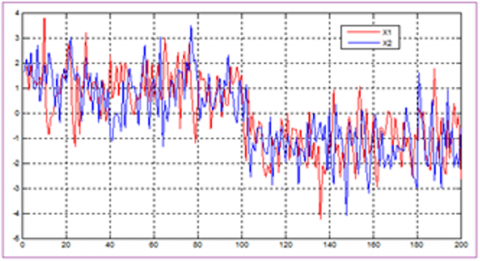
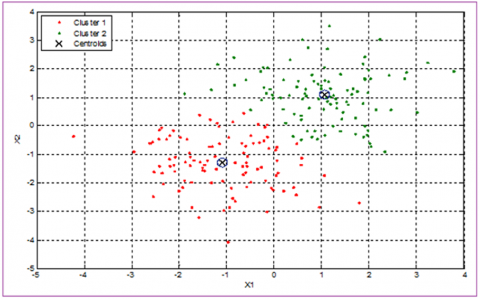
K-means clustering method is among the most important methods used to extract the features of a digital image, this method divides the pixel values into defined groups called clusters, the centroids, or the within clusters sums can be used to form the image features, Figure 4, and Figure 5 show an example input data set and the K-means clustering output, grouping the input data set to two clusters [7, 8].
Figure 4. Input data set example
Figure 5. Grouping data set into two clusters
Table 1. Passes 1 and 2
|
Input dataset |
Distance D1 |
Distance D2 |
Belongs to cluster |
New clusters centroids |
Distance D1 |
Distance D2 |
Belongs to cluster |
New clusters centroids |
|
12 |
8 |
4 |
2 |
C1=5 |
7 |
3.8900 |
2 |
C1=7.5 |
|
5 |
1 |
3 |
1 |
0 |
10.8900 |
1 |
||
|
7 |
3 |
1 |
2 |
2 |
8.8900 |
1 |
||
|
8 |
4 |
0 |
2 |
3 |
7.8900 |
1 |
||
|
40 |
36 |
32 |
2 |
35 |
24.1100 |
2 |
||
|
9 |
5 |
1 |
2 |
C2=15.89 |
4 |
6.8900 |
1 |
C2=25.75 |
|
6 |
2 |
2 |
2 |
1 |
9.8900 |
1 |
||
|
10 |
6 |
2 |
2 |
5 |
5.8900 |
1 |
||
|
30 |
26 |
22 |
2 |
25 |
14.1100 |
2 |
||
|
21 |
17 |
13 |
2 |
16 |
5.1100 |
2 |
Table 2. Passes 3 and 4
|
Input dataset |
Distance D1 |
Distance D2 |
Belongs to cluster |
New clusters centroids |
Distance D1 |
Distance D2 |
Belongs to cluster |
New clusters centroids |
|
12 |
4.5000 |
13.7500 |
1 |
C1=8.14 |
3.8600 |
18.3300 |
1 |
C1=8.14 No changes so stop |
|
5 |
2.5000 |
20.7500 |
1 |
3.1400 |
25.3300 |
1 |
||
|
7 |
0.5000 |
18.7500 |
1 |
1.1400 |
23.3300 |
1 |
||
|
8 |
0.5000 |
17.7500 |
1 |
0.1400 |
22.3300 |
1 |
||
|
40 |
32.5000 |
14.2500 |
2 |
31.8600 |
9.6700 |
2 |
||
|
9 |
1.5000 |
16.7500 |
1 |
C2=30.33 |
0.8600 |
21.3300 |
1 |
C2=30.33 No changes so stop |
|
6 |
1.5000 |
19.7500 |
1 |
2.1400 |
24.3300 |
1 |
||
|
10 |
2.5000 |
15.7500 |
1 |
1.8600 |
20.3300 |
1 |
||
|
30 |
22.5000 |
4.2500 |
2 |
21.8600 |
0.3300 |
2 |
||
|
21 |
13.5000 |
4.7500 |
2 |
12.8600 |
9.3300 |
2 |
K-means clustering can be implemented by applying the following steps [9, 10]:
Tables 1 and 2 show a worked example of clustering the input data set into 2 clusters with initial centroids equal to 4 and 8.
Hit and miss operation (HAMO) is one of the powerful morphological operations for finding objects and their locations in a digital image. HAMO can be defined entirely in terms of erosion only. HAMO is very useful for detecting specific objects that are intended to extract such as isolated points, two connected points, three connected points, crosses, squares, triangles, ridges, corners, junctions, and so on [24-28].
HAMO can be implemented using erosion operation. Erosion is a pixel operation which returns the minimum value from the neighbor's values which are covered by a structuring element, and this element contains zeros and ones; one means that the associated neighbor is covered as shown in the following example (see Figure 6).
Figure 6. Erosion operation
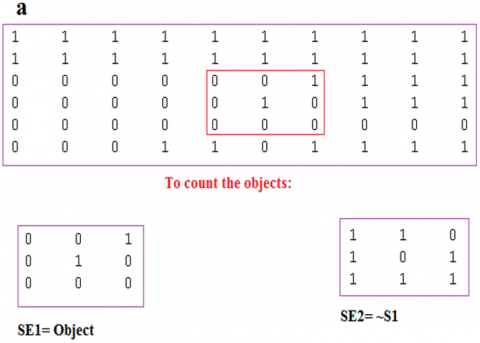
To detect any object in the color image we must follow the following steps:
● Select a structuring (SE) element which is equal to the object to be detected (see Figure 7).
Figure 7. Detecting an object equal to SE1
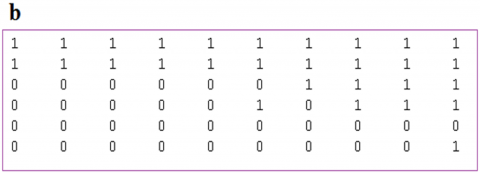
Figure 8. Eroding the image with SE1
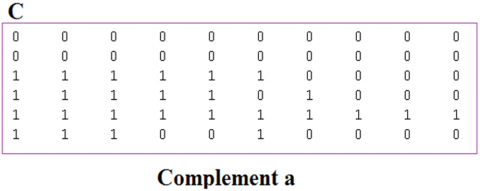
Figure 9. Finding the complement of the image
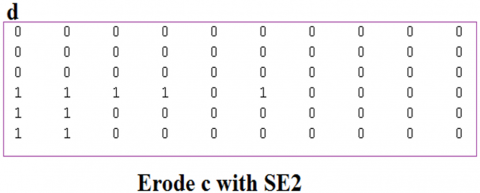
Figure 10. Eroding the complement of the image with SE2
● Erode the image with SE1 (see Figure 8).
● Find the complement of the image (see Figure 9).
● Erode the complement of the image with SE2 (see Figure 10).
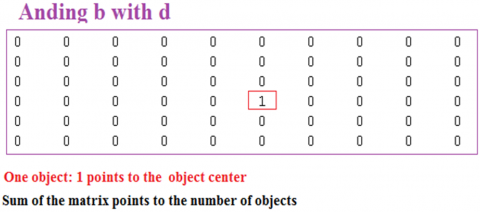
● Apply ANDing b and d (see Figure 11).
Figure 11. ANDing b and d
Figure 12. Counting the appearance of SE in the image
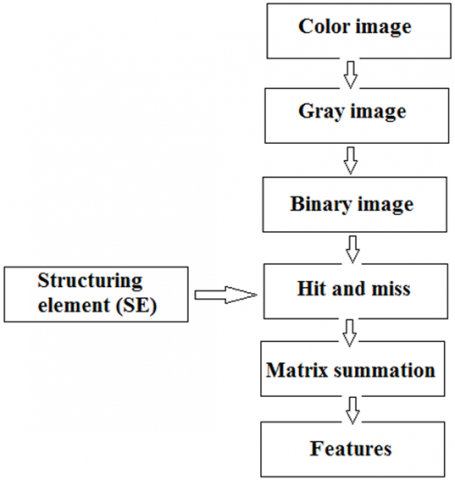
The proposed method can be implemented applying the following sequence of operations (see Figure 13).
Figure 13. Proposed method algorithm
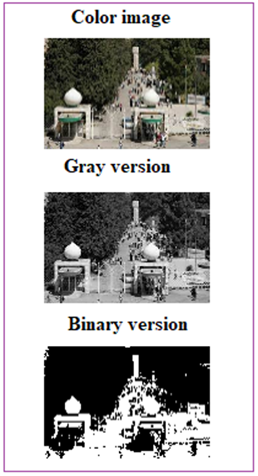
● Get the color image.
● Convert the color image to gray.
● Convert the gray image to binary image, Figure 14 shows a sample output of implementing these steps.
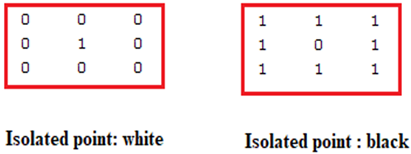
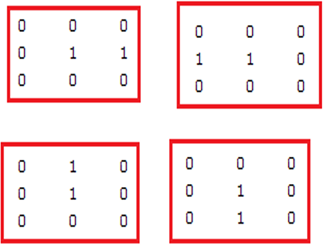
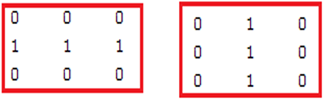
● Defining the required structuring elements needed to count the associated objects in the binary image, those objects are: isolated point with black color, isolated point with white color, two connected points, and three connected points, the structuring elements of the object are shown in Figures 14 to 17.
● Apply hit and miss operations using each structuring element: one time to count isolated points with black color, one time to count isolated points with white color, 4 times to count two connected points, two times to count three connected points.
● For each object apply summations of the obtained matrices to get the counts of the objects, this count can be used as a color image feature.
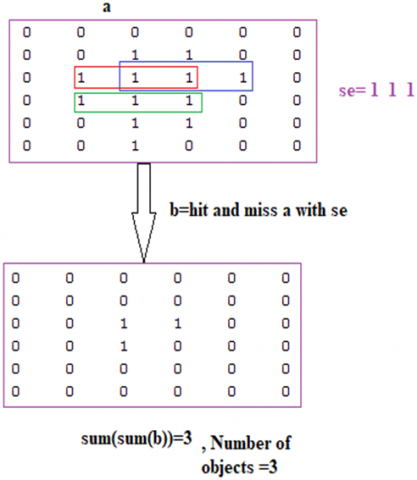
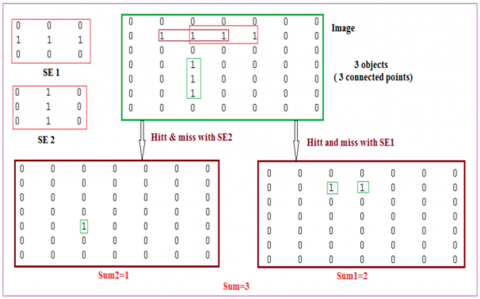
● Figure 18 illustrates the process of counting the object 3 connected points in an image.
Figure 14. Counting the appearance of SE in the image
Figure 15. SE to detectisolated points
Figure 16. SEs to detect two connected points
Figure 17. SEs to detect three connected points
Figure 18. Counting 3 connected points
12 different digital color images were selected; the proposed method Mat lab code was written and executed using an I5 processor with 8 G byte RAM, and Table 3 shows the obtained results for the proposed method.
The images were resized to a fix size (256x256x3), then the resized images were treated using the proposed method, Table 4 shows the obtained experimental results (big in size image can be resized to reduce the image size, and thus the features extraction will be reduced).
The same experiments were repeated using K-means clustering (4 clusters), Tables 5 and 6 show the obtained experimental results.
Table 3. Proposed method results
|
Image number |
Size |
Number of objects: features |
Extraction time |
|||
|
|
|
F1 |
F2 |
F3 |
F4 |
|
|
1 |
150849 |
108 |
44 |
184 |
133 |
0.010208 |
|
2 |
77976 |
1 |
104 |
7 |
5 |
0.008677 |
|
3 |
518400 |
138 |
75 |
241 |
111 |
0.066974 |
|
4 |
5140800 |
1778 |
1142 |
4101 |
2443 |
0.123867 |
|
5 |
4326210 |
1669 |
441 |
3595 |
1728 |
0.103873 |
|
6 |
122265 |
72 |
33 |
195 |
154 |
0.011536 |
|
7 |
518400 |
270 |
181 |
456 |
233 |
0.066975 |
|
8 |
150975 |
20 |
14 |
38 |
21 |
0.011429 |
|
9 |
150975 |
134 |
29 |
212 |
179 |
0.011977 |
|
10 |
151353 |
131 |
63 |
374 |
493 |
0.012879 |
|
11 |
1890000 |
148 |
173 |
274 |
94 |
0.067396 |
|
12 |
6119256 |
2067 |
2592 |
3988 |
1572 |
0.308409 |
Table 4. Resized image results using the proposed method
|
Image number |
Number of objects: features |
Extraction time |
|||
|
|
F1 |
F2 |
F3 |
F4 |
|
|
1 |
46 |
27 |
166 |
126 |
0.010880 |
|
2 |
3 |
48 |
7 |
4 |
0.013055 |
|
3 |
63 |
60 |
129 |
69 |
0.010306 |
|
4 |
147 |
48 |
282 |
157 |
0.010473 |
|
5 |
149 |
18 |
216 |
75 |
0.011198 |
|
6 |
40 |
26 |
170 |
92 |
0.011229 |
|
7 |
89 |
49 |
163 |
115 |
0.010087 |
|
8 |
13 |
11 |
42 |
14 |
0.016150 |
|
9 |
83 |
23 |
162 |
73 |
0.010260 |
|
10 |
83 |
50 |
287 |
324 |
0.010524 |
|
11 |
35 |
35 |
101 |
23 |
0.011849 |
|
12 |
48 |
23 |
54 |
4 |
0.013797 |
Table 5. K-means clustering method results
|
Image number |
Size |
Clusters centroids: features |
Extraction time |
|||
|
|
|
C1 |
C2 |
C3 |
C4 |
|
|
1 |
150849 |
95.2625 |
172.4380 |
29.7922 |
229.3986 |
0.100757 |
|
2 |
77976 |
61.1192 |
139.1432 |
139.1432 |
237.1591 |
0.161162 |
|
3 |
518400 |
191.3284 |
65.4241 |
126.9648 |
11.2267 |
0.486920 |
|
4 |
5140800 |
92.6524 |
55.4046 |
201.6369 |
133.4006 |
4.399189 |
|
5 |
4326210 |
139.9841 |
89.8256 |
47.7751 |
195.7610 |
4.085609 |
|
6 |
122265 |
96.5876 |
43.6232 |
186.7237 |
126.7675 |
0.046578 |
|
7 |
518400 |
82.9890 |
215.4922 |
5.9603 |
135.2944 |
0.168570 |
|
8 |
150975 |
164.0681 |
46.0186 |
110.1487 |
236.9639 |
0.081122 |
|
9 |
150975 |
100.9316 |
149.0943 |
199.6032 |
51.5795 |
0.090160 |
|
10 |
151353 |
77.3342 |
188.8618 |
141.2851 |
22.7651 |
0.062342 |
|
11 |
1890000 |
61.7788 |
109.3370 |
174.4789 |
237.1791 |
1.534606 |
|
12 |
6119256 |
223.9887 |
67.6085 |
126.3537 |
147.3824 |
2.301860 |
Table 6. Resized image results using the K-means clustering method
|
Image number |
Clusters centroids: features |
Extraction time |
|||
|
|
C1 |
C2 |
C3 |
C4 |
|
|
1 |
32.6369 |
97.5709 |
172.8215 |
229.5397 |
0.102400 |
|
2 |
65.8860 |
144.1301 |
236.8711 |
202.4004 |
0.163203 |
|
3 |
11.0746 |
65.1815 |
187.7637 |
125.0980 |
0.124112 |
|
4 |
196.2781 |
89.1884 |
52.1862 |
128.6764 |
0.081113 |
|
5 |
95.6350 |
56.3448 |
147.6627 |
198.1477 |
0.177771 |
|
6 |
180.1088 |
127.0158 |
97.1396 |
44.2920 |
0.059601 |
|
7 |
5.5665 |
81.7954 |
133.6447 |
213.2086 |
0.119997 |
|
8 |
236.6002 |
109.5226 |
163.2401 |
45.7687 |
0.152000 |
|
9 |
52.9624 |
101.3140 |
149.0187 |
199.2455 |
0.091534 |
|
10 |
74.7323 |
185.7610 |
22.9624 |
138.2181 |
0.162757 |
|
11 |
177.4876 |
112.6088 |
63.4931 |
236.7225 |
0.071181 |
|
12 |
174.8120 |
233.8651 |
136.0829 |
78.2602 |
0.063646 |
From the obtained experimental results, we can see the following facts:
● K-means clustering method provides a good ability to form image features vectors, each of them satisfies the requirements.
● We cannot predict the extraction time in K-means clustering, because it depends on the number of executed passes and the image size.
● Resizing the image to a smaller size reduces the extraction time in K-means clustering and in the proposed method.
● The extraction time in the proposed method depends on the image size, and reducing the image size by resizing will reduce the extraction time.
● The proposed method provides a unique features vector for each image.
The proposed method speeds up the process of features extraction, thus enhancing the performance of the digital image features extraction process; this can be seen in Tables 7 and 8.
Table 7. Speedup of the proposed method using source images
|
Image number |
Proposed method extraction time T1 (second) |
K-means clustering method extraction time T2 (second) |
Speedup of the proposed method (T2/T1) |
|
1 |
0.010208 |
0.100757 |
9.8704 |
|
2 |
0.008677 |
0.161162 |
18.5735 |
|
3 |
0.066974 |
0.486920 |
7.2703 |
|
4 |
0.123867 |
4.399189 |
35.5154 |
|
5 |
0.103873 |
4.085609 |
39.3327 |
|
6 |
0.011536 |
0.046578 |
4.0376 |
|
7 |
0.066975 |
0.168570 |
2.5169 |
|
8 |
0.011429 |
0.081122 |
7.0979 |
|
9 |
0.011977 |
0.090160 |
7.5278 |
|
10 |
0.012879 |
0.062342 |
4.8406 |
|
11 |
0.067396 |
1.534606 |
22.7700 |
|
12 |
0.308409 |
2.301860 |
7.4637 |
|
Average |
13.9014 |
||
Table 8. Speedup of the proposed method using resized images
|
Image number |
Proposed method extraction time T1 (second) |
K-means clustering method extraction time T2 (second) |
Speedup of the proposed method (T2/T1) |
|
1 |
0.010880 |
0.102400 |
9.4118 |
|
2 |
0.013055 |
0.163203 |
12.5012 |
|
3 |
0.010306 |
0.124112 |
12.0427 |
|
4 |
0.010473 |
0.081113 |
7.7450 |
|
5 |
0.011198 |
0.177771 |
15.8752 |
|
6 |
0.011229 |
0.059601 |
5.3078 |
|
7 |
0.010087 |
0.119997 |
11.8962 |
|
8 |
0.016150 |
0.152000 |
9.4118 |
|
9 |
0.010260 |
0.091534 |
8.9214 |
|
10 |
0.010524 |
0.162757 |
15.4653 |
|
11 |
0.011849 |
0.071181 |
6.0073 |
|
12 |
0.013797 |
0.063646 |
4.6130 |
|
Average |
9.9332 |
||
Any shape or object in a digital image can be specified by a ones and zeros to form a 2D matrix. This matrix can be used as a structuring element to form an input to the morphological operation which can return the center of this object.
A new method of color image features extraction was introduced and implemented using various color images. The proposed method is simple, and it can be used for any image of any size and with any type (color, gray, binary). It is based on using morphological hit and miss operation to detect and count defined objects in the image, and those counts can be used to form a unique features vector for the image.
The proposed method is very efficient, and it minimizes the features extraction time. Compared with the K-means method, it will speed up the process of features extraction at least 10 times.
[1] Kavya, R. (2015). Feature extraction technique for robust and fast visual tracking: A typical review. International Journal of Emerging Engineering Research and Technology, 3(1): 98-104.
[2] Kodituwakku, S.R., Selvarajah, S. (2011). Comparison of color features for image retrieval. Indian Journal of Computer Science and Engineering, 1(3): 207-211.
[3] Umamaheswari, C., Bhavani, R., Sikamani, K. (2018). Texture and color feature extraction from ceramic tiles for various flaws detection classification. International Journal on Future Revolution in Computer Science & Communication Engineering, 4(1): 169-179.
[4] Abu-Faraj, M.M., Aldebei, K., Alqadi, Z.A. (2022). Simple, efficient, highly secure, and multiple purposed method on data cryptography. Traitement du Signal, 39(1): 173-178. https://doi.org/10.18280/ts.390117
[5] Lingayat, N.S., Tarambale, M.R. (2013). A computer based feature extraction of lung nodule in chest x-ray image. International Journal of Bioscience, Biochemistry and Bioinformatics, 3(6): 624-629. https://doi.org/10.7763/IJBBB.2013.V3.289
[6] Li, Z., Han, X., Wang, L.Y., Zhu, T.Y., Yuan, F.T. (2020). Feature extraction and image retrieval of landscape images based on image processing. Traitement du Signal, 37(6): 1009-1018. https://doi.org/10.18280/ts.370613
[7] Abu-Faraj, M., Zubi, M. (2020). Analysis and implementation of kidney stones detection by applying segmentation techniques on computerized tomography scans. Italian Journal of Pure and Applied Mathematics, 43: 590-602.
[8] Bertin, M., Atanassova, I. (2014). A study of lexical distribution in citation contexts through the IMRaD standard. In Proceedings of the First Workshop on Bibliometric-enhanced Information Retrieval co-located with 36th European Conference on Information Retrieval (ECIR 2014), Amsterdam, Netherlands, pp. 5-12.
[9] Bertin, M., Atanassova, I. (2015). Factorial correspondence analysis applied to citation contexts. In 2nd International Workshop on Bibliometric-enhanced Information Retrieval (BIR2015) at the 37th European Conference on Information Retrieval (ECIR-2015), Vienne, Austria, pp. 22-29.
[10] Kanungo, T., Mount, D.M., Netanyahu, N.S., Piatko, C. D., Silverman, R., Wu, A.Y. (2002). An efficient k-means clustering algorithm: analysis and implementation. in IEEE Transactions on Pattern Analysis and Machine Intelligence, 24(7): 881-892. https://doi.org/10.1109/TPAMI.2002.1017616
[11] Sinaga, K.P., Yang, M. (2020). Unsupervised k-means clustering algorithm. IEEE Access, 8: 80716-80727. https://doi.org/10.1109/ACCESS.2020.2988796
[12] Bertin, M., Atanassova, I., Larivire, V., Gingras, Y. (2016). The invariant distribution of references in scientific papers. Journal of the Association for Information Science and Technology, 67(1): 164-177. https://doi.org/10.1002/asi.23367
[13] Griffiths, T.L., Steyvers, M., Blei, D.M., Tenenbaum, J.B. (2004). Integrating topics and syntax. Advances in Neural Information Processing Systems 17 (NIPS 2004), 4: 537-544.
[14] Kintigh, K.W., Ammerman, A.J. (1982). Heuristic approaches to spatial analysis in archaeology. American Antiquity, 47(1): 31-63. https://doi.org/10.2307/280052
[15] Lucas, C., Nielsen, R.A., Roberts, M.E., Stewart, B.M. (2015). Computer-assisted text analysis for comparative politics. Political Analysis, 4(23): 254-277. https://doi.org/10.1093/pan/mpu019
[16] Roberts, M.E., Stewart, B.M., Airoldi, E.M. (2016). A model of text for experimentation in the social sciences. Journal of the American Statistical Association, 111(515): 988-1003. https://doi.org/10.1080/01621459.2016.1141684
[17] Roberts, M.E., Stewart, B.M., Tingley, D. (2014). STM: An R package for structural topic models. Journal of Statistical Software, 91(2): 1-40. https://doi.org/10.18637/jss.v091.i02
[18] Zhao, C. (2010). A new vectorial ordering for color morphology based on marginal ordering. In 2010 5th International Conference on Computer Science & Education, Hefei, China, pp. 1769-1772. https://doi.org/10.1109/ICCSE.2010.5593836
[19] Guo, X., Guo, B. (2009). Color image morphology based on distances in the HSI color space. In 2009 ISECS International Colloquium on Computing, Communication, Control, and Management, Sanya, China, pp. 264-267. https://doi.org/10.1109/CCCM.2009.5267902
[20] Gonzalez, P., Cabezas, V., Mora, M., Cordova, F., Vidal, J. (2010). Morphological color images processing using distance-based and lexicographic order operators. In 2010 XXIX International Conference of the Chilean Computer Science Society, Antofagasta, Chile, pp. 258-264. https://doi.org/10.1109/SCCC.2010.26
[21] Domingo, J., Benavent, X., Vegara, F., Pelechano, J. (2005). A new approach for image color morphology. Tech. Rep., Institute of Robotics, University of Valencia, Valencia, Spain.
[22] Asad, A.S.N., Shayeb, I., Jaber, Q., Ayyoub, B., Alqadi, Z., Sharadqh, A. (2019). Creating a stable and fixed features array for digital color image. International Journal of Computer Science and Mobile Computing, 8(8): 50-62.
[23] Abu-Faraj, M.A., Al-Hyari, A., Alqadi, Z. (2022). A complex matrix private key to enhance the security level of image cryptography. Symmetry, 14(4): 664. https://doi.org/10.3390/sym14040664
[24] Islam, M.A., Murray, B., Buck, A., Anderson, D.T., Scott, G.J., Popescu, M., Keller, J. (2020). Extending the morphological hit-or-miss transform to deep neural networks. IEEE Transactions on Neural Networks and Learning Systems, 32(11): 4826-4838. https://doi.org/10.1109/TNNLS.2020.3025723
[25] Hirata, N.S., Papakostas, G.A. (2021). On machine-learning morphological image operators. Mathematics, 9(16): 1854. https://doi.org/10.3390/math9161854
[26] Abu-Faraj, M., Al-Hyari, A., Alqadi, Z. (2022). Experimental analysis of methods used to solve linear regression models. CMC-Computers, Materials & Continua, 72(3): 5699-5712. https://doi.org/10.32604/cmc.2022.027364
[27] Abu-Faraj, M., Alqadi, Z. (2021). Rounds reduction and blocks controlling to enhance the performance of standard method of data cryptography. International Journal of Computer Science and Network Security (IJCSNS), 21(12): 648-656.
[28] Abu-Faraj, M., Al-Hyari, A., Aldebei, K., Al-Ahmad, B., Alqadi, Z. (2022). Rotation left digits to enhance the security level of message blocks cryptography. IEEE Access, 10: 69388-69397. https://doi.org/10.1109/ACCESS.2022.3187317