Wenzhe Deng | Feiyang Zhou | Zheng Gong | Yongjie Cui | Li Liu | Qian Chi*
© 2022 IIETA. This article is published by IIETA and is licensed under the CC BY 4.0 license (http://creativecommons.org/licenses/by/4.0/).
OPEN ACCESS
To achieve early recognition of lettuce diseases, this paper combines the technology of image processing and the classifier of support vector machine (SVM) to identify and classify two common diseases of hydroponic lettuce: leafroll and brown blotch disease (BBD). Specifically, the authors designed programs for the acquisition and preprocessing, segmentation, and feature extraction of hydroponic lettuce images, and developed an identification program for hydroponic lettuce diseases based on the SVM. On this basis, the color, shape, and texture features were extracted from these images, and adopted as the training set of the SVM. Then, the identification model for hydroponic lettuce diseases was trained with the radial kernel function as the core, and applied to identify the different types of diseases. In total, 1,800 images were selected as samples, and subjected to denoising, enhancement, segmentation, and feature extraction. The leaf features of hydroponic lettuce were extracted, and used to establish the SVM-based disease identification model. The experimental results on the test set show that the identification model could recognize 93% of hydroponic lettuce diseases, achieving an excellent identification effect.
hydroponic lettuce, leafroll, brown blotch disease (BBD), support vector machine, image processing
Soilless cultured lettuce, a global vegetable, is more and more favored in China. In recent years, soilless cultured lettuce has entered the phase of industrialized production [1]. Brown blotch disease (BBD) are two common yet serious diseases during the growth of hydroponic lettuce. In severe cases, the leaves of the plant will die of the diseases. For hydroponic lettuce, the long-term accumulation of the nutrient solution will generate harmful substances. The ensuring rise of the disease probability would severely affect the quality and yield of hydroponic lettuce. Therefore, it is important to prevent the accumulation in a timely manner. Traditionally, BBD and leafroll are recognized through manual observation, which is inaccurate, time-consuming, and laborious. Many scholars and experts have probed into image processing extensively, trying to automatically identify plant diseases [2-10].
Barbedo [11] realized the automatic recognition of plant diseases based on manually designed features. Firstly, the images were preprocessed to separate the lesions from background. The lesion features were artificially selected and extracted, including color, texture, and shape. Based on the manually extracted features, the diseases were recognized by a classifier. However, their approach requires complex early processing, and faces some limitations in the actual recognition of crop diseases. Mohanty et al. [12] extracted disease features through deep feature learning. After acquiring image data, the image features were extracted, the characteristic parameters were configured, and the samples were trained based on these parameters. Then, the images extracted by the deep learning-based disease recognition approach were compared with actual images. The comparison shows that the approach boasts advantages like simple background, clear leaf contours, and obvious lesions. Nevertheless, the approach cannot separate plant disease images from background images clearly in actual conditions, and have limited recognition effects. Zhang et al. [13] segmented disease images by the k-means clustering (KMC) algorithm. The Otsu’s dynamic thresholding was adopted to convert the lesion features into binary images. Through step-by-step segmentation, the soil, weeds, and shadows were removed from the image background to complete the segmentation of plant leaf diseases. The segmentation rate surpassed 95%. Their strategy can effectively recognize the leaf lesions in a complex background, but does not perform so well when the leaf lesions are small and scattered across leaves. Ren et al. [14] designed a segmentation algorithm for plant leaf lesions. The plant leaves were mainly segmented through super pixel preprocessing, manifold sorting, and ultra-green feature segmentation. The algorithm can effectively segment targets from the background, and extract lesion features precisely and completely. However, the time efficiency is not very high, due to the introduction of constraints and the iterative algorithm.
Based on support vector machine (SVM), this paper proposes a disease identification approach for hydroponic lettuce. Specifically, the color, shape, and texture features were extracted from hydroponic lettuce images, and used to train the SVM. The trained SVM was applied to classify the data on disease features, aiming to recognize diseases accurately and easily. The proposed approach improves the effectiveness for leaf disease identification, prevention, and treatment of hydroponic lettuce.
The SVM [15] is a common binary classifier, which is suitable for data modeling of small nonlinear and high-dimensional samples. This classifier has advantages in convergence, solution optimization, and generalization [16]. To classify features, the SVM solves the maximum-margin interval in the feature space. According to the features of hydroponic lettuce data following different distributions, the SVM determines the type of each hydroponic lettuce sample by finding the hyperplane with the largest spacing from the two data clusters [17].
Drawing on the data features of hydroponic lettuce leaves, when the characteristic data of the leaves are linearly separable, the SVM algorithm mainly generates a separating hyperplane for the two datasets, which divides the two datasets into two parts. This separating hyperplane is called the classification decision function: w*x+b=0, where w is the normal vector, and b is the intercept. The separating hyperplane classifies the image data in the feature space into positive and negative samples. The positive samples refer to the data in the same direction of the normal vector, and the negative samples refer to the data in the opposite direction f the normal vector. Here, the normal hydroponic lettuce images are taken as positive samples, and the hydroponic lettuce images containing leafroll and BBD are treated as negative samples. The characteristic data were extracted from the positive and negative samples. Based on the SVM, the disease identification and classification of hydroponic lettuce leaves was converted into a linear classification problem. According to the characteristic data of hydroponic lettuce images, the type of diseases on hydroponic lettuce leaves was judged and classified by the classifier.
Nevertheless, there are often more than one hyperplane that separate two datasets. The separating hyperplanes may be able to distinguish between the two datasets. But the distances from the planes to the two datasets are purely random. It is necessary to find the optimal separating hyperplane for the two datasets by the maximum margin principle, such that the classification decision function can separate the two datasets, and remain as far from the two datasets as possible. Let w be the distance between the straight line for classifying the two datasets and a dataset; b be the intercept of the line. Then, the function with the optimal constraint can be constructed to find the optimal values of w* and b*, before solving the linear SVM optimization problem. The function with the optimal constraint can be expressed as:
${{\text{f}}_{t\arg et}}\text{=}\underset{w,b}{\mathop{\min }}\,\frac{1}{2}{{\left| \left| w \right| \right|}^{2}}$ (1)
${{y}_{i}}(w\centerdot {{x}_{i}}+b)-1\ge 0,i=1,2,3...,N$ (2)
The corresponding separating hyperplane can be expressed as:
$w^{*} \cdot x+b^{*}=0$ (3)
The classification decision function can be expressed as:
$f(x)=\operatorname{sign}\left(w^{*} \cdot x+b^{*}\right)$ (4)
The classification decision is usually realized by the dual algorithm. The optimal solution is the classification decision function, whose straight line is of equal distance to the positive dataset and the negative dataset. This approach works well on linearly separable problems.
Considering the nonlinearity of characteristic data on hydroponic lettuce leaves, the basic idea is to transform the calculation space of the input variables, and map the nonlinear inner product into the high-dimensional feature space. In this way, the nonlinear problem is converted into a linear problem, which can be solved easily. That is, the optimization of the separating hyperplane is transformed into a constrained optimization problem. Specifically, the original problem can be solved as a dual problem, using Lagrange duality. Next, the radial kernel function can be introduced to turn the dual problem into a constraint optimization problem, before finding the optimal solution. Adding a slack variable ξ>0 to each sample (xi, yi), the objective function of the linear SVM optimization problem can be converted into:
${{f}_{t\arg et}}=\frac{1}{2}{{\left| \left| w \right| \right|}^{2}}+C\sum\limits_{i=1}^{N}{{{\xi }_{i}}}$ (5)
where, C>0 is the penalty parameter that determines the penalty against incorrect classification. For the objective function of minimization $\frac{1}{2}|| w||^{2}+C \sum_{i=1}^{N} \xi_{i}$, the harmonic coefficient C needs to minimize the incorrectly classified samples, in order to minimize the value of $\frac{1}{2}|| w||^{2}$. This is what is called the method of linear SVM training.
Here, the color, shape, and texture features of hydroponic lettuce leaf images are taken as the initial training samples of the SVM, and the radial kernel function is adopted as the training model of the SVM to obtain the optimal classification model for type identification of hydroponic lettuce. Next, the test set of hydroponic lettuce disease features was imported to the classification model to test the classification effect, and compute the classification accuracy of hydroponic lettuce diseases.
3.1 Image acquisition
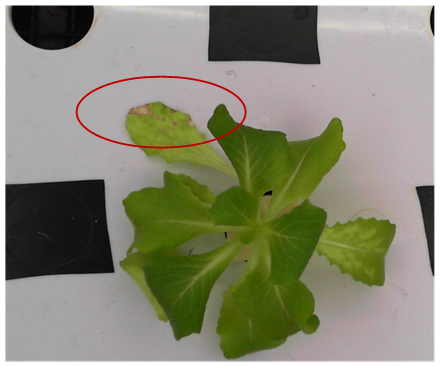
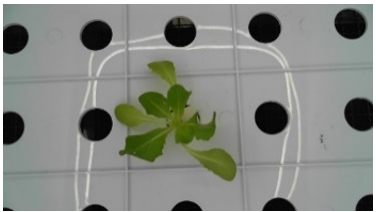
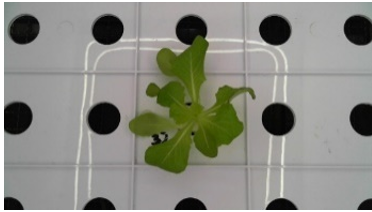
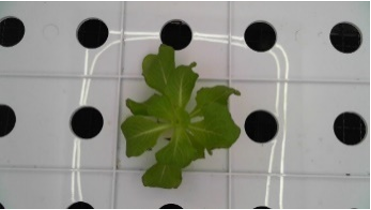
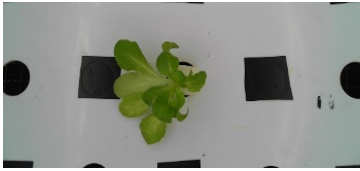
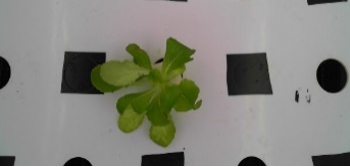
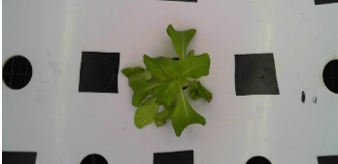
(a) Early phase image on Plant 1 with potassium deficiency
(b) Middle phase image on Plant 1 with potassium deficiency
Figure 1. An example image
Before the experiments, the hydroponic lettuce was planted and cultured in the greenhouses of the Institute of Water-Saving Agriculture in Arid Areas of China (IWSA), Northwest A&F University. The images of hydroponic lettuce in three different growth conditions, namely, normal lettuce, leafroll lettuce, and BBD lettuce, were captured by a complementary metal oxide semiconductor (CMOS) camera. The images cover hydroponic lettuce leaves in the early, middle, and late growth phases. Some of the images are shown in Figure 1.
3.2 Sample library
A total of 2,400 hydroponic lettuce images were collected. Among them, 600 leaf images of normal hydroponic lettuce, 600 leaf images of leafroll hydroponic lettuce, and 600 leaf images of BBD hydroponic lettuce were selected as samples.
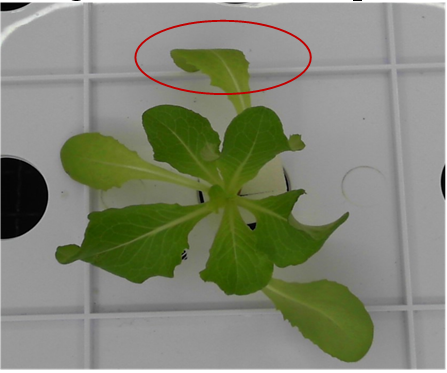
To facilitate batch processing, the image size was unified as 1,920×1,080. During collection and transmission, the image data may be disturbed by noises [18]. To prevent the image quality from being reduced by random noises, the median filter was adopted to denoise the images, so that the disease features of the images are not covered by the noises, making it easier to extract the disease features from the images accurately and smoothly. Figure 2 shows the denoised images.
Figure 2. Effect of median filtering
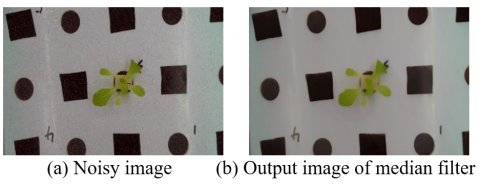
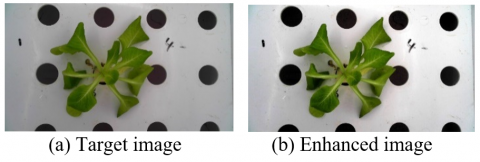
Figure 3. Result of histogram equalization
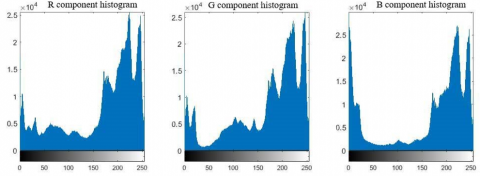
To better extract the features of lettuce diseases, the ultra-green segmentation algorithm was employed to segment the leaves from the background. Take the leaves of the normal hydroponic lettuce for example. By observing the plant leaves, it can be learned that, for the same pixel of the green part of a leaf image, the G component is always greater than the R component and the B component. Therefore, the plant leaves can be easily extracted by increasing the weight of the G channel of a hydroponic lettuce leaf image. This is exactly the idea of the ultra-green segmentation algorithm [19].
Figure 5 displays the effect of the ultra-green segmentation algorithm. It is clear that the algorithm can accurately segment the hydroponic lettuce leaves, while preserving the texture details of the leaves.
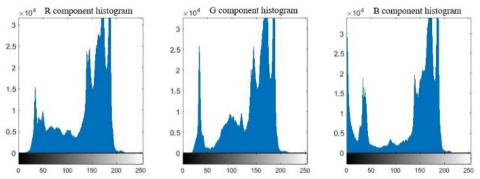
The disease images may be distorted by the variation in light intensity, lesions, and contrast. To ensure the accurate feature extraction of hydroponic lettuce diseases, the images were subjected to histogram equalization. The pixel intensity and contrast were adjusted in the sample space. Thus, the hydroponic lettuce images became more balanced, and the leaf lesions were highlighted. Figure 3 shows the enhanced images, and Figure 4 shows the red-green-blue (RGB) statistics.
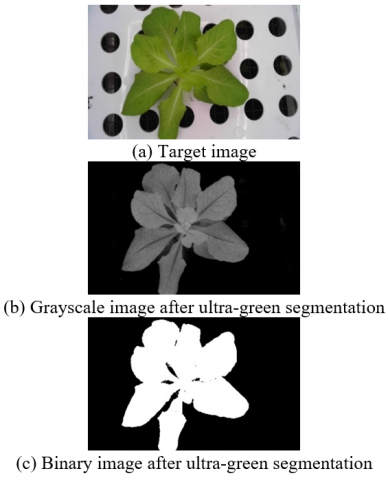
Figure 6 shows the flow of feature extraction of hydroponic lettuce leaves. Color, shape, and texture are three common kinds of disease features of plant leaves. The color features indicate the color property of the leaf disease, the shape features represent the contour and lesion size of the leaf disease, and the texture features suggest the coarseness of the leaves.
(a) RGB historgram of the target image
(b) RGB historgram of the enhanced image
Figure 4. RGB grayscale expansion of image enhancement
Figure 5. Effect of the ultra-green segmentation algorithm
Figure 6. Flow of image feature extraction
As mentioned before, the extracted data on the color, shape, and texture features serve as the initial samples for SVM training. Hence, it is important to extract these three features.
4.1 Color extraction
The color feature of hydroponic lettuce images refers to the feature of each pixel on a leaf image in the color space. This paper chooses the hue-saturation-value (HSV) model, which is not greatly affected by the variation in light intensity. The HSV color space is good at color representation. The RGB chromatic information was extracted from each feature image. Then, the HSV color model was established for the model, according to the transform relationship between RGB and HSV. Finally, the color moment of each order of the H, S, and V channels was calculated, and the data features were analyzed. The transform relationship between RGB and HSV is as follows: The first-order moment of H, S, and V is the mean grayscale of the leaf area in the gray image after ultra-green transform. The second-order moment of H, S, and V is the quadratic difference of grayscale of the leaf area in the gray image after ultra-green transform. The third-order moment of H, S, and V is the cubic difference of grayscale of the leaf area in the gray image after ultra-green transform. These three moments constitute the features of image color moments.
$H\text{=}\left\{ \begin{align} & {{0}^{{}^\circ }}\text{ ,}if\max =\min \\ & {{60}^{{}^\circ }}\times \frac{g-b}{\max -\min }+{{0}^{{}^\circ }},if\max =R\text{ }and\text{ }G\ge B \\ & 60\times \frac{g-b}{\max -\min }+{{360}^{{}^\circ }},if\max =R\text{ }and\text{ }G<B \\ & 60\times \frac{g-b}{\max -\min }+{{120}^{{}^\circ }},if\max =G \\& 60\times \frac{g-b}{\max -\min }+{{240}^{{}^\circ }},if\max =B \\\end{align} \right.$ (6)
$S=\left\{ \begin{align} & 0,\text{ }if\text{ max=min} \\ & \frac{\max \text{-}\min }{\max }\text{=}1\text{=}\frac{\min }{\max },\text{ }otherwise \\\end{align} \right.$ (7)
$V=\max $ (8)
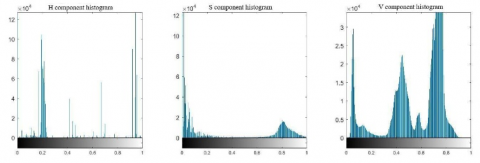
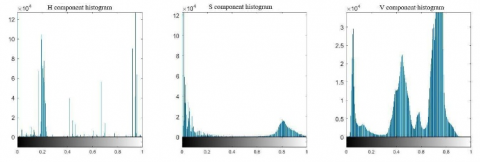
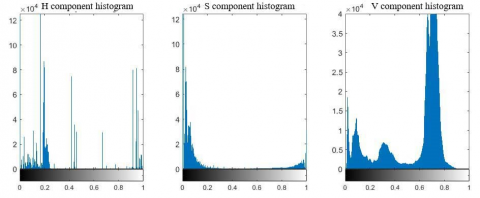
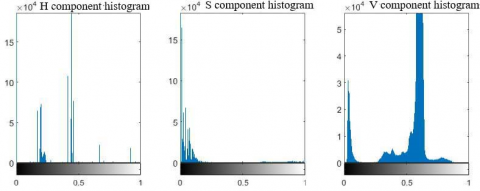
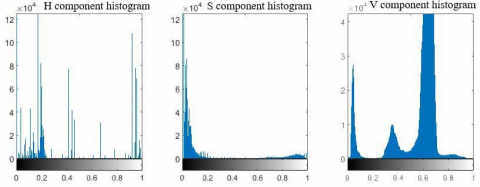
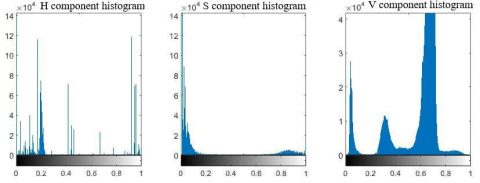
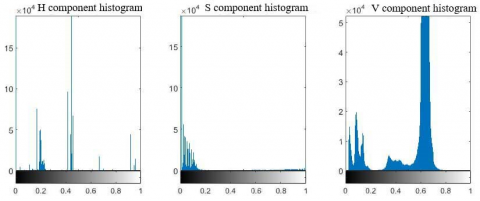
Figure 7 shows the histograms of the H, S, and V channels for normal, leafroll, and BBD hydroponic lettuce leaves after preprocessing and super pixel segmentation.
4.2 Shape extraction
The shape of hydroponic lettuce leave images provides an important basis for analyzing and studying the disease severity of hydroponic lettuce. The common shape features include the rectangularity, circularity, complexity, and elongation of the leaves.
The rectangularity describes the degree of deviation of the lesion from the minimum bounding box. The circularity reflects the proximity of the lesion to a circle. The complexity illustrates the dispersion of lesions. The elongation tells about the degree of extension of the lesion.
(a) Normal leaves
(b) Leafroll leaves
(c) BBD leaves
Figure 7. Histograms of H, S, and V distirbutions for three types of hydroponic lettuce leaves
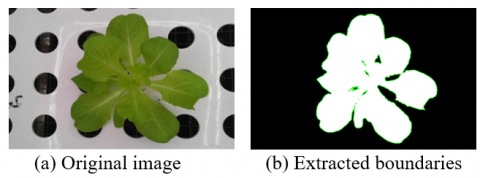
Figure 8. Boundary features extracted from hydroponic lettuce leaves
Using the MATLAB, the bwboundaries function (B=bwboundary (BW)) was called to extract the boundaries of the continuous areas from each hydroponic lettuce leaf image; the bwlabel function (L=bwlabel(BW, n)) was called to number the extracted continuous areas; the regionpropos function (STATS=regionprops(L, properties)) was called to extract the shape features of the continuous areas. The rectangularity, circularity, complexity, and elongation of the leaves were saved in a form. Figure 8 shows the boundary features extracted from hydroponic lettuce leaves.
4.3 Texture extraction
The texture of hydroponic lettuce images plays a significant role in analyzing and judging the severity of leafroll and BBD of hydroponic lettuce. The leaves with the two diseases have different texture features: The textures of the leaves with BBD are lighter and less coarse than those with leafroll.
The texture of hydroponic lettuce images can be illustrated by the grayscale variation. The common practice is to generate a grayscale cooccurrence matrix [20], which visually displays the coarseness, color depth, and similarity of images. Firstly, the grayscale of the ultra-green gray image of hydroponic lettuce, which has gone through ultra-green segmentation, was reduced, highlighting the texture of the image. Next, the grayscale cooccurrence matrix was produced, and the texture feature was computed according to the values on the diagonal of the matrix. If the diagonal values are large, the image texture changes gently; if the diagonal values are small, and the adjacent values are large, the image changes rapidly.
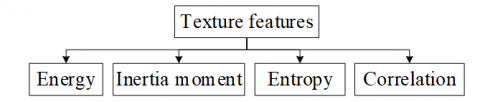
Generally, the texture features of images are quantified by the energy, inertia moment, entropy, and correlation of the grayscale cooccurrence matrix in different directions. Each element in the matrix is divided by the sum of all elements in the matrix, producing a probability matrix. Let P be the normalized frequency matrix of the grayscale cooccurrence matrix; i and j be the grayscale of two scales that simultaneously appear in two pixels along a direction. Then, the probability of such two pixels can be denoted by P(i, j). This paper chooses to represent the texture features of each hydroponic lettuce image with the values of the grayscale cooccurrence matrix in the direction of θ=0°, and with the step length of d=1. Figure 9 shows the structure of texture features.
Figure 9. Structure of texture features
The energy (Ene) of the grayscale cooccurrence matrix reflects the fineness and coarseness of textures in the hydroponic lettuce image:
$Ene=\sum\limits_{i}{\sum\limits_{j}{P{{(i,j\left| d,\theta \right.)}^{2}}}}$
The inertia moment (Con) of the grayscale cooccurrence matrix reflects the depth of textures in the hydroponic lettuce image:
$Con=\sum\limits_{i}{\sum\limits_{j}{{{(i-j)}^{2}}P(i,j\left| d,\theta ) \right.}}$
The entropy (Ent) of the grayscale cooccurrence matrix reflects the size of textures in the hydroponic lettuce image:
$Ent=-\sum\limits_{i}{\sum\limits_{j}{P(i,j){{\log }_{2}}}}P(i,j\left| d,\theta \right.)$
The more stochastic the grayscale, the more complex the image, and the greater the entropy.
The correlation (Cor) of the grayscale cooccurrence matrix reflects the row and column simularities of textures in the hydroponic lettuce image:
$Cor=\left[ \sum\limits_{i}{\sum\limits_{j}{(ij)P(i,j\left| d,\theta )-{{\mu }_{x}}{{\mu }_{y}} \right.}} \right]/{{\sigma }_{x}}{{\sigma }_{y}}$
where, μ and σ are mean and standard deviation, respectively.
4.4 Disease feature analysis
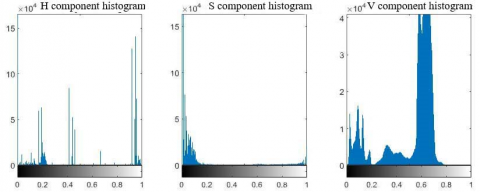
The HSV color moment method was adopted to extract the color features of leafroll hydroponic lettuce. The HSV histograms and color moments are displayed in Figure 10.
(a) Leafroll leaves in early phase
(b) Leafroll leaves in middle phase
(c) Leafroll leaves in late phase
Figure 10. Color histograms of leafroll hydroponic lettuce
Table 1 shows the statistics on color moments of leafroll hydroponic lettuce.
Figure 11 shows the boundary features extracted from leafroll hydroponic lettuce.
Table 2 shows the statistics on shape features of leafroll hydroponic lettuce.
After ultra-green segmentation, the gray image of leafroll hydroponic lettuce was subjected to texture analysis. Table 3 shows the relevant statistics.
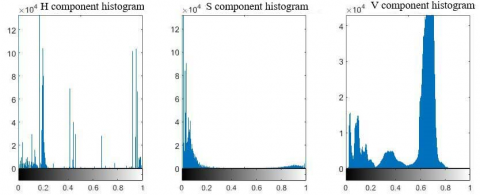
Next, the HSV color moment method was adopted to extract the features of hydroponic lettuce with BBD. Figure 12 shows the HSV histograms and color moments.
Table 4 shows the statistics on color moments of BBD hydroponic lettuce.
Figure 13 shows the boundary features extracted from BBD hydroponic lettuce.
Table 5 shows the statistics on shape features of BBD hydroponic lettuce.
After ultra-green segmentation, the gray image of BBD hydroponic lettuce was subjected to texture analysis. Table 6 shows the relevant statistics.
Through the above processing, the authors obtained the data on the color, shape, and texture features of hydroponic lettuce. The data were screened to find the parameters that represent the lettuce leaf features, providing the dataset for SVM model training.
Table 1. Statistics on color moments of leafroll hydroponic lettuce
|
Sample image |
Leafroll leaves in early phase |
Leafroll leaves in middle phase |
Leafroll leaves in late phase |
|
First-order color moment of H channel |
0.1598 |
0.2560 |
0.2354 |
|
First-order color moment of S channel |
0.0750 |
0.1109 |
0.1202 |
|
First-order color moment of V channel |
0.5302 |
0.5493 |
0.5684 |
|
Second-order color moment of H channel |
0.0507 |
0.0975 |
0.1087 |
|
Second -order color moment of S channel |
0.1345 |
0.1449 |
0.1596 |
|
Second -order color moment of V channel |
0.0908 |
0.0951 |
0.0943 |
(a) Original image of leafroll hydroponic lettuce in the early phase
(b) Extracted boundaries of leafroll hydroponic lettuce in the early phase
(c) Original image of leafroll hydroponic lettuce in the middle phase
(d) Extracted boundaries of leafroll hydroponic lettuce in the middle phase
(e) Original image of leafroll hydroponic lettuce in the late phase
(f) Extracted boundaries of leafroll hydroponic lettuce in the late phase
Figure 11. Boundary features extracted from leafroll hydroponic lettuce
Table 2. Statistics on shape features of leafroll hydroponic lettuce
|
Sample image |
Leafroll leaves in early phase |
Leafroll leaves in middle phase |
Leafroll leaves in late phase |
|
Rectangularity |
0.3475 |
0.4265 |
0.7500 |
|
Circularity |
0.7580 |
0.6144 |
0.7303 |
|
Complexity |
0.5486 |
0.6421 |
1 |
|
Elongation |
0.0978 |
0.1563 |
3.9407 |
Table 3. Statistics on texture features of leafroll hydroponic lettuce
|
Sample image |
Leafroll leaves in early phase |
Leafroll leaves in middle phase |
Leafroll leaves in late phase |
|
Energy |
0.4642 |
0.6229 |
0.7506 |
|
Entropy |
0.9491 |
0.7227 |
0.5048 |
|
Inertia moment |
0.0563 |
0.0479 |
0.0291 |
|
Correlation |
3.4588 |
4.8409 |
7.7170 |
(a) BBD leaves in early phase
(b) BBD leaves in middle phase
(c) BBD leaves in late phase
Figure 12. Color histograms of BBD hydroponic lettuce
Table 4. Statistics on color moments of BBD hydroponic lettuce
|
Sample image |
Leafroll leaves in early phase |
Leafroll leaves in middle phase |
Leafroll leaves in late phase |
|
First-order color moment of H channel |
0.1683 |
0.2813 |
0.2608 |
|
First-order color moment of S channel |
0.0740 |
0.0915 |
0.0914 |
|
First-order color moment of V channel |
0.5380 |
0.5222 |
0.5457 |
|
Second-order color moment of H channel |
0.0711 |
0.1241 |
0.1116 |
|
Second -order color moment of S channel |
0.1369 |
0.1480 |
0.1418 |
|
Second -order color moment of V channel |
0.0973 |
0.0922 |
0.0983 |
(a) Original image of BBD hydroponic lettuce in the early phase
(b) Extracted boundaries of BBD hydroponic lettuce in the early phase
(c) Original image of BBD hydroponic lettuce in the middle phase
(d) Extracted boundaries of BBD hydroponic lettuce in the middle phase
(e) Original image of BBD hydroponic lettuce in the late phase
(f) Extracted boundaries of BBD hydroponic lettuce in the late phase
Figure 13. Boundary features extracted from BBD hydroponic lettuce
Table 5. Statistics on shape features of BBD hydroponic lettuce
|
Sample image |
BBD leaves in early phase |
BBD leaves in middle phase |
BBD leaves in late phase |
|
Rectangularity |
0.5376 |
0.4943 |
0.5036 |
|
Circularity |
0.4640 |
0.4902 |
0.5558 |
|
Complexity |
0.7437 |
0.7048 |
0.6771 |
|
Elongation |
0.2151 |
0.1910 |
0.1985 |
Table 6. Statistics on texture features of BBD hydroponic lettuce
|
Sample image |
BBD leaves in early phase |
BBD leaves in middle phase |
BBD leaves in late phase |
|
Energy |
0.4502 |
0.8565 |
0.7729 |
|
Entropy |
0.9374 |
0.3166 |
0.4548 |
|
Inertia moment |
0.3198 |
0.0101 |
0.0186 |
|
Correlation |
3.1704 |
12.9658 |
8.5084 |
4.5 Principal component analysis (PCA) of disease features
Table 7. PCA results
|
Type of feature |
Percentage |
|
First-order color moment of H channel |
6.3382% |
|
First-order color moment of S channel |
4.9985% |
|
First-order color moment of V channel |
5.9853% |
|
Second-order color moment of H channel |
0.5039% |
|
Second -order color moment of S channel |
0.5974% |
|
Second -order color moment of V channel |
0.0275% |
|
Energy |
13.3112% |
|
Entropy |
11.2504% |
|
Inertia moment |
2.8209% |
|
Correlation |
0.9893% |
|
Rectangularity |
18.2716% |
|
Circularity |
25.1374% |
|
Complexity |
0.1980% |
|
Elongation |
9.6273% |
During the PCA of the images on hydroponic lettuce diseases, the dataset of leave features was saved as a matrix, where each column contains the data on the 14 disease features of the leaves, and each row represents a data feature of a sample image. Then, the covariance matrix was solved for the data on hydroponic lettuce features. The eigenvalues and eigenvectors were then extracted from the covariance matrix of the data. According to the percentage of each kind of eigenvalues, the principal features were identified for hydroponic lettuce leaves. The results are shown in Table 7.
As shown in Table 7, the first-order color moments of H, S, and V channels, circularity, elongation, energy, entropy, and inertia moment took up relatively high percentages in the PCA results. Hence, these features were chosen as the main characteristic parameters of hydroponic lettuce leaves.
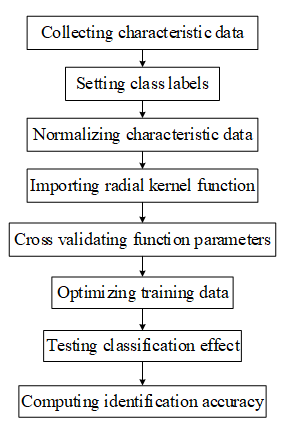
Based on the SVM, a training method was designed for hydroponic lettuce leaf diseases. The libsvm 3.24 tool package was set up in the MATLAB environment. Then, the default radial kernel function was chosen as the classification function for the data on hydroponic lettuce features. The training set was prepared with 600 images on normal hydroponic lettuce, 600 images on leafroll hydroponic lettuce, and 600 images on BBD hydroponic lettuce. The test set was prepared with 600 images on normal hydroponic lettuce, 600 images on leafroll hydroponic lettuce, and 600 images on BBD hydroponic lettuce. The training process is illustrated in Figure 14.
Figure 14. Training flow
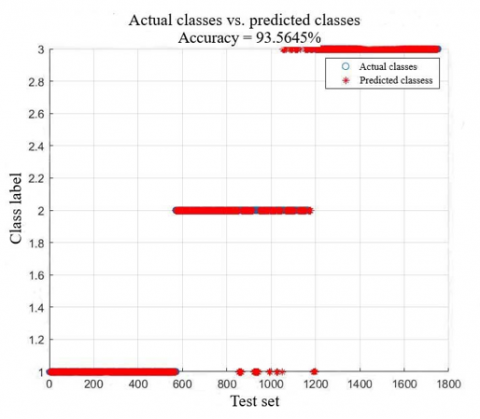
The class labels 1-3 were assigned to normal, leafroll, and BBD hydroponic lettuce images, respectively. The first-order color moments of H, S, and V channels, circularity, elongation, energy, entropy, and inertia moment were selected as the characteristic parameters. These parameters in the training and test sets were normalized by the mapminmax function. Then, the radial basis function (RBF) was adopted as the kernel function, and the penalty parameter C was determined as 100 through cross validation. In the kernel function, the gamma value was set to 0.1. Then, the training set was imported to the training network to train the model. The trained model was applied to make prediction on the test set. Figure 15 shows the test results. The predicted results agree with the actual classes. The recognition accuracy of hydroponic lettuce diseases reached 93.5465%.
The test results show that our identificaiton model achieves a good effect in disease recognition. Besides, the model is easy to train, and uses realizable image processing strategies on MATLAB. Compared with other algorithms, our identification approach is easy to operate, and concise in image processing.
Figure 15. Test results
This paper designs an SVM-based identification and classification approach for leaf diseases of hydroponic lettuce. Focusing on the leafroll and BBD of hydroponic lettuce, the authors devised a novel approach to identify these two diseases of the plant. The approach covers such steps as acquisition of original images, preprocessing of leaf images, segmentation of leaf images, and feature extraction of leaf images. In addition, the SVM training was adopted to identify the class of disease for each hydroponic lettuce image. The recognition accuracy was as high as 93%. However, this paper mainly studies the hydroponic lettuce leaves with a signal disease, namely, leafroll or BBD. No consideration is given to the cooccurrence of the two diseases. Moreover, only 9 characteristic parameters were selected for hydroponic lettuce diseases. To improve the classification accuracy of the SVM disease identification model, it is necessary to take account of more characteristic parameters. The future research will make up for these defects to further enhance the fineness and accuracy of the classification of hydroponic lettuce diseases.
This work is supported by Shaanxi Provincial Key Research and Development Project (Grant No.: 2020NY-144, 2019NY-171, and 2019ZDLNY02-04), Innovative Training Program for College Students of Northwest A & F University (Grant No.: S202110712565), National Natural Science Foundation of China (Grant No.: 31971805), and National Key Research and Development Program of China (Grant No.: 2019YFD1002401).
[1] Wu, Z., Yang, R., Gao, F., Wang, W., Fu, L., Li, R. (2021). Segmentation of abnormal leaves of hydroponic lettuce based on DeepLabV3+ for robotic sorting. Computers and Electronics in Agriculture, 190: 106443. https://doi.org/10.1016/j.compag.2021.106443
[2] Dhingra, G., Kumar, V., Joshi, H.D. (2018). Study of digital image processing techniques for leaf disease detection and classification. Multimedia Tools and Applications, 77(15): 19951-20000. https://doi.org/10.1007/s11042-017-5445-8
[3] Li, L., Zhang, S., Wang, B. (2021). Plant disease detection and classification by deep learning-a review. IEEE Access, 9: 56683-56698. https://doi.org/10.1109/access.2021.3069646
[4] Liu, X., Min, W., Mei, S., Wang, L., Jiang, S. (2021). Plant disease recognition: A large-scale benchmark dataset and a visual region and loss reweighting approach. IEEE Transactions on Image Processing, 30: 2003-2015. https://doi.org/10.1109/tip.2021.3049334
[5] Petrellis, N. (2018). A review of image processing techniques common in human and plant disease diagnosis. Symmetry, 10(7): 270. https://doi.org/10.3390/sym10070270
[6] Sannakki, S.S., Rajpurohit, V.S., Nargund, V.B., Arunkumar, R. (2013). Disease identification and grading of pomegranate leaves using image processing and fuzzy logic. International Journal of Food Engineering, 9(4): 467-479. https://doi.org/10.1515/ijfe-2012-0241
[7] Kerkech, M., Hafiane, A., Canals, R. (2020). VddNet: Vine disease detection network based on multispectral images and depth map. Remote Sensing, 12(20): 3305. https://doi.org/10.3390/rs12203305
[8] Li, D., Wang, R., Xie, C., Liu, L., Zhang, J., Li, R., Liu, W. (2020). A recognition method for rice plant diseases and pests video detection based on deep convolutional neural network. Sensors, 20(3): 578. https://doi.org/10.3390/s20030578
[9] Madhavan, M.V., Thanh, D.N.H., Khamparia, A., Pande S, Malik, R., Gupta, D. (2021). Recognition and classification of pomegranate leaves diseases by image processing and machine learning techniques. Computers, Materials & Continua, 66(3): 2939-2955. https://doi.org/10.32604/cmc.2021.012466
[10] Mahmoud, M.A., Guo, P., Wang, K. (2020). Pseudoinverse learning autoencoder with DCGAN for plant diseases classification. Multimedia Tools and Applications, 79(35): 26245-26263. https://doi.org/10.1007/s11042-020-09239-0
[11] Barbedo, J.G.A. (2013). Digital image processing techniques for detecting, quantifying and classifying plant diseases. SpringerPlus, 2(1): 1-12. https://doi.org/10.1186/2193-1801-2-660
[12] Mohanty, S.P., Hughes, D.P., Salathé, M. (2016). Using deep learning for image-based plant disease detection. Frontiers in Plant Science, 7: 1419. https://doi.org/10.3389/fpls.2016.01419
[13] Zhang, W., Huang, S., Wang, J.J. (2015). A segmentation method for wheat leaf images with disease in complex background. Computer Engineering & Science, 37(7): 1349-1354.
[14] Ren, S., Lu, H., Yuan, P., Xue, W., Xu, H. (2016). Segmentation algorithm of cucumber leaf disease image based on saliency detection. Nongye Jixie Xuebao/Transactions of the Chinese Society of Agricultural Machinery, 47(9): 11-16. https://doi.org/10.6041/j.issn.1000-1298.2016.09.002
[15] Chauhan, V.K., Dahiya, K., Sharma, A. (2019). Problem formulations and solvers in linear SVM: A review. Artificial Intelligence Review, 52(2): 803-855. https://doi.org/10.1007/s10462-018-9614-6
[16] Shen, L., Chen, H., Yu, Z., Kang, W., Zhang, B., Li, H., Liu, D. (2016). Evolving support vector machines using fruit fly optimization for medical data classification. Knowledge-Based Systems, 96: 61-75. https://doi.org/10.1016/j.knosys.2016.01.002
[17] Li, H.Y., Liu, S. (2019). A new method for qualitative analysis of near infrared spectra of textiles. Spectroscopy and Spectral Analysis, 39(7): 2142. https://doi.org/10.3964/j.issn.1000-0593(2019)07-2142-05
[18] Noor, A., Zhao, Y., Khan, R., Wu, L., Abdalla, F.Y. (2020). Median filters combined with denoising convolutional neural network for Gaussian and impulse noises. Multimedia Tools and Applications, 79(25): 18553-18568. https://doi.org/10.1007/s11042-020-08657-4
[19] Zhao, B., Song, Z., Mao, W., Mao, E., Zhang, X. (2009). Agriculture extra-green image segmentation based on particle swarm optimization and k-means clustering. Nongye Jixie Xuebao/Transactions of the Chinese Society for Agricultural Machinery, 40(8): 166-169.
[20] Barburiceanu, S., Terebes, R., Meza, S. (2021). 3D texture feature extraction and classification using GLCM and LBP-based descriptors. Applied Sciences, 11(5): 2332. https://doi.org/10.3390/app11052332