Achmad Rizal* | Fauzan Dizki Alif Azmi Siregar | Hilman Tresna Fauzi
© 2022 IIETA. This article is published by IIETA and is licensed under the CC BY 4.0 license (http://creativecommons.org/licenses/by/4.0/).
OPEN ACCESS
Obstructive sleep apnea (OSA) is a disorder that occurs in a person's sleep pattern, and due to its ability to cause other health-related problems, various monitoring methods have been developed. One of the proposed methods is the ECG signal known as ECG-derived respiration (EDR), which uses changes in rhythm and patterns regularity to detect OSA occurrence. Therefore, this study aims to determine the OSA classification based on heart-rate variability (HRV) on electrocardiogram (ECG) signal using a support vector machine (SVM). The HRV parameter displays the rhythmic changes in the ECG signal under normal and OSA conditions. Eleven HRV characteristics were used to produce the highest accuracy of 89.5% with a support vector machine (SVM) as a classifier. The results were tested on a 1 minute long ECG signal annotated by an expert, which indicated that OSA can be detected by observing the dynamics of the distance of the R-R wave on the ECG signal.
obstructive sleep apnea, ECG signal, heart-rate variability, support vector machine
Breathing is one of the most significant traits for living things, besides nutrition and locomotion. It is the process of inhaling air into the lungs through the nose or mouth due to muscle contraction, which is exhaled when the muscle relaxes. By breathing, living things, especially humans, can easily burn food that has been digested with oxygen, a process generally referred to as oxidation. This process enables the body to produce adequate energy to carry out daily activities. Therefore, it is undoubtedly very disastrous when a disturbance occurs in the breathing process with such a crucial feature. One of the diseases capable of causing breathing problems is obstructive sleep apnea or OSA. This is a condition in which there is complete or partial obstruction of the upper respiratory tract over a period, which causes cessation of breathing (apnea) or decreased airflow (hypopnea) [1]. OSA is often considered trivial by society, even though it can be a reasonably severe disease in some cases. One of its symptoms is snoring, which is quite common in adults or the elderly while sleeping. Patients with symptoms of acute snoring will generally undergo a polysomnography (PSG) test where the body's signals during sleep are monitored to determine the indications and extent of OSA. Although the PSG method easily identifies OSA in a person, its expensive cost and prolonged timeframe make it less attractive. Several studies have been carried out to determine alternative detection methods based on these problems.
Several studies related to OSA and ECG have been conducted, with the most recent carried out by Almazaydeh et al. [2] using SVM. This study achieved an accuracy of 96.5% by using the feature extraction of the ECG signal approach with a 15 sec of data segmentation parameter. In Khatami’s survey [3], several other works regarding OSA detection using ECG signals were observed. The best accuracy was 97% in a study by Jezzini et al. [4], which compared MLP, RBF, and SVM methods. Other notable works in the survey that also uses SVM as the classifier are the studies by Zhu et al. [5], which uses PSO based optimal kernel as the features, and Zarei and Asl [6], which provides AHI metric for each patient to make prioritization possible in the treatment stage. Aside from the SVM method, several works also use other methods to detect OSA with the ECG signal, such as the study by de Chazal et al. [7], which measured sleep-disordered respiration time in the approach.
This study proposes a method for OSA classification using heart-rate variability (HRV) parameters. It is based on the hypothesis that the heart rhythm will be disturbed in OSA conditions. Several HRV parameters were tested using a support vector as a classifier. The difference between this study and previous ones is the exploration of the contribution of each HRV parameter to accuracy. Almazaydeh et al. [2] focused on the effect of the segmentation length of the ECG data signal in 10, 15, and 30 seconds using 10 HRV parameters. Meanwhile, Hachem assessed on the performance of several machine learning, namely SVM, RBF, and MLP, using 11 and 14 HRV parameters [3]. However, both studies failed to show the contribution of each HRV parameter to accuracy. Therefore, this study used 11 HRV parameters and presented their individual accuracy and combination. This is expected to be a recommendation for selecting the best HRV parameters capable of producing the highest accuracy in the OSA classification.
The method proposed in this study uses a one-minute segment of long-term ECG signal as input, as shown in Figure 1. Furthermore, R-R detection is conducted by extracting the heart-rate variability parameters. In the final stage, classification is carried out using a support vector machine (SVM) to determine the possible presence of OSA in the signal segment. The following subsections describe details of each process.
Figure 1. Proposed method
2.1 OSA ECG dataset
Figure 2. (a) Normal ECG, (b) OSA ECG
Data were collected from the PhysioNet website [8], while the selected dataset was the apnea-ECG database recorded by Dr. Thomas Penzel at the Philipps-University Hospital, Marburg, Germany. The dataset comprises 21 recordings of electrocardiogram (ECG) signals from 16 men and 5 women with sleep apnea at a frequency sampling of 100 Hz [9]. Records vary from slightly less than 7 hours to almost 10 hours. ECG signal data is annotated every 1 minute in normal or OSA labels based on data from machines or experts. This study used 35 datasets with 16,829 1-minute ECG recordings comprising 10,400 normal and 6,429 OSA detected ECG. Despite the inequality between the normal ECG and OSA data, there is no need for an unbalanced-data handling mechanism. Figure 2 shows examples of normal ECG and OSA.
2.2 R-R detection
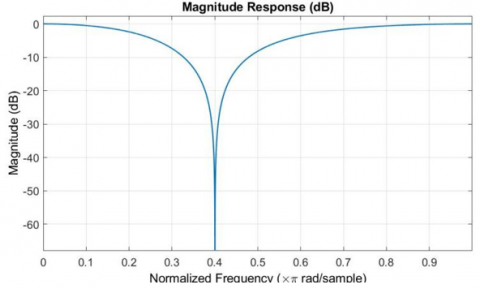
The R detection process uses the method proposed in preliminary studies, as shown in Figure 3 [10]. A notch filter is used to remove the 50 Hz component from the EEG signal. It is also used even though the ECG signal mostly occupies a frequency < 50 Hz to produce a smoother signal, which tends to facilitate the RR detection process at a later stage. The notch filter used is used to calculate the numerator b = [0.579, -0.357, 0.579] and denumerator a = [1, -0.358, 0.158] values of IIR. The frequency response of the designed notch filter is shown in Figure 4.
This study used the wavelet transform to determine the approximate component of the signal to eliminate baseline wander from the ECG. The wavelet transformation in this study uses 'Db6' level 10. Subsequently, the Approximation level 10 (A10) component is reconstructed to obtain a low-frequency signal component. A10 subtracts the ECG signal to eliminate fluctuations in the baseline ECG signal.
R-R detection is carried out by determining the peak of the ECG wave by detecting R using an algorithm, as shown in Figure 5.
Figure 3. R-R detection process
Figure 4. Frequency response of filter
Figure 5. R-R detection proses [10]
2.3 Feature extraction
The final extraction method applied combines several features found in preliminary studies [11, 12]. These features are based on the RR-interval, therefore, it is appropriate to use the HRV method. The following are the features of the ECG signal used:
1. The mean RR-interval or the average value of the RR-interval per unit time.
When the number of ECG beat is N, the Mean RR-interval is expressed as follows:
$\operatorname{MeanRR}=\frac{1}{N-1} \sum_{i=2}^{N}\left(R R_{i}-R R_{i-1}\right)$ (1)
2. Mean Heart Rate (MHR) is the mean value of heart rate (HR) calculated from $1 /\left(R R_{i}-R R_{i-1}\right)$ x 60 in beat per minute (BPM). Supposing HR = I, then MHR is as follows:
$M H R=\frac{1}{N-1} \sum_{i=2}^{N} I_{n}$ (2)
3. The standard deviation of epoch and RR-interval (SDRR)
SDRR is expressed as follows:
$S D R R=\sqrt{\frac{1}{N-1} \sum_{i-2}^{N}\left(\left(R R_{i}-R R_{i-1}\right)-\operatorname{MeanRR}\right)}$ (3)
4. NN50 is a pair of RR-intervals where the difference between two RR-intervals is above 50ms.
5. pNN50 is the sum of each NN50 divided by the total RR-intervals.
6. SDSD measures the standard deviation of the difference between a pair of RR intervals.
7. RMSSD measures the mean root of the difference between a pair of RR intervals.
$R M S S D=\sqrt{\frac{1}{N-2} \sum_{i=3}^{N}\left[I_{i}-I_{i-1}\right]^{2}}$ (4)
8. The Median or RR- interval is the median value from all RR-intervals.
9. The inter-quartile range is the difference between the 75th and 25th percentiles of the value of the RR-interval distribution.
10. NN20 is a pair of RR-intervals where the difference between the two RR-intervals is more than 20 ms.
11. pNN20 is the sum of each NN20 divided by the total RR-intervals.
2.4 Support vector machine (SVM) and cross-validation
Support Vector Machine is an algorithm that uses a hyperplane to separate data into two different classes, as shown in Figure 6 [13]. Therefore, the SVM is used for the classification process, while linear, quadratic, cubic, fine Gaussian, medium Gaussian, and coarse Gaussian were employed to test the kernels.
It is necessary to divide training and test data due to the inclusion of SVM in supervised learning. Furthermore, to avoid overfitting, N-fold cross-validation (N-fold CV) was used at the classification stage [14]. In N-fold CV, the data is divided into N datasets. The N-1 and one dataset are used as training and testing data. This process is repeated up to N times until all datasets have been tested. Performance is calculated from the average of all processes using a 5-fold CV. The parameter used to test the system model in this study and evaluate the classification results is accuracy. It is calculated as follows:
Accuracy $=\frac{T P+T N}{T P+T N+F P+F N} \times 100 \%$ (5)
where, TP, TN, FP, and FN denote True Positives, True Negatives, False Positives, and False Negatives. TP is a condition in which the system's detecting OSA is correct. TN is a situation whereby the system's result is correct in indicating that OSA does not detect the data. When the system's result mistakenly says that OSA identifies data, this is known as FP. Finally, FN is when the system's result falsely shows that OSA does not recognize the data.
Figure 6. Illustration of Support Vector Machine (SVM)
Figure 7. ECG signal and A10 wavelet coefficient (red line)
Figure 8. Result of R-R detection
The proposed method uses characteristics derived from heart-rate variability, thereby making the RR detection process fundamental. Figure 7 shows the results of the notch filtering process and the baseline of the signal obtained from the wavelet decomposition of the original signal, also known as A10. An ECG signal with a flat baseline is produced by reducing the filtering signal and the baseline. This will facilitate R's detection, carried out in the following process.
Figure 8 shows the signal from the improved baseline and the detected result of R. The figure shows that the baseline of the ECG signal has been evenly distributed therefore, there is no fluctuation of the R wave.
The result from the subtraction of the smoothing output signal and the wavelet coefficient is shown in Figure 7. Two processes are performed on the ECG signal, namely smoothing and wavelet decomposition. The A10 coefficient on the wavelet decomposed signal eliminates fluctuations in the baseline ECG [9]. The possibility of error in RR detection can be reduced using thresholding, as shown in Figure 5. The thresholding is sufficient to obtain the peaks of the ECG signal due to the high R waves. The distance between these peaks R will calculate HRV using 11 parameters as a feature.
Table 1 shows the accuracy of OSA and non-OSA ECG classification using one HRV parameter value with several SVM kernels. Meanwhile, Table 2 illustrates the accuracy using various combinations of HRV parameters. The use of one HRV parameter can only produce the highest accuracy of 78.4%. of the combination of 10 out of 11 generated features resulted in the highest accuracy of up to 84.10%. This value is lower than the use of 11features, as shown in Table 3. The highest accuracy reached 89.5% using fine Gaussian SVM, which is higher than 10 features.
Table 1. Accuracy using single HRV’s parameters
|
HRV’s features |
SVM’s kernel |
|||||
|
Linear |
Quadratic |
Cubic |
Fine Gaussian |
Medium Gaussian |
Coarse Gaussian |
|
|
MHR |
22.60% |
30.00% |
78.50% |
78.50% |
78.50% |
78.40% |
|
SDNN |
78.10% |
55.90% |
78.40% |
78.40% |
78.40% |
78.40% |
|
RMS |
78.30% |
38.80% |
78.30% |
78.40% |
78.40% |
78.40% |
|
NN50 |
68.20% |
22.40% |
21.60% |
78.40% |
78.40% |
78.40% |
|
pNN50 |
48.20% |
42.80% |
30.60% |
78.40% |
78.40% |
78.40% |
|
SDSD |
21.70% |
77.80% |
78.30% |
78.40% |
78.40% |
78.40% |
|
Median |
76.70% |
22.40% |
76.10% |
78.40% |
78.40% |
78.40% |
|
Interquartile |
21.70% |
38.60% |
77.50% |
78.40% |
78.40% |
78.40% |
|
MeanRR |
21.90% |
49.20% |
76.60% |
78.40% |
78.30% |
78.40% |
|
NN20 |
70.10% |
76.20% |
29.60% |
78.40% |
78.40% |
78.40% |
|
pNN20 |
63.90% |
32.50% |
29.40% |
78.40% |
78.40% |
78.40% |
Table 2. Accuracy using a combination of HRV's parameters
|
HRV’s features |
SVM’s kernel |
|||||
|
Linear |
Quadratic |
Cubic |
Fine Gaussian |
Medium Gaussian |
Coarse Gaussian |
|
|
MHR. SDNN |
22.70% |
50.40% |
77.60% |
78.60% |
78.10% |
78.40% |
|
MHR. SDNN. RMS |
76.20% |
47.00% |
78.00% |
78.60% |
78.10% |
78.40% |
|
MHR. SDNN. RMS. SDSD |
33.30% |
21.60% |
21.80% |
78.60% |
78.10% |
78.40% |
|
MHR. SDNN. RMS. SDSD. Interquartil |
78.40% |
78.40% |
21.70% |
79.20% |
78.30% |
78.40% |
|
MHR. SDNN. RMS. SDSD. Interquartil. Median |
78.30% |
22.00% |
25.20% |
79.50% |
78.40% |
78.40% |
|
MHR. SDNN. RMS. SDSD. Interquartil. Median. MeanRR |
78.40% |
21.60% |
78.30% |
83.30% |
78.50% |
78.40% |
|
MHR. SDNN. RMS. SDSD. Interquartil. Median. MeanRR. NN20 |
78.40% |
77.00% |
23.70% |
83.40% |
78.60% |
78.40% |
|
MHR. SDNN. RMS. SDSD. Interquartil. Median. MeanRR. NN20. NN50 |
78.40% |
73.60% |
21.60% |
83.40% |
78.60% |
78.40% |
|
MHR. SDNN. RMS. SDSD. Interquartil. Median. MeanRR. NN20. NN50. pNN20 |
78.40% |
72.10% |
78.40% |
84.10% |
78.60% |
78.40% |
Table 3. Classification accuracy using 11 HRV’s parameter
|
SVM’s Kernel |
Accuracy (%) |
|
Linear |
78.4 |
|
Quadratic |
72.9 |
|
Cubic |
72.9 |
|
Fine Gaussian |
89.5 |
|
Medium Gaussian |
78.6 |
|
Coarse Gaussian |
78.6 |
Some results of HRV feature extraction are shown in Table 4. The MHR, SDNN, RMS, and NN50 values overlap between normal ECG and OSA, which proves using one feature will not produce high accuracy. In addition, the range of values for each feature also varies. MHR and NN50 values are in the tens order, while SDNN and RMS are in the range of 0.1 - 1. With this difference in range, some features are inappropriate when combined with those in a higher range.
The sample dataset in Figure 2 shows no significant difference between OSA and normal ECG. When the effect of OSA only changes 1-2 beats of the ECG signal, then the feature calculation of the RR interval becomes relevant. This is because only 1 minute of recording ECG signals consisting of 60-80 beats can change due to the effect of OSA. In addition to the improvement/choice of the HRV-based feature extraction method, shorter signal segmentation is an option therefore changes in the ECG signal beat due to OSA becomes more visible [2].
Table 4. Range of several HRV's parameters
|
|
OSA |
NORMAL |
||
|
|
MAX |
MIN |
MAX |
MIN |
|
MHR |
80 |
55 |
84 |
67 |
|
SDNN |
0.26 |
0.06 |
0.10 |
0.04 |
|
RMS |
0.18 |
0.04 |
0.11 |
0.02 |
|
NN50 |
37 |
5 |
19 |
3 |
The accuracy achieved is competitive compared to preliminary studies, as shown in Table 5. The number of features used is 11 compared to 10 used by Rizal et al. [15], with the same dataset and classifier. The weakness of the proposed method is that the resulting characteristics depend on the R-R detection process. This indicates that when the R-R detection process fails, the resulting HRV parameter value differs.
A similar method was previously proposed in a study by Jezzini et al. [4]. The difference is in the HRV characteristics used, such as MHR, MADV, the slope of the first polynomial model of RR1, the variance, and RR1max-RR2min. The resulting accuracy is 97.5% using SVM, and the main difference is that the ECG signal cuts into segments every 15 seconds. Therefore, signal segmentation will require additional annotation of the truncated ECG signal to determine whether it is OSA or normal.
The ECG signal feature extraction method for OSA classification uses local and global features. The local features are taken from specific characteristics that are directly visible. An example is the RR interval, calculated on the ECG signal. Global features are calculations carried out without regard to the RR interval. Examples include entropy and statistical features of the ECG signal (mean, SD, variance), fractal dimensions, etc. In subsequent developments, along with deep learning, the OSA classification of ECG signals no longer requires a feature extraction process [16]. Sheta et al. [17] reported approximately 86.25% accuracy for using 9 features with multiple HRV with CNN.
The advantage of this study is the presence of accuracy evaluation for each HRV parameter. Therefore, it is able to determine the parameters significant enough to contribute to accuracy. In the next stage, several combinations of HRV parameters were tested to obtain maximum accuracy results. Although using all characteristics is still better than utilizing some, with this test, recommendations will be obtained on the features that need to be combined with other characteristics for subsequent development.
Some of the limitations associated with this study are also found. The incidence of OSA can sometimes be recognized on just one beat of the ECG signal thereby, cutting data per minute is deemed excessive. Compared to other regular 60-80 beat ECGs, this is not significant enough in some circumstances. Cutting the ECG signal's duration to a shorter length is anticipated to enhance accuracy, making categorization and data gathering more challenging [2]. Subsequently, different HRV parameters were employed in another investigation. In the future, the combination or selection of the correct HRV parameters will be an intriguing issue.
Table 5. Several previous studies in ECG OSA classification
|
Reference |
Features extraction method |
Classifier |
Result |
|
[14] |
HRV in time and frequency domain of Hilbert transform, de-trended fluctuation analysis (DFA), EDR in time and frequency domain |
Logistic regression |
Accuracy: 87% |
|
[15] |
Mean, standard deviation, kurtosis, mean of harmonic, root mean square of energy, skewness, EMG's correlation coefficient. |
Multilayer perceptron |
Accuracy: 96.87% |
|
[4] |
Optimal kernel of PSO |
SVM |
Accuracy: 97%. |
|
[13] |
Multiscale entropy (MSE) for scale 1-10 |
SVM |
Accuracy: 85.6% |
|
[3] |
Mean HR, SD of HR, NN50 variant 1and 2, pNN50, SDSD, RMSSD, median HR, inter-quartile HR, MADV, Variance of RR1, the slope of 1st polynomial model of RR1, RR1max-RR2min |
SVM, RBF, MLP |
Accuracy: 97.5% |
|
[5] |
DWT, Fuzzy entropy, SampEnt, Correct Conditional Entropy, Poincare plot feature, Recurrence plot, Interquartile range, MAV, variance, Shannon entropy |
SVM RBF kernel |
Accuracy: 94.63% |
|
Proposed method |
MHR, SDNN, RMS, SDSD, Interquartile, Median, MeanRR, NN20, NN50, pNN20, pNN50 |
SVM |
Accuracy: 89.50% |
This study proposed a method for classifying normal ECG and OSA ECG signals. The characteristics used are HRV parameters such as MHR, SDNN, RMS, SDSD, Interquartile, Median, MeanRR, NN20, NN50, pNN20, and pNN50. The test results on the one-minute ECG signal resulted in an accuracy of about 89.5% using SVM as a classifier. This highest accuracy was achieved using 11 overall. The results obtained are relatively competitive with other feature extraction methods in previous studies.
This work is supported by the PPM Telkom University, Indonesia.
[1] Qureshi, A., Ballard, R.D., Nelson, H. S. (2003). Obstructive sleep apnea. Journal of Allergy and Clinical Immunology, 112(4): 643-651. https://doi.org/10.1016/j.jaci.2003.08.031
[2] Almazaydeh, L., Elleithy, K., Faezipour, M. (2012). Detection of obstructive sleep apnea through ECG signal features. In 2012 IEEE International Conference on Electro/Information Technology, Indianapolis, IN, USA, pp. 1-6. https://doi.org/10.1109/EIT.2012.6220730
[3] Khatami, A.A., Sebayang, M.A., Rizal, A., Barus, D.T. (2020). Obstructive sleep apnea detection using ECG signal: A survey. Technol Reports Kansai Univ, 62(4): 1267-1274.
[4] Jezzini, A., Ayache, M., Elkhansa, L., Al Abidin Ibrahim, Z. (2015). ECG classification for sleep apnea detection. In 2015 international conference on advances in biomedical engineering (ICABME), Beirut, Lebanon, pp. 301-304. https://doi.org/10.1109/ICABME.2015.7323312
[5] Zhu, H., Koo, C.H., Wu, C.K., Wan, W.H., Tsang, Y.T., Tsang, K.F. (2018). Sleep apnea monitoring for smart healthcare. In IECON 2018-44th Annual Conference of the IEEE Industrial Electronics Society, Washington, DC, USA, pp. 4726-4729. https://doi.org/10.1109/IECON.2018.8592908
[6] Zarei, A., Asl, B.M. (2018). Automatic detection of obstructive sleep apnea using wavelet transform and entropy-based features from single-lead ECG signal. IEEE Journal of Biomedical and Health Informatics, 23(3): 1011-1021. https://doi.org/10.1109/JBHI.2018.2842919
[7] de Chazal, P., Penzel, T., Heneghan, C. (2004). Automated detection of obstructive sleep apnoea at different time scales using the electrocardiogram. Physiological Measurement, 25(4): 967. https://doi.org/10.1088/0967-3334/25/4/015
[8] Goldberger, A.L., Amaral, L.A., Glass, L., et al. (2000). PhysioBank, Physio Toolkit, and physioNet: Components of a new research resource for complex physiologic signals. Circulation, 101(23): e215-e220. https://doi.org/10.1161/01.CIR.101.23.e215
[9] Penzel, T., Moody, G.B., Mark, R.G., Goldberger, A.L., Peter, J.H. (2000). The apnea-ECG database. Computers in Cardiology 2000, 27: 255-258. https://doi.org/10.1109/CIC.2000.898505
[10] Ainunhusna, I., Rizal, A., Sumaryo, S. (2020). Bipolar disorder classification based on electrocardiogram signal using support vector machine. International Journal of Scientific & Technology Research, 9(1): 2300-2303.
[11] Almazaydeh, L., Elleithy, K., Faezipour, M. (2012). Obstructive sleep apnea detection using SVM-based classification of ECG signal features. In 2012 Annual International Conference of the IEEE Engineering in Medicine and Biology Society, Diego, CA, USA, pp. 4938-4941. https://doi.org/10.1109/EMBC.2012.6347100
[12] Razi, A.P., Einalou, Z., Manthouri, M. (2021). Sleep apnea classification using random forest via ECG. Sleep and Vigilance, 5(1): 141-146. https://doi.org/10.1007/s41782-021-00138-4
[13] Cortes, C., Vapnik, V. (1995). Support-vector networks. Machine Learning, 20(3): 273-297. https://doi.org/10.1007/BF00994018
[14] Rizal, A., Hidayat, R., Nugroho, H.A. (2018). Fractal dimension for lung sound classification in multiscale scheme. Journal of Computer Science, 14(8): 1081-1096. 2018. https://doi.org/10.3844/jcssp.2018.1081.1096
[15] Rizal, A., Iman, U.R., Fauzi, H. (2021). Classification of sleep apnea using multi scale entropy on electrocardiogram signal. International Journal of Online & Biomedical Engineering, 17(14): 79-89. http://dx.doi.org/10.3991/ijoe.v17i14.25905
[16] Almutairi, H., Hassan, G.M., Datta, A. (2021). Detection of obstructive sleep apnoea by ECG signals using deep learning architectures. In 2020 28th European Signal Processing Conference (EUSIPCO), Amsterdam, Netherlands, pp. 1382-1386. https://doi.org/10.23919/Eusipco47968.2020.9287360
[17] Sheta, A., Turabieh, H., Thaher, T., Too, J., Mafarja, M., Hossain, M.S., Surani, S.R. (2021). Diagnosis of obstructive sleep apnea from ECG signals using machine learning and deep learning classifiers. Applied Sciences, 11(14): 6622. https://doi.org/10.3390/app11146622