Hakan Ayyıldız | Mehmet Kalaycı | Seda Arslan Tuncer | Ahmet Çınar | Taner Tuncer*
© 2022 IIETA. This article is published by IIETA and is licensed under the CC BY 4.0 license (http://creativecommons.org/licenses/by/4.0/).
OPEN ACCESS
In the medical diagnosis such as WBC (white blood cell), the scattergram images show the relationships between neutrophils, eosinophils, basophils, lymphocytes, and monocytes cells in the blood. For COVID-19 detection, the distributions of these cells differ in healthy and COVID-19 patients. This study proposes a hybrid CNN model for COVID-19 detection using scatter images obtained from WBC sub (differential-DIFF) parameters instead of CT or X-Ray scans. As a data set, the scattergram images of 335 COVID-19 suspects without chronic disease, collected from the biochemistry department of Elazig Fethi Sekin City Hospital, are examined. At first, the data augmentation is performed by applying HSV(Hue, Saturation, Value) and CIE-1931(Commission Internationale de l'éclairage) conversions. Thus, three different image large sets are obtained as a result of raw, CIE-1931, and HSV conversions. Secondly, feature extraction is applied by giving these images as separate inputs to the CNN model. Finally, the ReliefF feature extraction algorithm is applied to determine the most dominant features in feature vectors and to determine the features that maximize classification accuracy. The obtaining feature vector is classified with high-performance SVM in binary classification. The overall accuracy is 95.2%, and the F1-Score is 94.1%. The results show that the method can successfully detect COVID -19 disease using scattergram images and is an alternative to CT and X-Ray scans.
HSV, CIE-1931, scattergram, COVID-19, feature selection algorithm
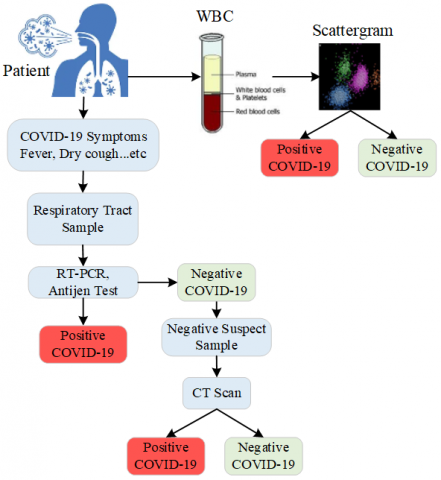
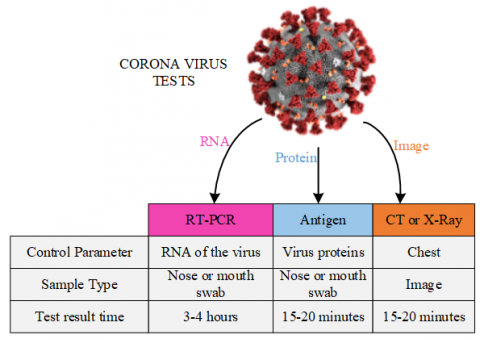
COVID-19, which has sudden and unexpected effects on our individual and social lives, has emerged as a global threat affecting the world. COVID-19 is highly contagious and rapidly spreading globally, and early detection is of paramount importance. The main method of reducing and controlling the spread of the Coronavirus is the rapid and accurate diagnosis and quarantine of COVID-19 patients. The basic test for the diagnosis of COVID-19 is the RT-PCR (Reverse transcription-polymerase chain reaction) test. The procedure in Figure 1 is performed to determine whether patients with symptoms such as dry cough, fever have COVID-19. First, the patient's symptoms are checked. Second, swab samples taken from the throat and nose areas of the person by healthcare professionals are subjected to the RT-PCT test. In this test, it is investigated whether the swabs contain viral particles. If the result of the test is negative, the diagnosis is made by performing a CT (Computerized Tomography) scan of the patient.
RT-PCR, Antigen tests, and CT scans have some disadvantages. The main problems of this test are that the RT-PCR test result is clear after 3-4 hours, the swab samples are not taken correctly, the swab samples are kept for testing and the test sensitivity is 80% [1]. The antigen test, which determines whether individuals have COVID-19 momentarily, is used to determine whether the virus affects the patient's body. It produces accurate results after the infection period of the virus. The impact of radiation emitted during CT scanning on human health poses a problem. Considering these disadvantages, new test methods are needed.
Figure 1. COVID-19 detection procedure
The latest data mining and machine learning techniques such as Convolutional Neural Network (CNN) can be applied for accurate and rapid detection of diseases and help alleviate the test shortage problem. These techniques outperform traditional mathematical models in terms of handcrafted features in medical image processing and machine vision [2-4]. Various techniques based on CNN models have been introduced to identify patients diagnosed with COVID-19 infection with high accuracy [5-7]. Despite the long training time and complex structure of CNNs, their ability to learn makes them usable in the diagnosis of diseases such as COVID-19.
1.1 Importance of study
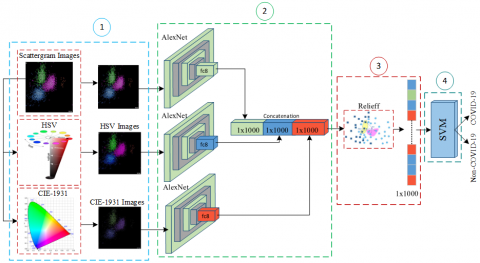
In this paper, we propose a CNN-based model to detect COVID-19 from Scattergram images. WBC-DIFF Scattergram obtained from CBC measurements requested from almost all patients admitted to the hospital; shows the distribution and morphology of neutrophils, eosinophils, basophils, lymphocytes, and monocytes. 335 scattergram images taken from COVID-19 suspects without chronic disease were subjected to CIE-1931 and HSV conversions to expand the workspace and two datasets were added. The feature vectors of the images are obtained by giving the obtained data sets to the pre-trained AlexNet model separately. At this stage, AlexNet is used as a feature extractor. A 1x3000 feature vector is created by combining 1x1000 feature vectors obtained from AlexNet's fully connected layer. Thus, features that cannot be extracted from the original Scattergram images are obtained from the HSV and CIE-1931 datasets. Finally, the ReliefF algorithm is applied to determine the features that maximize the classification success in the feature vector and the classification is completed with the SVM classification algorithm. The importance of the proposed model can be summarized as follows.
- CBC is a routine test. As a result of this test, WBC-DIFF Scattergram images are easily accessible.
- The acquisition time of scattergram images is 15-20 minutes. This time is the diagnostic time of COVID-19 with the proposed model.
- Thorax CT imaging can damage the lung by making the tumor in the lung structure worse in patients with a previous tumor in the lung. Using CT imaging can be harmful in determining whether patients with a lung mass/nodule have COVID-19. For this reason, it is healthier to work with CBC data.
1.2 Contribution and novelty
In summary, our contributions are as follows.
- Using WBC-DIFF scattergram images for COVID-19 classification.
- Scattergram images are converted into HSV and CIE-1931, so that features that the CNN model could not extract from Scattergram images are obtained.
- AlexNet architecture is used as feature extractor.
- Detection of COVID-19 from scattergram images with high accuracy.
Detecting COVID-19 at an early stage through both RT-PCR and imaging is directly related to the isolation and spread of the disease. The isolation of COVID-19 patients and the care of intubated patients in intensive care units increase the workload of all healthcare personnel. The first and most important thing in reducing the workload is the correct diagnosis of the disease and immediate isolation. In order to reduce the workload, there is a need to develop helpful decision support tools for health personnel. In order to increase the COVID-19 diagnostic accuracy given in Figure 1, both RT-PCR and CT scans are supported by machine learning and deep learning-based methods.
Gangloff et al. used logistic regression, random forest, and neural network methods to improve the performance of RT-PCR and chest-CT and diagnose COVID-19 [8]. The value of AUC was obtained as 0.93 with the model used. Langer et al. using baseline information available in all emergency departments, determined the accuracy of AI to be 91.4% in predicting RT-PCR results for COVID-19 [9]. de Fátima Cobre et al. used artificial neural networks (ANN), decision trees (DT), partial least squares discriminant analysis (PLS-DA), and K nearest neighbor algorithm (KNN) models to predict the diagnosis and disease severity of COVID-19. They correlated the diagnosis and severity of COVID-19 with low urine pH and high lactate dehydrogenase levels with 84% accuracy [10]. In order to detect, COVID-19 with deep learning techniques is a trending topic and has been receiving a lot of attention lately. Promising results using advanced CNNs have been published, and new work continues to emerge in this area. Currently, X-ray [11-13] and Computed Tomography (CT) [14-16] are the main screening methods for diagnosing COVID-19. Pathak et al. proposed a deep learning architecture with cost-sensitive features to overcome noisy and unstable COVID-19 dataset problems. Training and testing accuracy were achieved at training 96.2264% and 93.0189%, respectively [17]. The COVIDNet-CT model was presented to differentiate COVID-19 cases from Pneumonia and Normal CT images [18]. The major outstanding contribution of the study was the use of 104,009 CT images. A modified Inception transfer-learning model was used by Wang et al. [19], which used 1065 CT images to differentiate COVID-19 from viral pneumonia. 85.2% accuracy achieved. NIA-Network (Network-in-Network, Instance Normalization, and Adversarial Learning model), which can detect small infected regions in COVID-19 CT images, was proposed [20]. In the study using 2 different data sets, the accuracy was determined in the range of 93.25%-98.75%. According to Mishra et al. with Transfer Learning based on VGG16 and ResNet50 architectures, detected COVID-19 in CT images consisting of healthy, COVID-19, and Pneumonia categories. It was calculated in binary (COVID-19, non-COVID-19) and over 99% with triples (COVID-19, Non-COVID-19, Pneumonia) with 88.5% [21]. Chaddad et al. CT used AlexNet, GoogleNet, NNet-Mobile, ResNet18, and DarkNet models for the differences between those with COVID-19 and normal tissues. They also examined the classification ability of their proposed model to distinguish COVID-19 from pneumonia and normal CT images [22]. Carvalho et al. presented a methodology for diagnosing COVID-19 using CNN. The quality of the images was improved by using histogram equalization and CLAHE, and then classification was made. Out of 708 CT images, 312 images with COVID-19 were classified with an accuracy of 97.88% [23]. Alshazly et al. proposed two CNN models for automatic detection of viral pneumonia, Normal and COVID-19. These models were CovidResNet and CovidDenseNet, which were inspired by the ResNet and DenseNet models. An accuracy of 93.96% for binary classification and 83.89% for triple classification was achieved [24]. Fang and Wang proposed a classification network model to effectively increase the COVID-19 decision accuracy from doctors' manual CT images. Thanks to the Convolution and deconvolution process in the model, the contrast between the tissues with COVID-19 and the abdominal cavity is increased. Thus, better features were obtained and sensitivity, specificity, positive predictive value (PPV), negative predictive value (NPV), and precision were determined as 0.98, 0.96, 0.96, 0.98, and 0.97, respectively [25].
The data set used in this paper was obtained from people who applied to Elazig Fethi Sekin city hospital with the suspicion of COVID-19 between 01.10.2020 and 01.01.2021. First, the RT-PCR test was applied to each patient. The RT-PCR test was positive in 121 of 335 patients. CT scans were applied to suspected patients with ongoing COVID-19 symptoms, and 14 more patients were identified as positive. Thus, 135 out of 335 people were labeled as positive. Secondly, peripheral blood samples of the patients were collected into K2EDTA (Beckton Dickinson) tubes, and Complete Blood Count (CBC) measurements and WBC-DIFF Scattergram images were obtained from Beckman DxH800 (Beckman Coulter, Inc., Miami, FL, USA). Figure 2 shows some of the scattergram images labeled COVID-19 and Non-COVID-19. WBC Scattergram images are a 2-dimensional representation used to determine the distributions of basophils, neutrophils, eosinophils, lymphocytes, and monocytes used in disease diagnosis and morphological changes. The reasons for using this data set in the detection of COVID-19 are as follows.
- Proven changes in hematological and immunological parameters caused by COVID-19;
- Scattergram images are obtained from almost any patient of the WBC subgroups (DIFF-Differential) without any problems.
In light of these advantages, the use of scattergram images is an innovative approach to eliminate the disadvantages of RT-PCR testing and CT scans in the detection of COVID-19. On the used data, any pre-processing was not implemented.
Figure 2. Scattergram images a) COVID-19 b) Non-COVID-19
This section presents the classification of COVID-19 using scattergram images. A four-stage model is proposed that takes a scattergram image as input and determines whether a patient with a scattergram image as output has COVID-19. The proposed model consists of (1) data preparation, (2) feature extraction, (3) feature selection, and (4) classification modules. The 4-step block diagram of the approach is shown in Figure 3.
4.1 Data preparation
As stated in the experimental results section, the classification performance of scattergram images is not sufficient with the use of pre-trained AlexNet [26], ResNet50 [27], GoogleNet [28], and MobileNetv2 [29] CNN models. Therefore, the model given in Figure 3 is proposed. In the first stage of this model, the new images are created using raw scattergram images. In order to obtain more feature vectors from the raw Scattergram images, the new images are obtained by applying HSV and CIE 1931 converts to the Scattergram images.
Figure 3. Proposed model
HSV and CIE 1931 are color matching systems designed to more closely match the way humans perceive color. For the HSV conversion, the R,G,B values are divided by 255 to change the range from [0, 255] to [0.0,1.0].
R' = R/255
G' = G/255
B' = B/255
Cmax = max(R', G', B')
Cmin = min(R', G', B')
Δ = Cmax – Cmin
By using normalized R', G', B' values and Δ, Cmaxand Cmin values obtained from these values, Hue(H), Saturation(S) and Value(V) values are calculated as in Eqns. (1)-(3).
Hue calculation:
$H=\left\{\begin{array}{cc}0^{\circ} & \Delta=0 \\ 60^{\circ} \times\left(\frac{G^{\prime}-B^{\prime}}{\Delta} \bmod 6\right), & C_{\max }=R^{\prime} \\ 60^{\circ} \times\left(\frac{B^{\prime}-R^{\prime}}{\Delta} \bmod 6\right), & C_{\max }=G^{\prime} \\ 60^{\circ} \times\left(\frac{R^{\prime}-G^{\prime}}{\Delta} \bmod 6\right), & C_{\max }=B^{\prime}\end{array}\right.$ (1)
Saturation calculation:
$S=\left\{\begin{array}{cc}0 & C_{\max }=0 \\ \frac{\Delta}{C_{\max }} & C_{\max } \neq 0\end{array}\right.$ (2)
Value calculation:
$V=C_{\max }$ (3)
In the CIE 1931 converting, the X, Y and Z values are the sum of the impulses sent to the brain by the nerves that allow the perception of the three primary colors (red, green, and blue). The ratio of each of the three stimuli to the total amount of stimulus separately defines the color. The detection rate of red, green and blue is as in Eq. (4).
$x=\frac{X}{X+Y+X}$
$y=\frac{Y}{X+Y+Z}$
$z=\frac{Z}{X+Y+Z}$ (4)
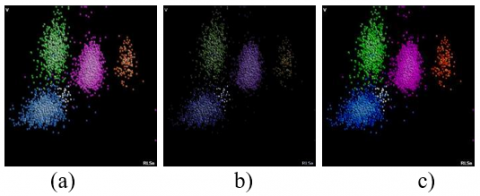
Figure 4 shows the Scattergram images obtained with the HSV and CIE 1931 conversions applied to the raw scattergram image.
Figure 4. a) Raw b) CIE 1931 c) HSV images
Therefore, the three different data sets (raw, HSV and CIE 1931) are obtained. In each of the HSV and CIE-1931 applied datasets, 335 more images are created and the workspace is expanded. The purpose of these conversions is to generate additional feature vectors to the feature vector to detect COVID-19 in raw scattergram images. In this paper, the extraction of feature vectors of images is performed using CNN.
4.2 Feature extraction
Deep learning driven models have recently proven successful in many clinical applications [30-32]. These models outperform traditional mathematical models in terms of manually extracted features in medical image processing and machine vision. At this stage, AlexNet, ResNet50, GoogleNet and MobileNetv2 are used as feature extractors. Considering the performances presented in the experimental results section, AlexNet gives more successful results than other models. The feature vectors in the fully connected layer of the AlexNet model are obtained for all three data sets. The size of the feature vector obtained for each model is 1x1000. The mathematical definition for combining the obtained feature vectors and obtaining the 1x3000 dimensional feature vector is as follows.
Let it be images from IRaw, IHSV, ICIE datasets. By feeding these images to CNN, the feature vectors in the fc8 layer are obtained, respectively, FRaw, FHSV, FCIE.
FRaw=AlexNet(IRaw)
FHSV=AlexNet(IHSV)
FCIE=AlexNet(ICIE)
In this case, with the combining function of these 1x1000 vectors, a combined feature vector Ꞙ of 1x3000 is obtained. Eq. (5) depicts the concatenated matrix,
Ꞙ= FRaw | FHSV | FCIE (5)
where, | is the concatenation operator.
4.3 Feature selection
Feature selection is defined as the selection of the best subset that can represent the original dataset. We apply feature selection to reduce the number of features in the dataset by selecting the most important features in Ꞙ and to identify features that maximize classification accuracy. In this paper, ReliefF [33] algorithm, which is one of the nonlinear feature selection methods, is used. As a result of the ReliefF algorithm, the weight value of each attribute is obtained. Higher value attributes are attributes that show better predictive results. The procedure for updating the weight of the attribute is as Figure 5. These weights are calculated by repeating Eq. (6) n times. n is the number of samples, wi is the weight of the feature, nearHiti is the related feature value in the closest sample with the same class, and nearMissi is the related feature value in the closest sample with a different class.
$w_{i}=w_{i-1}-\left(x_{i}-\text { nearHit}_{i}\right)^{2}+\left(x_{i}-\text { nearMiss}_{i}\right)^{2}$ (6)
To fit the pre-trained AlexNet model structure, the first 1000 features of the Ꞙs feature vector (Ꞙs1000) sorted according to their 1x3000 dimensional weights are fed to the SVM algorithm. The Ꞙs1000 feature vector contains features from Raw, HSV and CIE-1931 datasets. After this stage, it is important to determine the features that maximize the classification success.
Figure 5. The ReliefF algorithm flowchart
4.4 Support Vector Machine
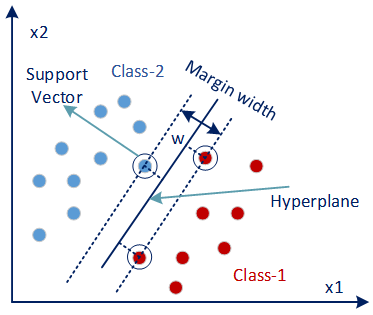
Support Vector Machines [34] are mainly used to optimally separate data belonging to two classes. For this, decision boundaries or in other words hyper planes are determined as shown in Figure 6.
Figure 6. Hyper plane
In order to make the classification, a line is drawn that separates the two classes. The wider the margin of the region between ±1 of the line, the better the classification. Support vectors are calculated as in Eq. (7).
$\hat{y}=\left\{\begin{array}{lll}0 & \text { if } & w^{T} \cdot x+b<0 \\ 1 & \text { if } & w^{T} \cdot x+b \geq 0\end{array}\right.$ (7)
w; weight vector, x; input vector, b; is a deviation. If the result obtained for data is less than 0, it will belong to class1 otherwise it will belong to class2.
Each sequential permutation of Ꞙs1000 is given as input to the SVM algorithm to determine the number of features that maximize the classification accuracy in the Ꞙs1000 feature vector. Thus, the features that maximize the classification accuracy are determined. The following pseudo code shows the classification structure performed by giving each ordered permutation of the Ꞙs1000 feature vector to the SVM input.
Algorithm 1. Determining the feature that maximizes the classification accuracy (FSVM)
|
Procedure SVM (Ꞙs1000) |
|
for i:1 to 1000 for j:1 to i FSVM=Ꞙs1000 (1,j) end SVM (FSVM, class) // Classifying the new feature vector with the SVM classification algorithm. end Output: Performance Metrics |
5.1 Metrics
The current study aims to classify Scattergram images from patients into COVID-19 and Non-COVID-19 categories. Confusion matrix-based performance metrics are used to evaluate the effectiveness of the proposed classification model. These metrics are given in Table 1. The important thing here is to minimize false negative and false positive results in the modeling process, especially for critical diseases such as COVID-19.
Table 1. Performance metrics
|
$S=\frac{T P}{T P+F N}$ |
|
$S p e c=\frac{T N}{F P+T N}$ |
|
$P=\frac{T P}{T P+F P}$ |
|
$N P V=\frac{T N}{T N+F N}$ |
|
$F P R=\frac{F P}{F P+T N}$ |
|
$F D R=\frac{F P}{F P+T P}$ |
|
$F N R=\frac{F N}{F N+T P}$ |
|
$A=\frac{T P+T N}{T P+T N+F P+F N}$ |
|
$F_{1}=\frac{2 T P}{2 T P+F P+F N}$ $M C C=\frac{T P \cdot T N-F P \cdot F N}{\sqrt{(T P+F N) \cdot(T P+F P) \cdot(T N+F P) \cdot(T N+F N)}}$ |
Sensitivity (S), Specificity (Spec), Precision (P), Negative Predictive Value (NPV), False Positive Rate (FPR), False Discovery Rate (FDR), False Negative Rate (FNR), Accuracy (A), F1 Score (F1), Matthews Correlation Coefficient (MCC).
5.2 Experimental results
This section provides comparative analyzes of pre-trained AlexNet, ResNet50, GoogleNet and MobileNetv2 and the proposed classification model. All models use 5-fold cross validation to avoid over-fitting issues. The training, validation and testing rate of the data set was determined as 60%,10 and 30%, respectively. An 8GB GPU, Intel Core i7 laptop was used to run the MATLAB software for the evaluation of both pre-trained models and the proposed system.
In order to classify COVID-19 images and obtain the most appropriate model, scattergram images were first classified with the widely used pre-trained AlexNet, GoogleNet, ResNet50, and MobileNetv2 architectures that have proven successful in computer vision and medical diagnosis. Classification was carried out by taking cross-validation 5 for each architecture. Table 2 shows the overall accuracy values obtained for the classification results.
Table 2. Accuracy values of the pre-trained models used
|
Model |
Accuracy |
|
AlexNet |
84.8 |
|
GoogleNet |
88 |
|
ResNet50 |
92.8 |
|
MobileNetv2 |
91.6 |
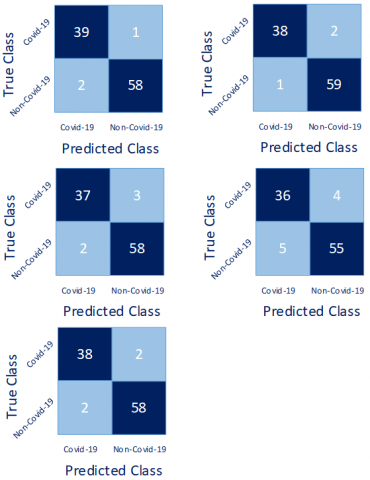
According to Table 2, the most successful CNN model is ResNet50. All models performed poorly in classifying Scattergram images. We propose the model in Figure 3 to improve classification accuracy. For feature extraction, which is the second step of the model, pre-trained AlexNet, GoogleNet, ResNet50 and MobileNetv2 were used. Five-fold cross validation was applied for each model. Feature vectors in the fully connected layer of all models are used. The highest accuracy value among these models was obtained with the AlexNet model. Figure 7 shows the confusion matrices obtained as a result of applying Cross-Validation.
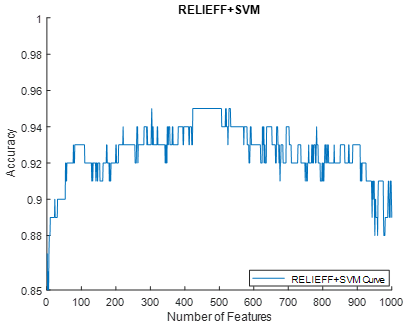
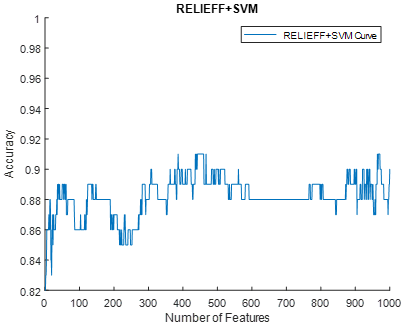
Table 3 shows the classification parameters of the cross validation. The features used and the change of classification accuracy with the application of ReliefF feature selection algorithm and SVM algorithm are given in Figure 8. The highest accuracy values were obtained by using the 923, 638, 304, 386, and 96 features, respectively, and the overall accuracy was 95.2%, and the F1-Score was 94.1%.
Figure 7. Confusion matrices
Table 3. The performance metrics for cross validation
|
S (%) |
95.12 |
97.44 |
94.87 |
87.80 |
95 |
|
Spec (%) |
98.31 |
96.72 |
95.08 |
93.22 |
96.67 |
|
P (%) |
97.50 |
95 |
92.50 |
90 |
95 |
|
NPV (%) |
96.67 |
98.33 |
96.67 |
91.67 |
96.67 |
|
FPR (%) |
1.69 |
3.28 |
4.92 |
6.78 |
3.33 |
|
FDR (%) |
2.5 |
5 |
7.5 |
10 |
5 |
|
FNR (%) |
4.88 |
2.56 |
5.13 |
12.20 |
5 |
|
A (%) |
97 |
97 |
95 |
91 |
96 |
|
F1-Score (%) |
96.3 |
96.2 |
93.67 |
88.89 |
95 |
|
MCC (%) |
93.8 |
93.74 |
89.56 |
81.35 |
91.67 |
Figure 8. The variation of classification accuracy according to the features used
The performance comparison of the proposed model and the current models proposed for RT-PCR, CT and X-Ray is presented in Table 4. The purpose of the proposed model is to show that COVID-19 is detectable from Scattergram images. The accuracy value obtained according to Table 4 is higher than the studies performed with RT-PCR. The accuracy value obtained in the proposed model is on average close to the accuracy values in studies conducted with CT.
COVID-19 tests to diagnose the disease at an early stage; It helps to start the treatment, isolation and prevention process early. The RT-PCR test is a molecular diagnostic test that detects the genetic makeup of viruses. It enables the identification of people who have caught COVID-19 and are actively carrying the virus. In the RT-PCR test, which has low test sensitivity, the test results approximately 3-4 hours after the swab samples are taken. The antigen test, which is less sensitive than the RT-PCR test, may produce negative results in the first few days after the virus is infected in the body. CT and X-Ray imaging is a reliable, practical and rapid method for diagnosing and evaluating COVID-19 in the lung. However, its effects on human health are disadvantageous. In this paper, CNN-based classification using WBC-DIFF scattergram images is proposed to overcome the existing disadvantages of existing tests. A comparative-summary diagram of the tests is given in Figure 9.
Table 4. State-of-the art methods and comparison
|
Ref. |
Description |
Parameters (%) |
|
[7] |
Data: CT Subject: 2482 Classification: COVID-19, Non-COVID-19 Classifier: convolutional auto-encoder neural network (CAENN) |
A=94 |
|
[8] |
Data: CT, RT-PCR Subject: 536 Classification: COVID-19, Non-COVID-19 Classifier:Logistic regression, RF, NN |
AUC=93 |
|
[9] |
Data: RT-PCR Subject:199 Classification: COVID-19, Non-COVID-19 Classifier: Conic Net |
A=91.4 S=94.1 Spec=88.7 |
|
[10] |
Data: RT-PCR Subject:5643 Classification: COVID-19, Non-COVID-19 Classifier: ANN, DT, PLS-DA, KNN |
A=94-98 |
|
[17] |
Data :CT Subject: 852 Classification: COVID-19, Non-COVID-19, pneumonia Classifier: CNN |
A=96.22 S=94.96 Spec=97.61 P=97.77 |
|
[18] |
Data: CT Subject: 1489 Classification: COVID-19, Non-COVID-19 Classifier: COVIDx-CT (CNN) |
A=99.1 |
|
[19] |
Data: CT Subject: 1065 Classification: COVID-19, Non-COVID-19, viral pneumonia Classifier: Inception transfer-learning |
A=89.5 S=87 Spec=88 |
|
[21] |
Data: CT Subject: 1050 Classification: COVID-19, Non-COVID-19, pneumonia Classifier: VGG16 and ResNet50 |
A=88.52 |
|
[22] |
Data: CT, X-Ray Subject: 60 Classification: COVID-19, Non-COVID-19, pneumonia Classifier: AlexNet, DenseNet, NASNet-Mobile, DarkNet |
A=99.08 |
|
[23] |
Data: CT Subject: 708 Classification: COVID-19, Non-COVID-19 Classifier: CNN |
A=97.88 P=97.94 F1-Score=97.8 |
|
[24] |
Data: CT Subject: 210 Classification: COVID-19, Non-COVID-19, viral pneumonia Classifier: COVID-Nets |
A= 93.96 S=94 Spec=97.73 |
|
[25] |
Data: CT Subject: 1460 Classification: COVID-19, Non-COVID-19, viral pneumonia Classifier: COVID-Nets |
S=98 Spec=96 |
|
Proposed |
Data: Scattergram Images Subject: 335 Classification: COVID-19, Non-COVID-19 Classifier: AlexNet-based Hybrid CNN |
A=95.2 F1-Score: 94.01 |
With the proposed method and the scattergram images used in this study, the detection of COVID-19 was performed with an accuracy of 95.2%. The advantage of this method is the use of easily accessible scattergram images from routine WBC subgroups (lymphocyte, monocytes, eosinophils, basophils, neutrophils) requested from almost all patients.
In patients with COVID-19, lymphopenia is frequently observed, varying according to disease severity, and the observed low lymphocyte count is evident in most patients at the time of admission to hospital [35, 36]. The reduction in lymphocyte count is associated with lymphocyte apoptosis, autophagy, and complex cytokine activities [37]. In addition, monocytopenia and eosinopenia are quite prominent in these patients [38]. In the study of Pozdnyakova et al. in which patients were classified according to the severity of COVID-19, they noted the presence of neutrophilia and left-shifted granulopoiesis (neutrophilia and left-shifted granulopoiesis) in intensive care patients and the presence of atypical lymphocytes and large granular lymphocytes in other groups [39].
Figure 9. Tests comparison
With the classification of raw scattergram images, the highest ResNet50 model was obtained with 92.8% (Table 2). The working space has been expanded by applying HSV and CIE 1931 converts to raw scattergram images for the detection of COVID-19 with high accuracy. Thus, more features are extracted from each scattergram image. ReliefF algorithm was used to determine the features that maximize the classification accuracy. Finally, classification was completed with SVM, which provides high accuracy for binary classification.
The abnormal WBC morphology seen in COVID-19 patients is remarkable and important enough to guide us from diagnosis to treatment. WBC-DIFF scattergram images are very important and valuable in this respect, where we can both see the cell distributions and provide information about the WBC sub-groups and the left shift, atypical/blast cell distributions, immature granulocyte, etc. For this reason, we think that our study can guide scientists in diagnosing COVID-19 through WBC-DIFF scattergram images.
It is important to detect and quarantine patients early and with high accuracy in the COVID-19 epidemic, which creates problems in all areas of life. The biggest challenge in the tests used are sensitivity and effects on human health. In this paper, a CNN-based model using WBC scattergram images was proposed to overcome these disadvantages. The most important feature of the study is that the WBC-DIFF scattergram images that can be obtained from CBC measurements are easily accessible and that COVID-19 can be determined with the proposed method. The detection of COVID-19, especially from scattergram images, is an important contribution of the study to the literature.
Ethics approval for the study protocol was obtained from the local area heath ethics committee. It is approved by the Ministry of Health of the Republic of Turkey with the form number 2021-01-13T13_56_35.
[1] Sudre, C.H., Li, W., Vercauteren, T., Ourselin, S., Jorge Cardoso, M. (2017). Generalised dice overlap as a deep learning loss function for highly unbalanced segmentations. In Deep Learning in Medical Image Analysis and Multimodal Learning for Clinical Decision Support, pp. 240-248. https://doi.org/10.1007/978-3-319-67558-9_28
[2] Tuncer, S.A., Akılotu, B., Toraman, S. (2019). A deep learning-based decision support system for diagnosis of OSAS using PTT signals. Medical Hypotheses, 127: 15-22. https://doi.org/10.1016/j.mehy.2019.03.026
[3] Tuncer, S.A., Çınar, A., Fırat, M. (2021). Hybrid CNN based computer-aided diagnosis system for choroidal neovascularization, diabetic macular edema, drusen disease detection from OCT images. Traitement du Signal, 38(3): 673-679. https://doi.org/10.18280/ts.380314
[4] Toğaçar, M., Ergen, B., Cömert, Z., Özyurt, F. (2020). A deep feature learning model for pneumonia detection applying a combination of mRMR feature selection and machine learning models. IRBM, 41(4): 212-222. https://doi.org/10.1016/j.irbm.2019.10.006
[5] Toğaçar, M., Ergen, B., Cömert, Z. (2020). COVID-19 detection using deep learning models to exploit Social Mimic Optimization and structured chest X-ray images using fuzzy color and stacking approaches. Computers in Biology and Medicine, 121: 103805. https://doi.org/10.1016/j.compbiomed.2020.103805
[6] Yildirim, M., Cinar, A.C. (2020). A deep learning based hybrid approach for COVID-19 disease detections. Traitement du Signal, 37(3): 461-468. https://doi.org/10.18280/ts.370313
[7] Fouladi, S., Ebadi, M.J., Safaei, A.A., Bajuri, M.Y., Ahmadian, A. (2021). Efficient deep neural networks for classification of COVID-19 based on CT images: Virtualization via software defined radio. Computer Communications, 176: 234-248. https://doi.org/10.1016/j.comcom.2021.06.011
[8] Gangloff, C., Rafi, S., Bouzillé, G., Soulat, L., Cuggia, M. (2021). Machine learning is the key to diagnose COVID-19: A proof-of-concept study. Scientific Reports, 11(1): 1-11. https://doi.org/10.1038/s41598-021-86735-9
[9] Langer, T., Favarato, M., Giudici, R., et al. (2020). Development of machine learning models to predict RT-PCR results for severe acute respiratory syndrome coronavirus 2 (SARS-CoV-2) in patients with influenza-like symptoms using only basic clinical data. Scandinavian Journal of Trauma, Resuscitation and Emergency Medicine, 28(1): 1-14. https://doi.org/10.1186/s13049-020-00808-8
[10] de Fátima Cobre, A., Stremel, D.P., et al. (2021). Diagnosis and prediction of COVID-19 severity: Can biochemical tests and machine learning be used as prognostic indicators? Computers in Biology and Medicine, 134: 104531. https://doi.org/10.1016/j.compbiomed.2021.104531
[11] Hemdan, E.E.D., Shouman, M.A., Karar, M.E. (2020). Covidx-net: A framework of deep learning classifiers to diagnose covid-19 in x-ray images. arXiv preprint arXiv:2003.11055.
[12] Narin, A., Kaya, C., Pamuk, Z. (2021). Automatic detection of coronavirus disease (COVID-19) using x-ray images and deep convolutional neural networks. Pattern Analysis and Applications, 24(3): 1207-1220. https://doi.org/10.1007/s10044-021-00984-y
[13] Afshar, P., Heidarian, S., Naderkhani, F., Oikonomou, A., Plataniotis, K.N., Mohammadi, A. (2020). Covid-caps: A capsule network-based framework for identification of COVID-19 cases from x-ray images. Pattern Recognition Letters, 138: 638-643. https://doi.org/10.1016/j.patrec.2020.09.010
[14] Luo, L., Luo, Z., Jia, Y., Zhou, C., He, J., Lyu, J., Shen, X. (2020). CT differential diagnosis of COVID-19 and non-COVID-19 in symptomatic suspects: A practical scoring method. BMC Pulmonary Medicine, 20(1) : 1-9. https://doi.org/10.1186/s12890-020-1170-6
[15] Li, K., Fang, Y., Li, W., et al. (2020). CT image visual quantitative evaluation and clinical classification of coronavirus disease (COVID-19). European radiology, 30(8): 4407-4416. https://doi.org/10.1007/s00330-020-06817-6
[16] Gao, J., Liu, J.Q., Wen, H.J., et al. (2020). The unsynchronized changes of CT image and nucleic acid detection in COVID-19: Reports the two cases from Gansu, China. Respiratory Research, 21(1): 1-4. https://doi.org/10.1186/s12931-020-01363-7
[17] Pathak, Y., Shukla, P.K., Tiwari, A., Stalin, S., Singh, S. (2020). Deep transfer learning based classification model for COVID-19 disease. IRBM, 43(2): 87-92. https://doi.org/10.1016/j.irbm.2020.05.003
[18] Hayden, G., Linda, W., Alexander, W. (2020). COVIDNet-CT: A tailored deep convolutional neural network design for detection of COVID-19 cases from chest CT images. Frontiers in Medicine, 7: 1025. https://doi.org/10.3389/fmed.2020.608525
[19] Wang, S., Kang, B., Ma, J., Zeng, X., Xiao, M., Guo, J., Cai, M., Yang, J., Li, Y., Meng, C., Xu, B. (2020). A deep learning algorithm using CT images to screen for Corona Virus Disease (COVID-19). European Radiology, 31(8): 6096-6104. https://doi.org/10.1007/s00330-021-07715-1
[20] Li, W., Chen, J., Chen, P., Yu, L., Cui, X., Li, Y., Cheng, F., Ouyang, W. (2021). NIA-Network: Towards improving lung CT infection detection for COVID-19 diagnosis. Artificial Intelligence in Medicine, 117: 102082. https://doi.org/10.1016/j.artmed.2021.102082
[21] Mishra, N.K., Singh, P., Joshi, S.D. (2021). Automated detection of COVID-19 from CT scan using convolutional neural network. Biocybernetics and Biomedical Engineering, 41(2): 572-588. https://doi.org/10.1016/j.bbe.2021.04.006
[22] Chaddad, A., Hassan, L., Desrosiers, C. (2021). Deep CNN models for predicting COVID-19 in CT and x-ray images. Journal of Medical Imaging, 8(S1): 014502. https://doi.org/10.1117/1.JMI.8.S1.014502
[23] Carvalho, E.D., Carvalho, E.D., de Carvalho Filho, A.O., De Sousa, A.D., Rabúlo, R.D. A.L. (2020). COVID-19 diagnosis in CT images using CNN to extract features and multiple classifiers. In 2020 IEEE 20th International Conference on Bioinformatics and Bioengineering (BIBE), pp. 425-431. https://doi.org/10.1109/BIBE50027.2020.00075
[24] Alshazly, H., Linse, C., Abdalla, M., Barth, E., Martinetz, T. (2021). COVID-Nets: Deep CNN architectures for detecting COVID-19 using chest CT scans. PeerJ Computer Science, 7: e655. https://doi.org/10.7717/peerj-cs.655
[25] Fang, L., Wang, X. (2021). COVID-19 deep classification network based on convolution and deconvolution local enhancement. Computers in Biology and Medicine, 135: 104588. https://doi.org/10.1016/j.compbiomed.2021.104588
[26] Krizhevsky, A., Sutskever, I., Hinton, G.E. (2012). Imagenet classification with deep convolutional neural networks. Advances in Neural Information Processing Systems.
[27] He, K., Zhang, X., Ren, S., Sun, J. (2016). Deep residual learning for image recognition. In Proceedings of the IEEE Conference on Computer Vision and Pattern Recognition, pp. 770-778.
[28] Szegedy, C., Liu, W., Jia, Y., et al. (2015). Going deeper with convolutions. In Proceedings of the IEEE Conference on Computer Vision and Pattern Recognition, pp. 1-9. https://doi.org/10.1109/CVPR.2015.7298594
[29] Sandler, M., Howard, A., Zhu, M., Zhmoginov, A., Chen, L.C. (2018). Mobilenetv2: Inverted residuals and linear bottlenecks. In Proceedings of the IEEE Conference on Computer Vision and Pattern Recognition, pp. 4510-4520. https://doi.org/10.1109/CVPR.2018.00474
[30] Barbero-Gómez, J., Gutiérrez, P.A., Vargas, V.M., Vallejo-Casas, J.A., Hervás-Martínez, C. (2021). An ordinal CNN approach for the assessment of neurological damage in Parkinson’s disease patients. Expert Systems with Applications, 182: 115271. https://doi.org/10.1016/j.eswa.2021.115271
[31] Öztürk, Ş., Özkaya, U. (2021). Residual LSTM layered CNN for classification of gastrointestinal tract diseases. Journal of Biomedical Informatics, 113: 103638. https://doi.org/10.1016/j.jbi.2020.103638
[32] Eltrass, A.S., Tayel, M.B., Ammar, A.I. (2021). A new automated CNN deep learning approach for identification of ECG congestive heart failure and arrhythmia using constant-Q non-stationary Gabor transform. Biomedical Signal Processing and Control, 65: 102326. https://doi.org/10.1016/j.bspc.2020.102326
[33] Robnik-Šikonja, M., Kononenko, I. (2003). Theoretical and empirical analysis of ReliefF and RReliefF. Machine Learning, 53(1): 23-69. https://doi.org/10.1023/A:1025667309714
[34] Boser, B.E., Guyon, I.M., Vapnik, V.N. (1992). A training algorithm for optimal margin classifiers. In Proceedings of the Fifth Annual Workshop on Computational Learning Theory, pp. 144-152. https://doi.org/10.1145/130385.130401
[35] Chen, G., Wu, D.I., Guo, W., et al. (2020). Clinical and immunological features of severe and moderate coronavirus disease 2019. The Journal of Clinical Investigation, 130(5): 2620-2629. https://doi.org/10.1172/JCI137244
[36] Yuan, X., Huang, W., Ye, B., et al. (2020). Changes of hematological and immunological parameters in COVID-19 patients. International Journal of Hematology, 112(4): 553-559. https://doi.org/10.1007/s12185-020-02930-w
[37] Xiong, Y., Liu, Y., Cao, L., et al. (2020). Transcriptomic characteristics of bronchoalveolar lavage fluid and peripheral blood mononuclear cells in COVID-19 patients. Emerging Microbes & Infections, 9(1): 761-770. https://doi.org/10.1080/22221751.2020.1747363
[38] Anurag, A., Jha, P.K., Kumar, A. (2020). Differential white blood cell count in the COVID-19: A cross-sectional study of 148 patients. Diabetes & Metabolic Syndrome: Clinical Research & Reviews, 14(6): 2099-2102. https://doi.org/10.1016/j.dsx.2020.10.029
[39] Pozdnyakova, O., Connell, N.T., Battinelli, E.M., Connors, J.M., Fell, G., Kim, A.S. (2021). Clinical significance of CBC and WBC morphology in the diagnosis and clinical course of COVID-19 infection. American Journal of Clinical Pathology, 155(3): 364-375. https://doi.org/10.1093/ajcp/aqaa231