Mazar Pasha Lubna Taranum* | Jangam Siddamallaiah Rajashekar
© 2022 IIETA. This article is published by IIETA and is licensed under the CC BY 4.0 license (http://creativecommons.org/licenses/by/4.0/).
OPEN ACCESS
Diabetic Retinopathy (DR) is the most well-known disease in association with diabetes. Even before DR is diagnosed, many people lose their sight, however, because to the lengthy diagnostic process and the current dearth of ophthalmologists. Early detection of diabetic retinopathy is also recommended. If the condition is not addressed soon, vision loss may ensue. Manual diagnosis of DR retina imaging data by ophthalmologists involves time, effort, and money, and is prone to error, in contrast to computer-aided diagnosis techniques. Recent advances in deep learning have made it one of the most extensively utilized approaches for increasing performance in a variety of industries, including medical image classification and segmentation. Because they function so well, convolutional layers are more often employed in medical image analysis as a deep learning method. This research work implements an effective Image Edge Weighted Linked Segmentation Model using Deep Learning (EWLSM-DL) for accurate and quick detection of diabetic retinopathy using image enhancement and deep learning technologies to prevent the resulting retinal damage. The proposed model is compared with the traditional methods in terms of accuracy in detection and the proposed model exhibits better results.
diabetic retinopathy, image segmentation, deep learning, neurons, vision loss, edge weighted linked segmentation, image enhancement
Diabetes is a widespread condition that has been on the rise all over the world. It is mostly linked to insulin production and excessive blood sugar levels in the body [1], which leads to abnormal metabolic processes and problems such as cardiovascular disease [2], kidney failure, neurological issues, and diabetes mellitus [3], among others. Visual impairment is a serious disorder of the eyes that causes irreversible loss of vision [4]. When a person has a family history of diabetes, they are more likely to get the condition, regardless of whether they are type 1 or type 2 diabetic [5]. This risk increases with age. WHO states that Diabetic Retinopathy (DR) is a serious eye condition that needs immediate international attention [6]. There are approximately 12,000 ophthalmologists in India for every 60 million diabetics who have an eye issue, according to a survey. The overwhelming majority of patients have no idea they have this disease, which is why there are so many of them. On top of all of that, they exhibit a callous and careless attitude toward the disease itself [7].
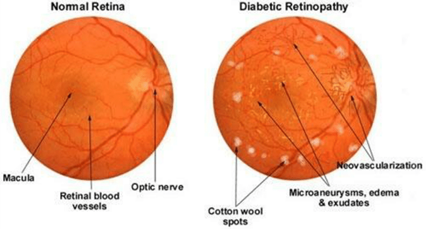
About 18% of diabetics have DR, and a diabetic person's risk of acquiring DR is 25 times greater than a healthy person. Due to its asymptomatic or minor symptoms [8], this disease goes unnoticed at first and later leads to visual impairments [9]. Thus, detecting DR early is critical to avoiding the disorder's complications [10]. In order to properly diagnose this disease, doctors and specialists must have access to advanced technology, such as equipment and techniques, that help them make progress in improving the prognosis for patients with this ailment. The Figure 1 shows the normal and diabetic retinopathy images.
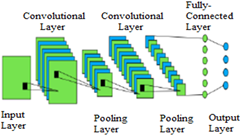
Figure 1 depicts a normal retina and a retina affected by diabetic retinopathy, respectively. Since the classification and circumspection of the severity level of DR [11] require an infallible automatic detection technique. In the domain of DR, most research was done using machine learning algorithms for feature extraction [12], however problems arose when manual feature extraction was used, leading researchers to look into deep learning. Many computers assisted technologies including data mining, image analysis, machine learning [13], and deep learning [14] have sprung up as a result of advances in the medical industry. In the last several years however, Deep Learning has been increasingly popular across numerous sectors such as sentiment analysis [15], handwritten notes recognition [16] and stock market forecasting. When it comes to picture categorization, Convolutional Neural Networks (CNN) [17], deep learning seems to deliver positive results. Figure 2 depicts CNN's layer-by-layer design.
In deep networks, CNNs are a subset whose primary purpose is to decode visual data directly from the pixels that make up the picture [18]. A useful way to describe CNN layers is to think of them as having varying shades or levels of lightness. In addition to the need for additional training databases and the complexity and time of the active learning approach, using CNN has a number of constraints. The input layer of CNN architecture encodes and decodes image pixels [19]. The first layer of CNN may detect a simple boundary or change in brightness. A dynamic function or an artefact can be discovered in later levels. Clustering techniques can reduce the size of the function diagram, as well as the number of parameters and the computational complexity [20]. Each stage in production may make advantage of the pooling layers. It is possible to create function maps centered on the previously sorted frames by separating pooling layers into edged planes. Classification results were delivered to the last link in the chain by categorizing inputs in linked layers, and the output layer is the final link.
Figure 1. Normal and diabetic retinopathy image
Figure 2. Architecture of CNN
The methods used to detect DR features, namely exudates, hemorrhages and blood vessels can be categorized into several stages which are image pre-processing, vessel and hemorrhages detection, optic disc removal and exudate detection. However, the detection for blood vessel and hemorrhages was performed simultaneously due to similar intensity characteristics. The proposed algorithm was trained and tested using 49 and 89 fundus images, respectively.
As the condition worsens, patients may have symptoms such as blurred vision, floaters, fluctuating vision, black spots in their field of vision, reduced night vision, diminished colour perception, and even loss of vision. Since blindness can be prevented by early detection of DR, it is crucial to develop methods that can do this. Retinopathy severity can currently be assessed by direct and indirect ophthalmoscopy, fundus pictures photography, and fluorescein angiography. These are labor-intensive, time-consuming procedures that necessitate the services of ophthalmologists with specific training in this field. Exudates, haemorrhages (HA), and microaneurysms (MAs) are all examples of lesions. Exudates develop when cholesterol or lipids from the blood accumulate in the retinal arteries, causing lipid leakage. It appears in the form of little, spherical, yellow dots. Light cannot pass through the retina because to tiny patches of blood that break into the retina's middle layers. Occlusion of vascular capillaries causes frequent fluid leakage, resulting in the appearance of red dots in the retina in the case of microaneurysms, which are enlarged aneurismal retina vessels. When these signs and symptoms are present, the intensity of DR illness can be classified as either non-proliferative or proliferative (PDR). Blood vessels in NPDR do not grow new blood vessels; instead they bleed, resulting in the formation of fluids and/or blood.
For the segmentation of fundus photographs based on severity level, the current research uses deep learning methodology, particularly CNN version DenseNet [21, 22], which extracts features automatically rather than manually. This study used a combination of Kaggle's "Diabetic Retinopathy Detection" 2015 and Kaggle's "Aptos 2019 Blindness Detection" data sets. Early discovery of DR eye disease can halt or stop the progression of eye damage surgically, but without treatment, irreversible damage [23] will be done to the eyes and blindness would result in advanced stages. It is difficult and time-consuming to manually diagnose disease in the retina; therefore, a system that can evaluate the retina automatically [24] and monitor disease progression will be extremely beneficial to both patients and ophthalmologists [25].
Deep learning has recently been developed for use as a critical device to automate a task in people's daily lives for computer vision diagnostics and classification of photos. It has been a long time since the creation of CNN for object identification, segmentation, and classification [26]. If you're looking for a system that can help you categorize and recognize images, CNNs are the best option. The application of CNN to image analysis and recognition of people and objects has yielded promising results [27]. Another benefit of the CNN is that it can be used for many medical imaging concerns. Retinal analysis relies heavily on the use of CNNs. It is possible to adequately classify retinal injury using CNNs and to extract its properties [28]. Numerous studies have been conducted on exudates, often known as mild lesions. Diabetic retinopathy can also be used to rate retinal scans as a whole. Pre-processing techniques [29] are used to extract a wide range of features, which are subsequently categorized according to their specific fields of research.
Diabetes Mellitus is also one of the major issues that has captivated the attention of people all around the world. Finding the best options for detection of this condition and so preventing premature changes in vision receives the focus of numerous studies. A great deal of research has been done and is being done in this area to make the lives of doctors and patients easier. Several studies on diabetic retinopathy are reviewed in this section. Diabetic retinopathy detection was carried out by Calleja et al. [1] using a two-stage procedure that included feature extraction using LBP (Local Binary Patterns) and classification using SVM and Random Forest from machine learning. The confusion matrix outperformed the SVM in terms of accuracy, coming in at 97.46%. However, with only 71 photos, the study had a tiny dataset.
DR was previously detected using computer-based methodologies based on manual feature extraction. According to Acharya et al. [2], 331 fundus photos were used for SVM models with an accuracy of over 85%. Features including blood vessels, vasculature, exudates, and haemorrhages were used in the experimentation Anant et al. [3] used a database called DIARETDB1 to detect DR with 97.95 percent accuracy utilising texture and feature descriptors discovered in their literature. M.Gandhi.et al. proposed employing fundus images to detect exudates using an SVM classifier [4]. For DR, several researchers are attempting to combine manual feature extraction with deep learning. Orlando et al. [5] employed CNN for feature extraction to detect red lesions in the retina of an eye using hand-crafted features, as one example of this approach.
Diabetes-related heart disease and skin cancer were predicted using machine learning methods by Preetha et al. [6]. This was done with an eye toward both positive and negative outcomes. The use of machine learning or data mining techniques to diagnose diabetic retinopathy has been extensively studied and worked on, but a new approach has arisen. Sadda et al. [7] used a quantitative method to identify new parameters for diagnosing the proliferation of diabetic retinopathy. Based on the belief that determining the number, location and size of lesions can aid in the prognosis of retinal disease. The methods employed in this study were basic imaging data, widescreen monitor Field Image Lesion Classification, Quantitative Lesion Parameters, and Statistical Analysis. Comparisons of lesions were made based on tumour number, surface area, and distance from the ONH centre, as well as regression analysis.
With the goal of providing extensive insights into current research, Amin et al. [8] evaluated several ways for detecting haemorrhages in diabetic retinal disease as well as micro-and macro-aneurysms in the blood vessels, as well as exudates. Many different pre-processing and segmentation techniques have been studied, and a detailed procedure for identifying diabetic retinopathy in human eyes has been provided by Kumaran and Patil [9], and Chetoui et al. [10] employ machine learning to diagnose DR using SVM and texture features. Local Matrix multiplication Pattern (LTP) and LESH (Local Fuel Shape Histogram) texturing features outperformed Local Binary Pattern. SVM helped LESH reach an accuracy of 90.4%.
Many options for preventing a condition like diabetic retinopathy are being revealed to the popularity of deep learning among researchers for tasks like detection, forecasting and classification. Sadek et al. [11] used a deep learning approach to automatically detect diabetic retinopathy. They classified diabetes into three categories: normal, exudates, and drusen using a four-layer convolutional neural network. In comparison to the Bag - of - word method, this one was 91%-92% accurate. Zago et al. [12] used a network model specifically fully convolutional approach to develop a lesion localized model in order to address the model's complexity and increase performance. Instead of using segmentation, the regions were localised. The Standard Diabetic Retinopathy Registry and DIARETDB1 were utilised to train two convolutional networks, and a sensitivity of 94% to 95% was found.
A GPU-based convolutional neural network was utilised by Doshi et al. [13] to classify retinal pictures into five severity levels. An ensemble model comprising the three CNN architectural models that was utilised to assess the performance on kappa metrics in this technique. The ensembling approach had the best results, scoring a whopping 0.3996. There's an Artificial neural technique for categorising retinal images presented by Kaur et al. [14]. In comparison to other machine learning approaches such as support vector machines (SVM), proposed model findings were superior. According to Voets et al. [15], diabetic retinopathy could be detected from fundus using the Kaggle dataset EyePACS. Although this study re-implements previous work, it used a different data set, and the AUC was 95 percent different. The AUC difference between the previous and the basic method is usually quite high.
Diverse researchers have carried out most of the important work on the deep learning CNN method for detecting DR, which has been automatically presented by tools for analysing retinal photographs. The detection of DR using image data and pre-processed photos has been made possible thanks to computer science (GRAY). Mateen et al. [17] provided the necessary functionality, and this was implemented accordingly. According to Gargeya and Leng [19], multi-scale shallow CNNs could improve retinal picture classification. According to trials, the proposed solution can enhance classification accuracy by 4% to 10% on limited datasets. There are a number of competing methods, but this one outperforms them all on a large dataset.
Employing the EyePace DR dataset, Saranya and Prabakaran [23] proposed a model using pre-trained CNN to identify and classify DR symptoms. We'll utilise the images as data for testing and training purposes. Three different pre-trained neural networks were examined in order to acquire the most accurate categorization possible. According to Xu et al. [24], Remidio Endoscopic Phone devices (FOP) can record better retinal images than standard fundus cameras. Using data-driven methodologies, Gargeya et al. [26] have provided a solution for the detection of (rDR) Implementing CNN utilising a transfer learning technique, they employed Kaggle EyePACS as an instruction and the Messidor-2 dataset as a test case.
The major goal of this research is to develop a diabetic retinopathy detection system that is stable and noise compatible. The deep learning technology is used in this study to detect diabetic retinopathy based on severity. Before the images were sent out to the network, they went through a number of steps. Our prototype and the error correction model were both trained in this study, and the accuracies produced by the two methods were compared. Despite the fact that our new model outperformed the DeepDR model. The proposed model framework is shown in Figure 3.
The pseudo code for DR detection is explained clearly in the process.
Input: DR Image MRI
Output: DR prediction set
do
{
IS $\leftarrow$ Load(Image(i))
Perform image segmentation as
IS $\leftarrow$ Sqrt(Image(i))+max(intensity(Image(i))
Perform histogram equalization on the segments.
Apply filtering on the image to remove the noise.
Extract multi layers from the image.
MLT $\leftarrow$ train(image(i))+segment(i)+Threshold.
Calculate the homogeneity levels of each segment to identify the pixels of blood vessels.
Applu activation function and extract the features
Predict the DR using the extracted features
}
While(image(i)ε Dataset(N)).
Figure 3. Proposed methodology
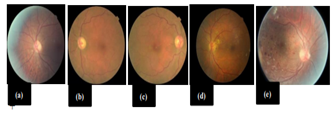
Figure 4. DR image samples based on severity (a) is level ‘0’, (b) is level‘1’, (c) is level ‘2’, (d) is level ‘3’, (e) is level ‘4’
The image samples based on the level of DR is represented in Figure 4 that clearly indicates the level of the disease identified.
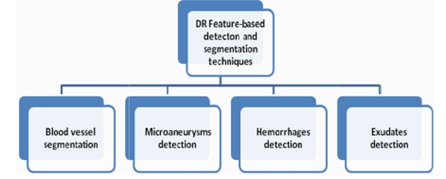
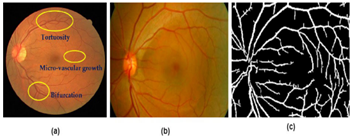
To help retinal experts diagnose and identify numerous retinal disorders such as age-related macular degeneration, hypertensive, glaucoma, and diabetic retinopathy [30], detection and separation of retinal blood vessels are extremely significant. Detection and segmentation of retinal blood vessels also aid in the diagnosis of heart and brain disorders when abnormal alterations occur in the retina's vascular system. Non-invasive fundus imaging [31] has increased the value and use of retinal blood vessel important step in understanding. Extraction and segmentation of blood vessels are shown in visual form in Figure 5.
For retinal fundus images in diabetic retinopathy, a different orientations and noise removal technique was developed. The different types of DR detection and segmentation models on retinal features are depicted in Figure 5. The Figure 6 indicates the blood vessel extraction and segmentation on retinal features.
Figure 5. DR detection and segmentation methods based on retinal features
The major goal of the suggested model is to use a machine learning algorithm to divide and identify DR, as well as to develop the model's categorization criteria. It's proposed that a system be developed to segment images at several stages: removing the surrounding tissue, performing morphological procedures, and then segmenting the resulting images. For doctors, processing such huge and complicated datasets has become a discouraging and laborious task from which useful information might be obtained by hand. Since the operator performs numerous analyses of inter- and intrinsic variability [32], this manual examination is also time demanding and error-prone. These issues necessitate computerised technology advancements for improved diagnosis and subsequent data analysis.
Figure 6. Blood vessels extraction and segmentation (a) Changes in vessels (b) original fundus image (c) extracted vasculature
When appropriately picked, features and qualities of interest can display the diabetic retinopathy in all of its detail to the utmost extent possible on the image. Items and photos are analysed using functional derivative approaches to identify the most important traits that indicate the existence of distinct object classes. Classifiers employ features to assign objects to their correct classes. The method of removing irrelevant elements aims to reduce the amount of initial data by assessing unique traits or features that distinguish one input model from the next.
Essentially, it's a two-function operation that transforms a true statement into another true statement. MRI images are first considered from an Image Set IS, and pixels are retrieved from the images. Use of a two-dimensional image Ig and a two-dimensional kernel K for the storage of pixel representation results in the following calculation.
$\operatorname{Image}_{\operatorname{Set}(x, y)}$$=\sum_{x} \cdot \sum_{y} \operatorname{Image}(x, y)+\operatorname{Image}(i-T 1, j-T 1)$
$\operatorname{Pixel}(\operatorname{set}[N])=\sum_{i=0}^{M} \operatorname{Image} \operatorname{Set}|\operatorname{Image}-j|+\operatorname{edge}(i, j)$
Threshold values x,y represents the x- and y-axis of the pictures, respectively, and adjacent pixels i and j. The discrete convolutional DC operator is calculated as follows on input picture Image and as a recognized kernel filter KF.T1 is the threshold intensity value of image pixel.
$(Image * K F)=\sum_{M} \operatorname{Image}(x, x+1)+\operatorname{Image}(y, y+1)$$-K F(i, j)+\theta$
where, ⍬ is the image's angle is taken into account. In a tree-like diagram, the classification procedure is executed in each node by a variety of groups using a predetermined criterion utilising the Decision Tree's basic algorithm. This method separates the information into manageable subsets in a hierarchical manner. It's common to divide training and testing data using the following equation:
$\operatorname{Data}_{\text {Set\{Train,Test}\}}=\sum_{i \in \text { Image}_{\quad \text {SetR }}} \frac{|\operatorname{Image}(\mathrm{x}, \mathrm{y})|}{|K F|}+\operatorname{Histogram}\left(I(x, y)^{N}\right)$
where, KF is the kernel filter. When separate neuron layers are layered and their outputs are coupled to one another, a multi-layer system is created as shown by the notation
Multi $_{\text {Layer }(x, y)}=$$\operatorname{Image}\left(\sum_{i=1}^{N} \max (\operatorname{Histrogram}(I(x, y)))_{j}\right)$$+\sum_{i=0}^{M}$$\frac{\sum_{i=0}^{M} \text { Data }_{S e t_{i, j}} \quad (\operatorname{Train}(\mathrm{I}(x, y)))^{N}}{(x-\mathrm{y})+K F}$
Using the traditional neural surface and dissociation from specific pictures, researchers were able to extract and isolate 18 text features, such as radius mean, texture mean, perimeter mean, area mean, and fractal dimension mean. Its important features are kept together as a group. A measure of pixels' compactness is utilised to determine the tumour’s relevancy in an image employing homogeneity.
Homogeneity $\left(\right.$ Image $\left._{\operatorname{Set}(W i)}\right)=$$\sum_{i=0}^{N} \frac{\operatorname{Pixel}(i, j)+\sum_{i,=0}^{N} \text { Pixel }_{i, j}(i-j)^{2}}{(i-j)^{2}+T}$
where, T represents the upper limit of the homogeneity calculation threshold. The key component of the architecture is a coevolutionary layer. The number and size of kernels in a given layer are network parameters that must be defined before training. Depending on the requirements, the problem's complexity, and the image resolution, this value can vary greatly. During the training process, the back-propagation method modifies filter kernels that were initially set up randomly.
Because coevolutionary filters are extractors, the outcomes of convolution layer are also referred to as characteristics or maps. Traditional extractors are created by manually, but practical extractors employed by CNN are created by learning immediately from the data. As an example of a feature extractor, consider
$A^{c t} t_{F u n}\left(\operatorname{Image}_{\operatorname{set}(\mathrm{x}, \mathrm{y})}\right)=$$\left(\sum_{i \in \text { Data_Set}_ \quad {N}^{l}} \sum_{i, j} \frac{\left|\operatorname{Image}(x, y)^{i}\right|}{|\operatorname{Image} \operatorname{Set}(x, y)|}+\max (\right.$ homogeneity $\left.(\mathrm{x}, \mathrm{y}))\right)$
where, Act_Fun denotes a non-linear activation function, which is typically the sigmoid function. In other healthy tissues, the suggested research attempted to segment DR by size. Class balancing cross-entropy loss is used in the suggested approach to deal with the class imbalanced problem more closely. DR prediction uses all network layer factors, such as nL, as well as the target function is computed as follows:
Target $_{\text {fun }(W)}=\min ($ Act $-F u n)+$$\sum_{\text {Image } \in \text { Image_set }} \quad \sum_{i \in \text { Image }}$ Act_Fun $(K F)_{j}^{l}+\lambda \sum_{i, j \in N} K F_{i, j}+\beta$
There is a loss in every pixel in the (x, y) space. $\lambda$ is the levels of DR identified in the image.
The Error Calculation Rate is calculated as
$\operatorname{Error}_{\text {Rate }}=\frac{1}{\operatorname{maxPixel}} \sum_{i=1}^{N} T$$+\left(\right.$ Histogram $(i)-\max \left(\right.$ multi_layer $\left.(\operatorname{Image}(x, y))^{N}\right)$
A serious complication of diabetes mellitus, diabetic Retinopathy (DR) produces lesions on the retina that impair vision. DR is caused by the accumulation of sugar in the blood. If it is not diagnosed and treated promptly, it might result in blindness. The unfortunate fact of the matter is that DR is not a reduction reaction, and treatment simply serves to maintain eyesight. Early recognition and diagnosis of diabetic retinopathy (DR) can greatly lower the risk of vision loss. In contrast to computer-aided diagnosis technologies, the manual diagnosis procedure of DR retina image data by ophthalmologists is time-consuming, labor-intensive, and expensive, and it is prone to misdiagnosis.
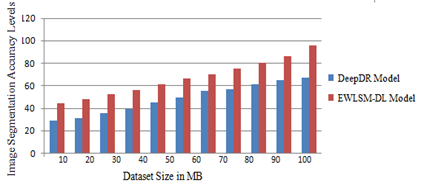
Automatic DR detection solutions based on image segmentation are tested in our research. The proposed model is implemented in python and executed in GOOGLE COLAB. The dataset is available in the link https://ieee-dataport.org/open-access/indian-diabetic-retinopathy-image-dataset-idrid. The training set is used only once during the validation phase for a ten-fold hold-out validation. As a result, images from the training data set are used for training and testing tasks accordingly, accounting for 80% and 20% of training sets. AUC is used as a measure of sensitivity and specificity since it allows us to see how well our models are performing. The proposed Edge Weighted Linked Segmentation Model using Deep Learning (EWLSM-DL) Model is compared with the traditional DeepDR Model. The proposed model is evaluated in terms of Image Segmentation Accuracy Levels, Object Edge Detection Accuracy Levels, Feature Extraction Time Levels, Edge Weight Allocation Accuracy Levels and Diabetic Retinopathy Detection Accuracy Levels.
When it comes to images, image segmentation is often used to detect objects and edges. Picture segmentation, to put it another way, is the process of giving a label to each and every pixel of the image in such a way that pixels with much the same label match certain properties with one another. The image segmentation accuracy levels of the proposed and traditional models are indicated in Figure 7.
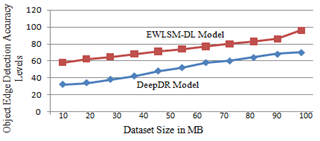
Edge detection is a type of image processing technology that is used to determine the borders of an object in a photograph. To conclude, the edges of an image are the parts of the picture that represent the boundaries or the position of the material represented in the image. The proposed model object edge detection accuracy is high when compared to the traditional methodology. The object edge detection accuracy levels of the proposed and traditional models are represented in Figure 8.
Figure 7. Image segmentation accuracy levels
Figure 8. Object edge detection accuracy levels
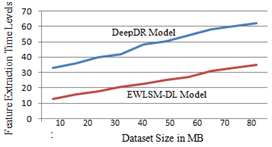
Feature extraction aids in the reduction of the quantity of redundant data in a data set by eliminating it. Final results show that reducing the amount of data allows the machine to construct the model with less effort, while simultaneously increasing the speed of the learning and generalisation processes in the machine learning model. The feature extraction time levels of the existing and proposed models are represented in Figure 9.
Figure 9. Feature extraction time levels
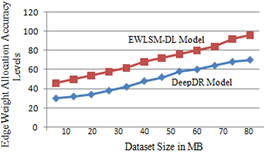
The weights are allocated to the edge pixels for accurate detection of DR. The edge weight allocation accuracy levels of the proposed model and the traditional models are shown in Figure 10.
Figure 10. Edge weight allocation accuracy levels
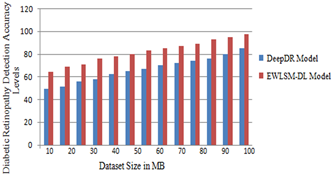
Difficulties with vision are caused by DR, a consequence of diabetes that control blood flow of the retina to enlarge and leak fluids and blood. If the disease progresses to an advanced stage, it may result in vision loss. Retinal screening aids in the early diagnosis of diabetic retinopathy and the prompt administration of appropriate medication. A deep learning system is proposed that can detect diabetic retinopathy in its early to late stages, in order to make the screening procedure more efficient. The DR detection accuracy levels of the proposed and traditional model are represented in Figure 11.
Figure 11. Diabetic retinopathy detection accuracy levels
For the detection of DR features in fundus images and the automated retinal image processing, Convolution Neural Networks have demonstrated a great potential and accurate results. When used for DR detection, the CNN technique saves both time and money. It is also more efficient than manual diagnosis, making CNN an essential and valuable tool for DR practitioners. The traditional way of detecting DR is time consuming, difficult, and expensive, hence numerous studies have been conducted to automated the detection process through the use of machine learning and artificial intelligence approaches. These findings show that there are many different ways to detect diabetic retinopathy, and a deep learning methodology for early retinopathy diagnosis is proposed. This research work implements an effective Edge Weighted Linked Segmentation Model using Deep Learning for accurate and quick detection of diabetic retinopathy using image enhancement and deep learning technologies to prevent the resulting retinal damage. Standardization and noise removal have been accomplished by extensive pre-processing and augmentation. The proposed model had the best accuracy out of all of them, and it also divides the images into a greater number of categories. In comparison to the logistic regression model, proposed approach had a 97% accuracy rate whereas the logistic regression model had a 78% rate. In future, the features selected can be reduced for improving the performance levels of the model.
[1] Calleja, J.D.L., Tecuapetla, L., Medina, A., Bárcenas, E., Urbina Nájera, A.B. (2014). LBP and machine learning for diabetic retinopathy detection. In International Conference on Intelligent Data Engineering and Automated Learning, Salamanca, Spain, pp. 110-117. https://doi.org/10.1007/978-3-319-10840-7_14
[2] Acharya, U.R., Lim, C.M., Ng, E.Y.K., Chee, C., Tamura, T. (2009). Computer-based detection of diabetes retinopathy stages using digital fundus images. Proceedings of the Institution of Mechanical Engineers, Part H: Journal of Engineering in Medicine, 223(5): 545-553. https://doi.org/10.1243%2F09544119JEIM486
[3] Anant, K.A., Ghorpade, T., Jethani, V. (2017). Diabetic retinopathy detection through image mining for type 2 diabetes. In 2017 International Conference on Computer Communication and Informatics (ICCCI), Coimbatore, India, pp. 1-5. https://doi.org/10.1109/ICCCI.2017.8117738
[4] Gandhi, M., Dhanasekaran, R. (2013). Diagnosis of diabetic retinopathy using morphological process and SVM classifier. In 2013 International Conference on Communication and Signal Processing, Melmaruvathur, India, pp. 873-877. https://doi.org/10.1109/iccsp.2013.6577181
[5] Orlando, J.I., Prokofyeva, E., Del Fresno, M., Blaschko, M.B. (2018). An ensemble deep learning based approach for red lesion detection in fundus images. Computer Methods and Programs in Biomedicine, 153: 115-127. https://doi.org/10.1016/j.cmpb.2017.10.017
[6] Preetha, S., Chandan, N., Darshan, N.K., Gowrav, P.B. (2020). Diabetes disease prediction using machine learning. International Journal of Recent Trends in Engineering & Research, 6(5): 37-43. https://doi.org/10.23883/IJRTER.2020.6029.65Q5H
[7] Sadda, S.R., Nittala, M.G., Taweebanjongsin, W., et al. (2020). Quantitative assessment of the severity of diabetic retinopathy. American Journal of Ophthalmology, 218: 342-352. https://doi.org/10.1016/j.ajo.2020.05.021
[8] Amin, J., Sharif, M., Yasmin, M. (2016). A review on recent developments for detection of diabetic retinopathy. Scientifica, 2016: 6838976. https://doi.org/10.1155/2016/6838976
[9] Kumaran, Y., Patil, C.M. (2018). A brief review of the detection of diabetic retinopathy in human eyes using pre-processing & segmentation techniques. International Journal of Recent Technology and Engineering, 7(4): 310-320.
[10] Chetoui, M., Akhloufi, M.A., Kardouchi, M. (2018). Diabetic retinopathy detection using machine learning and texture features. In 2018 IEEE Canadian Conference on Electrical & Computer Engineering (CCECE), Quebec, QC, Canada, pp. 1-4. https://doi.org/10.1109/CCECE.2018.8447809
[11] Sadek, I., Elawady, M., Shabayek, A.E.R. (2017). Automatic classification of bright retinal lesions via deep network features. arXiv preprint arXiv:1707.02022.
[12] Zago, G.T., Andreão, R.V., Dorizzi, B., Salles, E.O.T. (2020). Diabetic retinopathy detection using red lesion localization and convolutional neural networks. Computers in Biology and Medicine, 116: 103537. https://doi.org/10.1016/j.compbiomed.2019.103537
[13] Doshi, D., Shenoy, A., Sidhpura, D., Gharpure, P. (2016). Diabetic retinopathy detection using deep convolutional neural networks. In 2016 International Conference on Computing, Analytics and Security Trends (CAST), Pune, India, pp. 261-266. https://doi.org/10.1109/CAST.2016.7914977
[14] Kaur, P., Chatterjee, S., Singh, D. (2019). Neural network technique for diabetic retinopathy detection. International Journal of Advanced Manufacturing Technology, 8(6): 440-445. https://doi.org/10.35940/ijeat.E7835.088619
[15] Voets, M., Møllersen, K., Bongo, L.A. (2019). Reproduction study using public data of: Development and validation of a deep learning algorithm for detection of diabetic retinopathy in retinal fundus photographs. PloS One, 14(6): e0217541. https://doi.org/10.1371/journal.pone.0217541
[16] Chen, Y.W., Wu, T.Y., Wong, W.H., Lee, C.Y. (2018). Diabetic retinopathy detection based on deep convolutional neural networks. In 2018 IEEE International Conference on Acoustics, Speech and Signal Processing (ICASSP), Calgary, AB, Canada, pp. 1030-1034. https://doi.org/10.1109/ICASSP.2018.8461427
[17] Mateen, M., Wen, J., Nasrullah, N., Sun, S., Hayat, S. (2020). Exudate detection for diabetic retinopathy using pretrained convolutional neural networks. Complexity, 2020: 5801870. https://doi.org/10.1155/2020/5801870
[18] Pratt, H., Coenen, F., Broadbent, D.M., Harding, S.P., Zheng, Y. (2016). Convolutional neural networks for diabetic retinopathy. Procedia Computer Science, 90: 200-205. https://doi.org/10.1016/j.procs.2016.07.014
[19] Gargeya, R., Leng, T. (2017). Automated identification of diabetic retinopathy using deep learning. Ophthalmology, 124(7): 962-969. https://doi.org/10.1016/j.ophtha.2017.02.008
[20] Lam, C., Yi, D., Guo, M., Lindsey, T. (2018). Automated detection of diabetic retinopathy using deep learning. AMIA Summits on Translational Science Proceedings, 2018: 147-155.
[21] Abràmoff, M.D., Lou, Y., Erginay, A., Clarida, W., Amelon, R., Folk, J.C., Niemeijer, M. (2016). Improved automated detection of diabetic retinopathy on a publicly available dataset through integration of deep learning. Investigative Ophthalmology & Visual Science, 57(13): 5200-5206. https://doi.org/10.1167/iovs.16-19964
[22] Chen, W., Yang, B., Li, J., Wang, J. (2020). An approach to detecting diabetic retinopathy based on integrated shallow convolutional neural networks. IEEE Access, 8: 178552-178562. https://doi.org/10.1109/ACCESS.2020.3027794
[23] Saranya, P., Prabakaran, S. (2020). Automatic detection of non-proliferative diabetic retinopathy in retinal fundus images using convolution neural network. Journal of Ambient Intelligence and Humanized Computing. https://doi.org/10.1007/s12652-020-02518-6
[24] Xu, K., Feng, D., Mi, H. (2017). Deep convolutional neural network-based early automated detection of diabetic retinopathy using fundus image. Molecules, 22(12): 2054. https://doi.org/10.3390/molecules22122054
[25] Gulshan, V., Peng, L., Coram, M., et al. (2016). Development and validation of a deep learning algorithm for detection of diabetic retinopathy in retinal fundus photographs. Jama, 316(22): 2402-2410. https://doi.org/10.1001/jama.2016.17216
[26] Shaban, M., Ogur, Z., Mahmoud, A., Switala, A., Shalaby, A., Abu Khalifeh, H., Ghazal, M., Fraiwan, L., Giridharan, G., Sandhu, H., El-Baz, A.S. (2020). A convolutional neural network for the screening and staging of diabetic retinopathy. PLoS One, 15(6): e0233514. https://doi.org/10.1371/journal.pone.0233514
[27] Graham, B. (2015). Kaggle diabetic retinopathy detection competition report. University of Warwick.
[28] Rajalakshmi, R., Arulmalar, S., Usha, M., Prathiba, V., Kareemuddin, K.S., Anjana, R.M., Mohan, V. (2015). Validation of smartphone based retinal photography for diabetic retinopathy screening. PloS One, 10(9): e0138285. https://doi.org/10.1371/journal.pone.0138285
[29] Pires, R., Avila, S., Wainer, J., Valle, E., Abramoff, M.D., Rocha, A. (2019). A data-driven approach to referable diabetic retinopathy detection. Artificial Intelligence in Medicine, 96: 93-106. https://doi.org/10.1016/j.artmed.2019.03.009
[30] Hajabdollahi, M., Esfandiarpoor, R., Najarian, K., Karimi, N., Samavi, S., Soroushmehr, S.R. (2019). Hierarchical pruning for simplification of convolutional neural networks in diabetic retinopathy classification. In 2019 41st Annual International Conference of the IEEE Engineering in Medicine and Biology Society (EMBC), Berlin, Germany, pp. 970-973. https://doi.org/10.1109/EMBC.2019.8857769
[31] Muhammed, L.A.N., Toman, S.H. (2020). Diabetic retinopathy diagnosis based on convolutional neural network. arXiv preprint arXiv:2008.00148.
[32] Sun, Y. (2019). The neural network of one-dimensional convolution-an example of the diagnosis of diabetic retinopathy. IEEE Access, 7: 69657-69666. https://doi.org/10.1109/ACCESS.2019.2916922