Onur Erdem Korkmaz | Onder Aydemir* | Emin Argun Oral | Ibrahim Yucel Ozbek
© 2021 IIETA. This article is published by IIETA and is licensed under the CC BY 4.0 license (http://creativecommons.org/licenses/by/4.0/).
OPEN ACCESS
The COVID-19, which has rapidly spread and infected millions of people from all over the world, causes various problems including psychiatric, economic, educational as well as health. Many studies have been reported that COVID-19 can be characterized by vascular damage predominantly involving micro vessels. In this study, we proposed a method to examine whether COVID-19 effects on brain computer interface (BCI) performance or not. We collected P300 based electroencephalogram (EEG) signals from six subjects before and after the COVID-19 infection. For classifying the P300 and non-P300 EEG signals, single output and two-layer artificial neural network was utilized. Based on the t-test analysis, it was observed that there was a significant difference between the before and after COVID-19 infection test groups especially on Oz channel in occipital region for alpha=0.05 percent while that of for alpha=0.01 percent shows no statistical difference for P300 classification results. The latency values, on the other hand, before and after COVID-19 infection did not represent any difference for both significance levels. It is clearly understood from the literature that COVID-19 negatively effects to the microvascular bed. Therefore, it might be expected that it could cause to reduce the P300 based BCI performance. This was the first study to investigate the impact of COVID-19 on P300-based BCI performance, taking into account the EEG signals of the COVID-19 infection. The obtained results showed that although the COVID-19 infection did not generally effected P300 based BCI application performance and latency values, the performance of the occipital region electrodes slightly effected.
COVID-19, brain computer interface, event related potentials, P300, classification, EEG
COVID‐19, which was first detected in December 2019 in Wuhan, China, has rapidly spread and infected millions of people from all over the world. The World Health Organization declared it as a global health emergency and a pandemic on March 11, 2020 [1]. It was reported that the virus enters host cells by means of the envelope spike protein, which binds to angiotensin-converting enzyme 2 receptors [2]. These receptors are highly expressed in heart, lungs, respiratory tract epithelium, endothelial cells and brain. On the other hand, it is obvious that COVID-19 quarantine causes variety of social and economic problems. For example, it was found that there were high prevalence of mental health (MH) problems, which positively associated with frequently social media exposure [3]. Another study revealed that a high prevalence of MH problems and gaps in MH services for cancer patients, which also demonstrated high distress from COVID-19-elevated risks [4]. Moreover, many children did not have access to sustainable behavioral health services and schools from kindergarten through 12th grades were often closed [5]. The COVID-19 pandemic has led to the introduction of strong restrictive measures that have had a significant impact on the global economy, such as dramatically increasing unemployment in the worldwide [6].
While researchers have been tried to develop vaccines, they have started to examine the effects of the COVID -19 virus on humans and social lifestyles. For example, Delussi et al. investigated the effects of COVID-19 quarantine in migraine in terms of the possible changes in migraine frequency, severity, and days with acute medication intake during quarantine period [7]. Additionally, they evaluated possible differences in migraine outcomes in consideration of lifestyle changes, emotions, pandemic diffusion, and COVID-19 infection. In another social problem based study Satre et al. draw attention to unhealthy alcohol consumption during quarantine period [8].
Apart from the social problems, infection in humans might leads to severe clinical symptoms, which of them are short-term, some of them are long term effects. For instance, respiratory insufficiency, many hospitalized patients exhibit neurological manifestations ranging from headache and loss of smell, to confusion and disabling strokes [9]. It has not been exactly clear yet what and how will be the long-term effects of COVID-19. Ciceri et al. hypothesized that, in predisposed individuals, alveolar viral damage is followed by an inflammatory reaction and by microvascular pulmonary thrombosis [10]. They also reported that this progressive endothelial thromboinflammatory syndrome may also involve the microvascular bed of the brain and other vital organs, leading to multiple organ failure and death. In another COVID-19 based research was reported by Kommoss et al. [11]. Their autopsy findings suggested that focal damage of the microvascular pulmonary circulation is a main mechanism of lethal lung disease due to the COVID-19. It may also be a cause of persistent lung damage in patients who recover from severe COVID-19 [12-14].
It is obvious from the literature that COVID-19 negatively effects to the microvascular bed [15, 16]. Therefore, it might be expected that it can cause to reduce the P300 based brain computer interface (BCI) performance. In this study, we focused on three points in order investigating the effect of COVID-19 infection on P300 based BCI application performance; 1- investigating the performance changes of electrodes individually, 2- revealing the performance changes of different number of flash repetitions and 3- investigating the latency changes. Based on this point of view, in this study we investigated the effect of COVID-19 on P300 based BCI application performance and the results revealed that the performance of the occipital region electrodes decreased maximum 3.08% in average. It is worthwhile mentioning that, this is the first study, which explores the effect of COVID-19 on P300 based BCI performance by considering EEG signals recorded after and before passing through COVID-19.
In this study, experiments were carried out utilizing the visual P300 stimulus model, which was proposed by Magliero et al. [17]. Also an Artificial Neural Networks (ANN) model was used to detect the P300 signal. In the following subsections, first the experimental design is introduced. Then the experimental procedure is defined. And finally, P300 signal processing method is given in the last subsection.
2.1 Experimental design
EEG dataset was recorded from six participants, aged between 26 and 46. They did not used any neurological drug and had a neurological disorder until had not COVID-19 infection. Data collection process was approved by the Health Sciences Institute Ethics Board of Ataturk University, and all participants signed the Consent Form, verified the board, before the start of EEG recording session. All EEG data was obtained in two sessions from these subjects, before and after the diagnosis of COVID-19. All participants reported that they have no visual impairment. The exact dates of the before the COVID-19 infection EEG recordings along with the infection diagnosis dates are given in Table 1. EEG recordings were obtained in about 15-30 days following the COVID-19 infection.
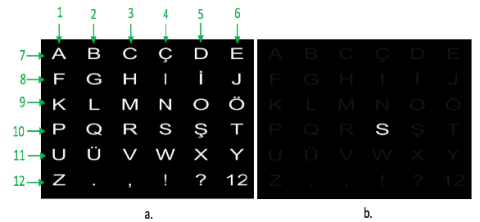
In the current study, the row-column based visual P300 spelling paradigm, first proposed by Donchin et al., is used. A 6x6 character matrix, shown in Figure 1a, is presented to the participants in order to collect target stimuli data. In each trial, the subject was asked to focus a character which was pre-determined. This character was verbally announced by the researcher while it was displayed on the monitor as shown in Figure 1b. A total of 85 letters were shown as target characters during each experiment. For that, a row or a column, out of 12 in the character matrix, is flashed randomly for each target character. In each set of flashings generated for a specific target character, all rows and columns are flashed once. Therefore, 12 flashings occur while the target character appears in 2 contrary to other 10 flashings as the character is included in a row and in a column.
Figure 1. Visual paradigm: (a) Character matrix (b) A sample target character to focus on
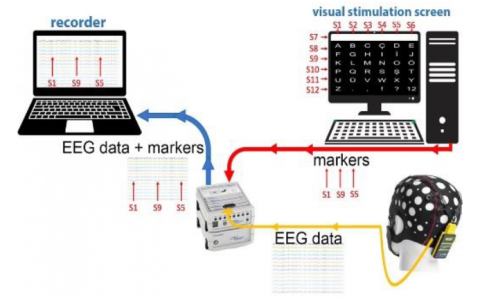
EEG recordings were collected with Brain Product ActiChamp device in all conducted experiments. Electrodes were placed according to the international 10/20 system and unipolar EEG recordings were performed. 'F2' channel is used as the reference electrode. Sampling frequency was determined as 250 Hz for all recording. The experimental system consists of two computers and the EEG device. EEG device combines data acquired from the electrodes with markers generated by the visual stimulation presentation computer and forward all information to the recording software running on the second computer. As a result, EEG data and visual stimulus type (markers) are recorded simultaneously. The whole data acquisition block-diagram is presented in Figure 2.
Figure 2. Data acquisition block diagram
Table 1. Experiment and diagnosis dates
|
Participant |
Sex |
Age |
EEG recording before COVID-19 diagnosis |
Diagnosed COVID-19 positive date |
|
Subject 1 |
M |
30 |
07.04.2020 |
02.11.2020 |
|
Subject 2 |
F |
26 |
17.04.2020 |
02.11.2020 |
|
Subject 3 |
M |
46 |
07.07.2020 |
07.10.2020 |
|
Subject 4 |
F |
27 |
07.06.2020 |
30.10.2020 |
|
Subject 5 |
F |
35 |
06.06.2020 |
10.12.2020 |
|
Subject 6 |
M |
29 |
25.06.2020 |
29.11.2020 |
2.2 Experimental procedure
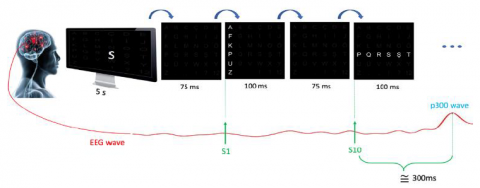
In the proposed study, the row-column based visual P300 spelling paradigm is used. The visual stimuli were shown on a 1920 x 1080 resolution LED display. Experiments were carried out while the participants were sitting on a comfortable armchair with their head about 100 cm away from the screen. The visual stimuli were shown on the screen for 100 ms with interstimulus interval (ISI) of 75 ms as demonstrated in Figure 3.
Each run for which a character is flashed twice was completed with randomly flashing 6 rows and 6 columns together with the ISI periods. During the experiments, each run for a specific character is repeated consequently for 15 times, called trial, and the experiment is performed for 85 letters. A three-minute break was given after 23 character display trials with a last session performed for 16 characters. Also, the following target character was shown on the screen during 5 seconds after each trial. This way, an additional rest time is provided for the participant while the target character location is introduced. That is, each run is completed in 2.1 seconds while a trial takes about 36.5 seconds yielding an experiment time of 61 minutes including the breaks. The timing details are demonstrated in Figure 3.
Figure 3. Experiment paradigm
2.3 P300 signal processing
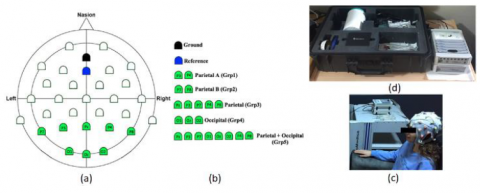
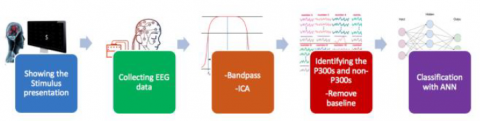
EEG signals were recorded on 10 channels for O1, Oz, O2, P3, P4, Pz, P7, P8, ground and reference electrodes, located according to 10-20 international location procedure. Electrodes used in the analysis are shown in Figure 4. The general flow chart of the P300 signal processing procedure is shown in Figure 5.
Figure 4. (a) Electrodes, (b) electrode groups, (c) equipment, (d) a participant
Figure 5. General flowchart
Independent component analysis (ICA), time/frequency analysis, artifact elimination and determination of event-related potentials were performed on each recorded EEG data.
At the very beginning a 0.1-10 Hz bandpass filtering is applied since P300 signals have low frequency components [18]. After that, ICA was performed to define independent EEG channels. With this approach, noise in the EEG channels can be determined and eliminated [19]. Artifacts, formed in the frontal region on EEG channels depending on eye movements or noise and occurred in the EEG channels due to various factors such as movement of the subject during the experiment, is suppressed by ICA analysis [20, 21]. This way, higher classification accuracy (CA) was achieved by removing eye and other artifacts utilizing ICA.
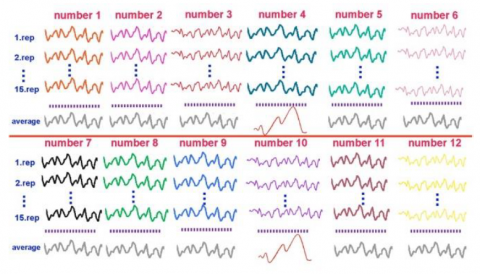
In the second step, EEG data was divided into two classes as data with and without target stimuli depending on the specific flashing during the data collection. Hence, the response of the brain to 2 flashings, which include the stimulus, out of 12 flashings is different from all others since these two results in P300 waves. However, the P300 wave is not observable in EEG signals of a single trial. Instead, it is obtained by averaging more than one EEG signals with target stimuli. This is shown in Figure 6. Here, one-second EEG signals for 12 flashings are shown for 15 repetitions as well as their averages obtained for target character “S”. As can be seen clearly, the P300 wave is observable only in two average EEG flashings, one for row with target character (number 4) and the other for column (number 10). During the data recording, 85 characters were shown to each participant as target. This results in, EEG data collection of 170 (2×85) with P300 wave and 850 (10×85) with non-P300 in each experiment per subject.
Figure 6. P300 waves obtained by averaging the EEG signals
This obtained data samples was randomly divided into 70% training, 15% validation, and 15% test partitions for each subject. It should be noted that the aforementioned P300 signal processing procedure is repeated twenty times in order to show the robustness of the method and avoid the problems of the random selections of the training, validation and test sets. The average CA was calculated for the Parietal and Occipital region EEG electrodes, used in this study, as they are related to visual activities [22, 23]. Since the inequality between the sample size of the two classes has a negative effect on the classification task success, synthetic data was generated to eliminate this imbalance between the classes. For this purpose, synthetic P300 data was created by adding Gaussian distributed noise, with 0 mean and 0.01 standard deviation, to the existing P300 samples as suggested by [22, 24, 25]. Thus, the imbalance between the classes was removed by increasing the samples of P300 data from 170 to 850, that of the non-P300 data samples. Then, baseline noise was removed from P300 and non-P300 EEG data sets by evaluating the 200ms EEG data before the arrival of the target stimulus, and using this information for the baseline removal of 1000ms EEG data after the arrival of the target stimulus as shown in Figure 7.
Figure 7. P300 data example before and after the baseline removal
Figure 8. Two-layer artificial neural network model
The resulting data set, cleared of baseline noise and equalized in both classes sample sizes are then used in a two-class classification problem, namely P300 and non-P300. Finally, a single-output two-layer ANN, including one hidden layer with 50 neurons [26, 27], was used for classifying the obtained EEG signals. The training of ANN is performed by updating the model weights in an iterative manner using the supplied training data, and it is verified using the validation data. At the end, the model is tested using test data. To evaluate the performance, an error term, the difference between the estimated value through the testing and the corresponding data label, is calculated. A sample neural network model with single output and two-layers is shown in Figure 8, and given by Eq. (1).
$\hat{y}=\tilde{g}\left(\sum_{j=1}^{M} w_{1 j}^{(2)} * g\left(\sum_{i=1}^{d} w_{j i}^{(1)} * x_{i}+w_{j 0}^{(1)}\right)+w_{10}^{(2)}\right.$ (1)
where, $\tilde{g}, g, w^{(1)}$ and $w^{(2)}$ represent the linear function, the tan-sigmoid function, hidden layer weights and output layer weights, respectively. The error function J(w), on the other hand, is represented by Eq. (2).
$J(w)=-\frac{1}{N} \sum_{n=1}^{N}\left[y_{n} \log \hat{y}_{n}+\left(1-y_{n}\right) \log \left(1-\hat{y}_{n}\right)\right]$ (2)
where, N is the number of samples in the test set, $y_{n}$ is the real value (label) and $\hat{y}_{n}$ is its estimated label produced by the model. This error term is subjected to a minimization process during the training for a satisfactory result.
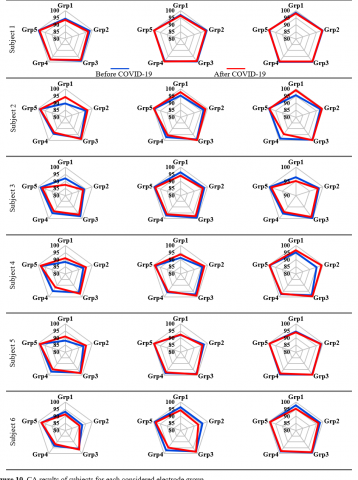
In this study, we investigated the effect of COVID-19 infection on P300 based BCI application performance. We used the row-column based spelling paradigm for collecting EEG signals from six subjects. The obtained CA results of subjects for each considered electrode and their groups are presented as radar plots in Figure 9 and Figure 10. To reveal the performance change with number of repetitions, all results in both figures are presented for 5, 10 and 15 flashings. The average CAs of these flashings are also included in these figures. The location of the electrodes and their groups are shown in Figure 4. It should also be noted that the data set partitioning as train, validation and test and the corresponding CAs are obtained for twenty times to show the robustness of the model. That is, the reported CAs reflect the average of obtained twenty experiments.
Based on the obtained results, CA rates increase with the increasing number of flashings as the noise included in the experiments caused by subjects, environment, etc., conversely decreases. Hence, when the CAs, calculated over all subjects, are compared for before and after COVID-19 data especially for 15 repetitions, there is a significant difference between the two cases for Oz channel, and that of after COVID-19 CA rate decreases. Namely, all subjects average of Oz channel CA rates before and after COVID-19 for 15 repetitions are 95.58% with a standard deviation of 2.54 and 93.51% with standard deviation of 3.23, respectively.
Based on the rough evaluation of Figure 9 and Figure 10, it is observed that the obtained CA is about 95-100% especially for group as well as occipital region electrodes with 15 flashings. When compared with similar results of literature, these results are consistent, and the current study is considered to perform well [28]. To further investigate, the before and after COVID-19 infection performances, namely red and blue radar plots in Figure 9 and 10, are compared by each other. It is observed that after the infection BCI performance is slightly lower than that of the before COVID-19 infection performance. In other words, red lines are encapsulated by blue lines in the radar plots except for specific subjects. For an overall evaluation, average CA is obtained over all subjects in terms of all EEG channels as well as electrode groups as shown in Figure 11. Comparison of red and blue radar plot in these figures suggest that there is a slight difference between the two. That is, the location of the red lines is also inside the blue lines. Especially considering 10, 15 flashings of Oz and O1 channels, this difference is more distinct. It is worth to mention that these two channels are located on the occipital region of the human brain that is responsible for visual activities.
Figure 9. CA results of subjects for each considered electrode
Figure 10. CA results of subjects for each considered electrode group
Figure 11. Average CA results of all subjects for each considered electrode and their groups
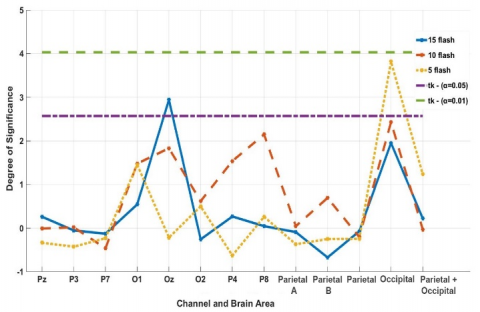
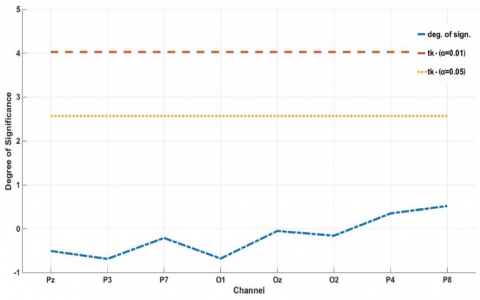
However, this visual inspection is far from being quantitative and needs to be supported by a detailed analysis. For that purpose, t-test statistics are performed to determine if there is a significant difference between before and after the infection classification performance. For that, two-sample t-test of the null hypothesis of the similarity between CA before and after the COVID-19 infection was performed with df=5 and p=0.03. The corresponding t-test Degree of Significance results in terms of separate and group EEG electrodes are shown in Figure 12. In this figure, threshold values for alpha=0.01 (tk-α=0.01 in color green) and alpha=0.05 (tk-α=0.05 in color purple) are both shown in this figure. While there is no difference between the CA results of two sets for alpha=0.01, that for alpha=0.05 reveals a significant difference for Oz channel with 15 flashings, based on this figure results. It is worth to mention that it is rejected the high significance result of Occipital channel for 5 flashings since it is very sensitive to noise as explained before.
Figure 12. Degree of significance results in terms of separate and group EEG electrodes for CA
In addition to target and non-target EEG signal classification, P300 signal latency, the time delay between the target character stimulus and the peak value of the P300 wave, were also analyzed. The latency values of subjects before and after the COVID-19 infection are shown in Figure 13 as bar graphs. In these figures, the electrode names are given in x-axis and the corresponding latency values, in milliseconds (ms), are given in y-axis. A rough comparison of the latency values indicates that there is an increase for Subject 3, Subject 4 and Subject 6 while a decrease is perceived for other subjects after the COVID-19 infection experiments. The maximum increase and decrease changes are observed for Subject 4 and Subject 1, respectively.
Figure 13. Latency values of all subjects
The latency before and after the COVID-19 infection was performed with df=5 and p=0.03. Corresponding t-test Degree of Significance results in terms of separate and group EEG electrodes are shown in Figure 14. In this figure, threshold values for alpha=0.01 (tk-α=0.01 in color orange) and alpha=0.05 (tk-α=0.05 in color yellow) are both shown in this figure. It is clear from this figure that there is no difference between the latency results of two sets for both alpha=0.01 and alpha=0.05.
Figure 14. Degree of significance results in terms of separate and group EEG electrodes for latency
In this study, it is investigated the effect of COVID-19 infection on the performance of P300 based BCI application as well as change in the P300 wave latency using the data of six subjects. For that, corresponding results, obtained before and 15-30 days after the COVID-19 infection, are compared with each other. It is worthwhile to mention that because the participants did not used any neurological drug and had not a neurological disorder until had COVID-19 infection, we believe that the brain activity were not distorted by any daily life changes.
It is observed that there is a visible difference in the BCI performance, mostly in the occipital region electrodes. Therefore, it is thought that this may cause vision problems in people. However, it is observed from the t-test results that there is a significant difference only on the performance of the Oz channel for alpha=0.05 while there is no difference for any EEG channel for alpha=0.01. On the other hand, latency comparison for before and after the COVID-19 infection is subject dependent as it increased for some subjects while decreasing for others regardless of their sex or age. The corresponding t-test also showed that there is no difference for latency. As a result, we concluded that the COVID-19 infection, in general, has no negative effect on the EEG data from a statistically point of view.
This work was derived from the project work of TUBITAK 215E155 and supported by the Inter Computer Electronics Ltd., Brain Products GmbH, and the Atatürk University Scientific Research Projects Coordination Unit with the project number: FOA-2018-6524.
[1] World_Health_Organization. Caronavirus disease (COVID-19). 2021; Available from: https://www.who.int/emergencies/diseases/novel-coronavirus-2019, accessed on 13 April 2020.
[2] Orrù, G., Conversano, C., Malloggi, E., Francesconi, F., Ciacchini, R., Gemignani, A. (2020). Neurological complications of COVID-19 and possible neuroinvasion pathways: a systematic review. International Journal of Environmental Research and Public Health, 17(18): 6688. https://doi.org/10.3390/ijerph17186688
[3] Gao, J., Zheng, P., Jia, Y., Chen, H., Mao, Y., Chen, S., Wang, Y., Fu, H., Dai, J. (2020). Mental health problems and social media exposure during COVID-19 outbreak. Plos One, 15(4): e0231924. https://doi.org/10.1371/journal.pone.0231924
[4] Wang, Y., Duan, Z., Ma, Z., Mao, Y., Li, X., Wilson, A., Qin, H., Ou, J., Peng, K., Zhou, F., Liu, Z., Chen, R. (2020). Epidemiology of mental health problems among patients with cancer during COVID-19 pandemic. Translational Psychiatry, 10(1): 1-10. https://doi.org/10.1038/s41398-020-00950-y
[5] Phelps, C., Sperry, L.L. (2020). Children and the COVID-19 pandemic. Psychological Trauma: Theory, Research, Practice, and Policy, 12(S1): S73-S75. https://psycnet.apa.org/doi/10.1037/tra0000861
[6] Kawohl, W., Nordt, C. (2020). COVID-19, unemployment, and suicide. The Lancet Psychiatry, 7(5): 389-390. https://doi.org/10.1016/S2215-0366(20)30141-3
[7] Delussi, M., Gentile, E., Coppola, G., et al. (2020). Investigating the effects of COVID-19 quarantine in migraine: an observational cross-sectional study from the Italian National Headache Registry (RICe). Frontiers in Neurology, 11: 1383. https://doi.org/10.3389/fneur.2020.597881
[8] Satre, D.D., Hirschtritt, M.E., Silverberg, M.J., Sterling, S.A. (2020). Addressing problems with alcohol and other substances among older adults during the COVID-19 pandemic. The American Journal of Geriatric Psychiatry, 28(7): 780-783. https://www.ajgponline.org/article/S1064-7481(20)30296-7/pdf.
[9] Iadecola, C., Anrather, J., Kamel, H. (2020). Effects of COVID-19 on the nervous system. Cell. https://doi.org/10.1016/j.cell.2020.08.028
[10] Ciceri, F., Beretta, L., Scandroglio, A.M., Colombo, S., Landoni, G., Ruggeri, A., Peccatori, J., D'Angelo, A., De Cobelli, F., Rovere-Querini, P., Tresoldi, M., Dagna, L., Zangrillo, A. (2020). Microvascular COVID-19 lung vessels obstructive thromboinflammatory syndrome (MicroCLOTS): An atypical acute respiratory distress syndrome working hypothesis. Critical Care and Resuscitation, 22(2): 95-97.
[11] Kommoss, F.K., Schwab, C., Tavernar, L., Schreck, J., Wagner, W.L., Merle, U., Jonigk, D., Schirmacher, P., Longerich, T. (2020). The pathology of severe COVID-19-related lung damage: Mechanistic and therapeutic implications. Deutsches Ärzteblatt International, 117(29-30): 500-506. https://dx.doi.org/10.3238%2Farztebl.2020.0500
[12] Dimbath, E., Maddipati, V., Stahl, J., Sewell, K., Domire, Z., George, S., Vahdati, A. (2021). Implications of microscale lung damage for COVID-19 pulmonary ventilation dynamics: A narrative review. Life Sciences, 119341. https://doi.org/10.1016/j.lfs.2021.119341
[13] Tonelli, R., Marchioni, A., Tabbì, L., Fantini, R., Busani, S., Castaniere, I., Andrisani, D., Gozzi, F., Bruzzi, G., Manicardi, L., Demurtas, J., Andreani, A., Cappiello, G.F., Samarelli, A.V., Clini, E. (2021). Spontaneous breathing and evolving phenotypes of lung damage in patients with COVID-19: Review of current evidence and forecast of a new scenario. Journal of Clinical Medicine, 10(5): 975. https://doi.org/10.3390/jcm10050975
[14] Janssen, R., Visser, M.P., Dofferhoff, A.S., Vermeer, C., Janssens, W., Walk, J. (2021). Vitamin K metabolism as the potential missing link between lung damage and thromboembolism in Coronavirus disease 2019. British Journal of Nutrition, 126(2): 191-198.
[15] Roberts, K.A., Colley, L., Agbaedeng, T.A., Ellison-Hughes, G.M., Ross, M.D. (2020). Vascular manifestations of COVID-19–thromboembolism and microvascular dysfunction. Frontiers in Cardiovascular Medicine, 7: 215. https://doi.org/10.3389/fcvm.2020.598400
[16] Sabioni, L., De Lorenzo, A., Lamas, C., Muccillo, F., Castro-Faria-Neto, H.C., Estato, V., Tibirica, E. (2021). Systemic microvascular endothelial dysfunction and disease severity in COVID-19 patients: Evaluation by laser Doppler perfusion monitoring and cytokine/chemokine analysis. Microvascular Research, 134: 104119. https://doi.org/10.1016/j.mvr.2020.104119
[17] Magliero, A., Bashore, T.R., Coles, M.G., Donchin, E. (1984). On the dependence of P300 latency on stimulus evaluation processes. Psychophysiology, 21(2): 171-186. https://doi.org/10.1111/j.1469-8986.1984.tb00201.x
[18] Rakotomamonjy, A., Guigue, V. (2008). BCI competition III: Dataset II-ensemble of SVMs for BCI P300 speller. IEEE Transactions on Biomedical Engineering, 55(3): 1147-1154. https://doi.org/10.1109/TBME.2008.915728
[19] Calhoun, V.D., Liu, J., Adalı, T. (2009). A review of group ICA for fMRI data and ICA for joint inference of imaging, genetic, and ERP data. Neuroimage, 45(1): S163-S172. https://doi.org/10.1016/j.neuroimage.2008.10.057
[20] Subasi, A., Gursoy, M.I. (2010). EEG signal classification using PCA, ICA, LDA and support vector machines. Expert Systems with Applications, 37(12): 8659-8666. https://doi.org/10.1016/j.eswa.2010.06.065
[21] Winkler, I., Haufe, S., Tangermann, M. (2011). Automatic classification of artifactual ICA-components for artifact removal in EEG signals. Behavioral and Brain Functions, 7(1): 1-15. https://doi.org/10.1186/1744-9081-7-30
[22] Thut, G., Nietzel, A., Brandt, S.A., Pascual-Leone, A. (2006). α-Band electroencephalographic activity over occipital cortex indexes visuospatial attention bias and predicts visual target detection. Journal of Neuroscience, 26(37): 9494-9502. https://doi.org/10.1523/JNEUROSCI.0875-06.2006
[23] Yildirim, S., Kocer, H.E., Ekmekci, A.H. (2021). Quantitative analysis of EEG slow wave activity based on minpeakprominence method. Traitement du Signal, 38(3): 757-773. https://doi.org/10.18280/ts.380323
[24] Prince, E., Nicholson, W.L. (1983). A test of a robust/resistant refinement procedure on synthetic data sets. Acta Crystallographica Section A: Foundations of Crystallography, 39(3): 407-410. https://doi.org/10.1107/S0108767383000859
[25] Wu, X., Liang, L., Shi, Y., Fomel, S. (2019). FaultSeg3D: Using synthetic data sets to train an end-to-end convolutional neural network for 3D seismic fault segmentation. Geophysics, 84(3): IM35-IM45. https://doi.org/10.1190/geo2018-0646.1
[26] Engel, A., Köhler, H.M., Tschepke, F., Vollmayr, H., Zippelius, A. (1992). Storage capacity and learning algorithms for two-layer neural networks. Physical Review A, 45(10): 7590. https://doi.org/10.1103/PhysRevA.45.7590
[27] Huang, G.B., Chen, Y.Q., Babri, H.A. (2000). Classification ability of single hidden layer feedforward neural networks. IEEE Transactions on Neural Networks, 11(3): 799-801. https://doi.org/10.1109/72.846750
[28] Gu, X., Cao, Z., Jolfaei, A., Xu, P., Wu, D., Jung, T.P., Lin, C.T. (2021). EEG-based brain-computer interfaces (BCIs): A survey of recent studies on signal sensing technologies and computational intelligence approaches and their applications. IEEE/ACM Transactions on Computational Biology and Bioinformatics, 18(5): 1645-1666. https://doi.org/10.1109/TCBB.2021.3052811