Santosh Kumar Upadhyay* | Avadhesh Kumar
© 2021 IIETA. This article is published by IIETA and is licensed under the CC BY 4.0 license (http://creativecommons.org/licenses/by/4.0/).
OPEN ACCESS
India is an agricultural country. Paddy is the main crop here on which the livelihood of millions of people depends. Brown spot disease caused by fungus is the most predominant infection that appears as oval and round lesions on the paddy leaves. If not addressed on time, it might result in serious crop loss. Pesticide use for plant disease treatment should be limited because it raises costs and pollutes the environment. Usage of pesticide and crop loss both can be minimized if we recognize the disease in a timely manner. Our aim is to develop a simple, fast, and effective deep learning structure for early-stage brown spot disease detection by utilizing infection severity estimation using image processing techniques. The suggested approach consists of two phases. In the first phase, the brown spot infected leaf image dataset is partitioned into two sets named as early-stage brown spot and developed stage brown spot. This partition is done on the basis of calculated infection severity. Infection severity is computed as a ratio of infected pixel count to total leaf pixel count. Total leaf pixel counts are determined by segmenting the leaf region from the background image using Otsu's thresholding technique. Infected pixel counts are determined by segmenting infected regions from leaf regions using Triangle thresholding segmentation. In the second phase, a fully connected CNN architecture is built for automatic feature extraction and classification. The CNN-based classification model is trained and validated using early-stage brown spot, developed stage brown spot, and healthy leaves images of rice plants. Early-stage brown spot and developed stage brown spot images used in training and validation are the same images that are obtained in phase 1. The experimental analysis shows that the proposed fully connected CNN-based early-stage brown spot disease recognition model is an effective approach. The classification accuracy of the suggested model is found to be 99.20%. The result of the suggested method is compared with those existing CNN-based disease recognition and classification methods that have used leaf images to recognize the diseases. It is observed that the performance of our method is significantly better than compared methods.
brown spot, disease recognition, rice, plants, CNN, infection severity
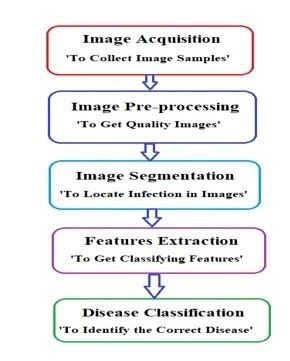
India's economy heavily depends on agriculture. Climatic and biological factors greatly influence the growth of crops. Crop disease is one of the main biological factors that reduce crop yields if not addressed on time. Plant disease detection and recognition play a very important role in precision agriculture [1]. A large part of India depends on paddy cultivation. Most of the people in India like to eat rice as food [2]. But due to rice disease, there is a reduction in the production of rice by about 10 to 15 percent every year in India [3]. Close monitoring and management are needed to prevent damage from crop disease. There is still a practice of detecting disease mostly by manual observation with the naked eye. It is very difficult to monitor large fields continuously by experts. Manual observation with the naked eye is sometimes not accurate and not effective. It has been observed that this kind of process is very costly, lengthy, and time-consuming. That’s why it helps a lot if the paddy crop disease is automatically detected well in time. The use of automated disease detection and recognition helps farmers a lot in taking care of crops [4]. In recent times, computer vision [5], pattern recognition [6], and image processing [7] have contributed a lot to agriculture. Image processing plays an important role in plant disease detection in a cost-effective way with consuming less time. In general, it has been observed that both digital image processing and machine learning together serve as the basic building block of any plant disease detection System. A general approach to plant disease detection using image processing and machine learning is shown in Figure 1.
Image acquisition is used to collect diseased and healthy leaves samples of plants. Diseased leaf samples are collected either from the agriculture field or taken from any well-known data set. The image pre-processing step is used to clean the acquired images in order to get quality images. Data cleaning is an important process since we know that the accuracy of disease recognition and classification model also depends a lot on the quality of the data set. Image segmentation is used to locate the infected regions in the leaf sample. There are many image processing techniques to extract relevant image features from the data set. But in the proposed method convolution neural network is used for automatic feature extraction. The final step of the disease detection system is the classification that is performed by machine learning technique.
In machine learning, particularly deep learning has made a lot of progress in the field of agriculture over the past decades. CNN has made great strides in the field of image classification due to its ability of automatic feature extraction. CNN has proved to be a milestone in the field of computer vision in the application of image detection, image recognition, and classification.
A remarkable characteristic of deep learning is the automatic extraction of features that can undoubtedly help to derive valuable information from a significant amount of image data. Deep learning also changes our knowledge of human interpretation while evolving the conventional methods of machine learning, as well as advancement has also been produced in the area of image classification and other applications [8].
Figure 1. General approach of plant disease detection system
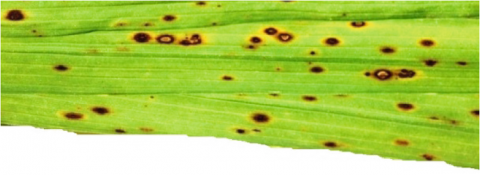
This article focuses on brown spot disease caused by fungus. Brown spot is such a dangerous disease that when severe it causes loss of up to 50% of the crop. The brown spot initially appears as a small brown dot and later takes on an oval to round shape or cylindrical shape. The chances of brown spot spreading and developing are high in nutrient-deficient soils. Brown spot mostly affects the leaves, stems, and grains of the plant. It is caused by the Helminthosporium oryzae organism which affects the plant from seedling in the nursery to the milky stage. A sample of brown spot diseased rice leaf is shown in Figure 2.
Figure 2. Brown spot diseased rice leaf [9]
In this paper, image segmentation is used to identify infected lesions in paddy leaves. The infected regions obtained from segmentation are used to compute the severity of infection. Using severity, the Brown spot diseased data set is divided into two parts, with the first part being a collection of images showing early signs of infection, and the second part is a collection of images in which the disease is fully developed. The first part of the data set is named the early-stage brown spot leaves and the second part is named as the developed stage brown spot leaves. Early-stage brown spot and developed stage brown spot images along with healthy leaves samples are used to develop a fully connected convolution neural network model. Finally, the proposed fully connected convolution neural network model is used to recognize early-stage brown spot disease by providing rice leaf image as input. Here proposed model works as a classifier to classify the leaf image in one of the three classes. These three classes are early-stage brown spot, developed stage brown spot, and healthy leaves.
In the rest of this paper Section 2 presents existing work, Section 3 describes the method and materials that include the layout of the proposed work, Section 4 presents experimental results and discussions, and finally, Section 5 includes our conclusions.
The manual method of identifying and analyzing illnesses in plant leaves is still used in rural areas. This approach of identifying plant diseases is very expensive, time-consuming, and subjective [10]. Many approaches for recognizing and classifying plant diseases have been successfully developed in recent years using pattern recognition, computer vision, image processing, and machine learning. Using significant visual properties such as texture, color, shape, and size of lesions, several computer researchers have already built different crop disease recognition and classification systems. The use of automatic disease recognition methods has been observed to be effective in overcoming problems associated with manual disease identification [11, 12].
The study on automatic disease recognition using machine learning and image processing is currently a growing research area. Its main reason is that in the manual system an expert naked eye observation is required to detect the disease, but many times availability of such experts is very difficult in rural areas. In case, if expert scientists are available, then continuous monitoring of large crop fields becomes impractical. A literature survey of some of the related works of past one decade is presented in this section. First, we discuss machine learning and image segmentation-based disease detection and classification approaches, later we present some review of infection severity estimation techniques.
Kurniawati et al. [13] have done texture analysis to identify rice crop disease. They have applied variants of Otsu’s thresholding method to get binary images from RGB images. These variants were global thresholding, adaptive thresholding, and variable thresholding. The noise was removed using a morphological operation and the region filling technique. Infected region percentage and spot type features were extracted from converted images. Rice leaf images were used to extract broken rice leaf color, lesion color, and lesion edges color. Finally, Production rules were created based on these features to detect rice plant disease. The suggested approach obtained an accuracy of 87.5%.
Yao et al. [14] utilized an SVM classifier to identify and classify rice crop disease. Image segmentation was used to get texture and shape features. These visual characteristics were fed into SVM to categorize three varieties of particular diseases. Result analysis illustrated that the proposed model could recognize and classify the diseases to an accuracy of 97.2%. Liu et al. [15] introduced a paddy seed disease detection methodology using Principal component analysis (PCA) and Support vector classification (SVC). To minimize the reflectance spectral dimension, PCA was used to get the principal component spectra (PCS) of the previous derivative and raw spectra. To distinguish between healthy, diseased, and empty panicles, SVC was used. Average accuracy of 97.2% was achieved. Pugoy and Mariano [16] have performed color image analysis to develop an automated system to detect infection in rice leaves. Firstly, the Outlier area was identified by applying histogram intersection between healthy and test leaf images. Then related regions of test leaf were grouped into clusters using threshold-based K-means algorithm. These clusters were finally analyzed to recognize the rice leaf diseases.
Gulhane and Gurjar [17] suggested a cotton disease detection system by applying color image segmentation on cotton leaf. Color segmentation was done by utilizing self-organizing feature map (SOFM)and back-propagation neural network (BPNN) techniques. Segmented groups of the color of lesions achieved by SOFM were fed to SVM to recognize and classify the disease. Al-Hiary et al. [18] initiated research on the recognition of leaves disease by applying K-means clustering segmentation and otsu’s global thresholding to get the infected region of the leaf image. Color Co-occurrence Method (CCM) was used to extract the features from the infected region of the leaf. Finally, these features were fed into the Neural network to recognize five varieties of diseases. The suggested method was efficient with an accuracy between 83% and 94%.
Valliammal and Geethalakshmi [19] developed an approach for plant leaf segmentation using the nonlinear K-means clustering technique. Segmentation was done in two steps. The first step utilized the K means algorithm to recognize the layout of plant leaf whereas in the second step undesired regions were removed to get the exact leaf shape using the Sobel edge detector. The validation result showed that the proposed approach performed better than existing segmentation techniques to get shape-related characteristics. Phadikar et al. [20] proposed a plant leaf disease classification system based on Bayes’ classification and support vector machine. Image acquisition was done by collecting 1000 images of the healthy and unhealthy leaf using Nikon COOLPIX P4 digital camera. Otsu’s segmentation technique was used to identify the infected region. The classification was performed in two steps. Healthy and unhealthy leaves were identified in the first step. Then two specific diseases leaf blast and brown spot were classified in the second step. Ten-fold cross-validation was done on the classifier to validate the result. An accuracy of 79.5% and 68.1% were achieved by Bayes’ and SVM classifiers respectively.
Pujari et al. [21] developed a fungal disease classifier to identify and classify fungal symptoms in cereals. The suggested classifier is based on Artificial Neural Network and Support Vector Machine. Region of interest (ROI) is extracted using k-means image segmentation. Color and texture statistics are computed from affected segments and these extracted color and texture features are given to the classifier. Orillo et al. [22] developed a BPNN based model to identify rice leaf disease. All experimental implementation was done in MATLAB. Dataset consisted of 134 infected leaf images in which two sets of 20 random images were separated for validation and testing other remaining images were used to train the model. Authors had applied image enhancement to get a quality image. Image segmentation was used to extract features from images. Finally, BPNN was fed with extracted features to recognize leaf disease. Result analysis observed 100% accuracy.
Rishi and Gill [23] presented an overview of image processing techniques to identify and classify plant diseases. They have discussed the importance of image compression in disease identification. The importance of Otsu's thresholding technique for segmentation, K-means algorithm to remove the noises and image cropping in the identification of plant diseases was studied and analyzed by the authors. Xiao et al. [24] introduced a rice blast disease (RBD) detector system by applying principal component analysis (PCA) to get the most appropriate features and backpropagation neural network (BPNN) for classification and recognition of disease. Disease detection was done in four stages. initially, the harvested image was processed to extract texture, morphological and color features of each infected region. In the next stage, a linear correlation was identified between extracted features using regression analysis. In the third stage, PCA technique was utilized to reduce the number of features from 21 to 6 only. finally, BPNN was used to identify and classify the RBD. An accuracy of 95.83% was achieved which was better than the accuracies of BPNN and SVM models which were not using PCA.
Saleem et al. [25] presented a comparative analysis of plant disease classification results of 19 CNN models trained on the Plant Village Dataset. The best model was selected for the further scope of performance enhancement. It was found that the application of different deep learning optimizers further enhanced the classification accuracy of the best model. Result analysis suggested that Xception with Adam optimizer worked as the best disease classification model among 19 CNN models. Kabir et al. [26] experimented with several well-known CNN models for the classification of multi-plant disease. They have observed that DensNet and Xception models outperformed the other models.
Kumbhar et al. [27] created a Convolution Neural Network-based cotton disease classifier. Cotton leaf images were used to train the classifier. Pre-processing was used to reduce the size of the acquired images to 128*128. Using three hidden layers, CNN was created to learn the relevant features automatically. The convolution layer was the first hidden layer, and it was used to capture features from input samples. The pooling layer was the second hidden layer, which was used to reduce the number of features. To flatten the network, a fully connected layer was used as the third and final hidden layer. A validation accuracy of 89% was achieved. Karlekar and Seal [28] introduced a SoyNet model to classify leaf diseases found in Soybean crops. Background of leaf image was removed using 4 phase segmentation technique. Segmented image without background was fed in CNN for disease classification. An accuracy of 98.14% was achieved by the proposed model.
Aiming to enhance the classification accuracy Chen et al. [29] used a transfer learning approach to identify the plant disease in rice crops. They have pre-processed the input image to get color Hue, Saturation, and brightness based segmented image. Segmented images were given to VGGNet and Inception based transfer learning module for disease classification. The proposed model achieved an average accuracy of 92%.
Guo et al. [30] proposed a plant disease recognition model based on a deep learning approach. Region proposal network (RPN) was used to identify the leaves regions in the input image. The output of RPN was given to Chan–Vese algorithm to perform disease segmentation. Finally, disease segmented images were fed into a transfer learning model to identify the disease. The performance of the proposed method was compared with the traditional transfer learning model ResNet-101 by providing the same input images. It was found that the suggested method outperformed the traditional ResNet-101. An accuracy of 83.57% was achieved by this method in result analysis. Jadhav et al. [31] developed a disease detection technique for the soybean crop using a transfer learning approach. To create disease identification models, they used GoogleNet and AlexNet CNN models. There were two models created. The GoogleNet technique was used in the first model, while the AlexNet technique was used in the second model. Both approaches were validated on 80 previously unseen leaf images. The accuracy of the GoogleNet-based model and the AlexNet-based model was 96.25% and 98.75%, respectively.
Sembiring et al. [32] utilized Convolution Neural Network basic model to build a simple and effective CNN architecture for recognizing infections in tomato leaves. The proposed model was trained using 9 diseased classes and 1 healthy class of tomato leaves. These 10 classes consisted of 17,641 images acquired from the PlantVillage data set. The performance of the proposed model was compared with other well-known architectures: SqueezeNet, ShuffleNet, and VGG Net. In result analysis, a classification accuracy of 97.2% was achieved that was slightly less than that of compared model’s accuracy. Nevertheless, the proposed model was quite fast than others. It was observed that the proposed concise architecture needed less than 25% of the time required by other competing models. Patidar et al. [33] utilised digital photos of infected and normal leaves to train a residual neural network to diagnose infections in rice plants. The accuracy of a 34-layer residual neural network was 95.83 percent.
To provide an efficient and effective rice plant disease recognition and classification system Upadhyay and Kumar [34] proposed a novel approach to detect image-based disease in paddy crops using CNN architecture. The authors have presented two experiments, one without segmentation and the other with segmentation. Image segmentation was used to remove background noise from leaf images. CNN architecture was designed in such a good manner that 99.1% and 99.7% classification accuracies were achieved in disease detection without segmentation and disease detection with segmentation respectively.
Further, we provide a brief discussion of some related disease severity estimation approaches. Disease severity estimation approaches are utilized to determine the intensity of diseases in plants.
With the objective to provide the intensity of infection, Patil and Bodhe [35] initiated research on measuring the severity of plant leaf disease using two-level threshold-based segmentation. Initially, the leaf region was identified using simple thresholding. In the next level, infected lesions were identified using triangle thresholding on converted HSI images. The severity of the disease was determined by computing the ratio of the infected area and leaf area. Result analysis showed an accuracy of 98.60%. Powbunthorn et al. [36] developed a method to calculate disease severity in cassava crops. Brown spot disease was focused on in this paper. In the proposed method, the authors first transform the RGB image into HIS image. After this conversion, the diseased pixels are retrieved by separating the Hue. Finally, the percentage of infection was calculated as the ratio of infected pixel count to total leaf pixel count. Islam, R. and Islam, M.R. [37] presented a method to quantify the severity of infection observed on rice leaves. K-Means segmentation was applied on the input leaf image to get healthy and unhealthy clusters of the leaf. A segmented image consisting of a healthy portion was converted into the binary image to calculate the count of pixels in the healthy portion. Similarly, a Segmented image consisting of an unhealthy portion was converted into the binary image to calculate the count of pixels in the diseased portion. Then total pixel count of the sample leaf was calculated as the sum of healthy and unhealthy pixel counts. Finally, the severity of infection was calculated as the ratio of unhealthy pixel count to total leaf pixel count.
Chen et al. [38] introduced a novel approach BLSNet for Rice bacterial leaf streak (BLS) disease recognition and disease severity estimation. BLSNet is actually a deep learning model that utilizes the concept of semantic segmentation. Multi-scale extraction and attention mechanism were integrated into the proposed model to enhance the accuracy of disease segmentation. Actual rice fields images were used by the authors to train the model. The performance of the BLSNet model was compared with semantic segmentation-based deep learning models: UNet and DeepLabv3+. The authors claimed that the proposed model performed better in terms of class and segmentation accuracy.
Aiming to provide a more effective and practical disease detection system Liang et al. [39] proposed a CNN-based PD2SE-Net for automatic plant disease recognition and severity computation. Image augmentation was used to create more instances of input images for the training of the network. The large dataset used for network training reduced the chance of overfitting. Visualization of CNN was exploited for better accuracy and best hyper-parameters tunning. The authors have used the ResNet50 model as the base of the proposed network. ShuffleNet-V2 was used as an auxiliary shuffle structure. The beauty of this model is its ability to perform three different tasks in a single unit. It was utilized in plant species identification, disease detection, and severity computation with the accuracy of 0.99, 0.98, and 0.91 respectively.
In the literature review, most of the authors have addressed disease recognition and severity computation separately in different articles. BLSNet [38] and PD2SE-Net [39] are the models that addressed these two issues in a single unit, but the structures of these two models are complex. Our aim is to develop a simple, fast, and effective deep learning structure for early stage-disease detection by utilizing infection severity computation using image processing techniques.
3.1 Dataset
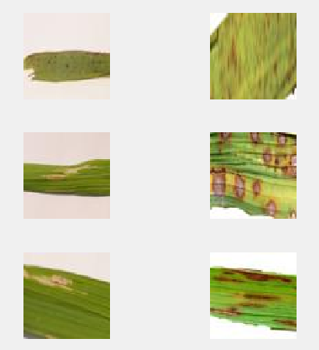
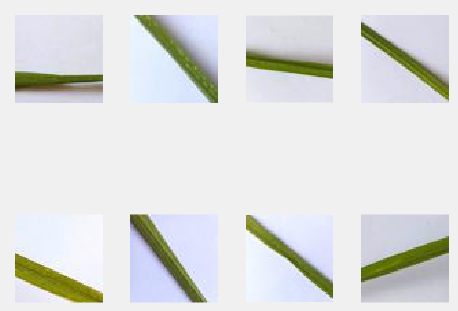
The Rice leaf dataset is acquired from Kaggle [40]. This dataset consists of four varieties of rice leaves. One variety consists of 4000 healthy leaves images, other 3 varieties consist of 12000 images of Brown Spot (BS), Leaf Smut (LS), and Bacterial Leaf Blight (BLB) diseased leaves. Each class of unhealthy images is a collection of 4000 diseased leaves. Table 1 describes every class of rice leaf dataset. Sample images of infected and healthy leaves are shown in Figure 3.
Table 1. Rice leaf dataset
|
Classes of Rice leaf dataset |
Number of image samples |
|
Healthy Leaves |
4000 |
|
Brown Spot (BS) |
4000 |
|
Leaf Smut (LS) |
4000 |
|
Bacterial Leaf Blight (BLB) |
4000 |
(a) Infected leaves
(b) healthy leaves
Figure 3. Sample images of Rice leaf dataset
3.2 Basic roadmap of model design
The following are the fundamental steps involved in the suggested model design:
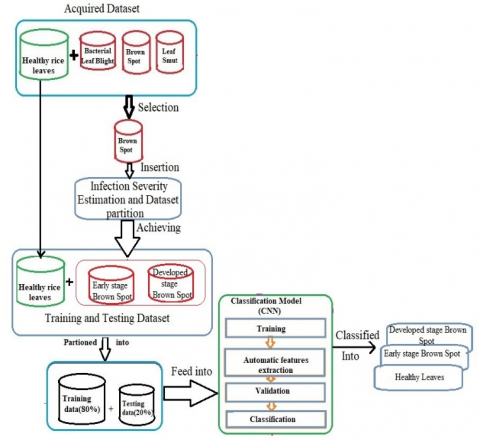
(1) Image Acquisition of brown spot diseased leaves: Brown spot leaves class is selected from the rice leaf dataset [40] as an input dataset for the early-stage brown spot disease detection model.
(2) Infection Severity estimation and dataset Partition: This process requires the following fundamental sub-steps:
(a) Segmentation of leaf region from the acquired image
(b) Segmentation of diseased regions from the segmented leaf region
(c) Computation of infection severity
(d) Severity based partition of acquired brown spot diseased dataset into early-stage brown spot and developed stage brown spot
(3) Automatic Features extraction: A CNN [41] based simple and efficient architecture consisting of multiple sequential combinations of Convolution and pooling layers has been built and applied on a new partitioned dataset along with healthy leaves to learn the discriminating image features automatically.
(4) Early-stage disease recognition: The last layer of proposed CNN architecture is a fully connected layer followed by a softmax layer. The last layer is used to recognize input image whether it is the early-stage brown spot or not.
The steps outlined above are covered in further depth in the next sections. The proposed approach for recognizing and classifying early-stage brown spot disease in paddy plants is depicted in a flow diagram shown in Figure 4.
Figure 4. Proposed system
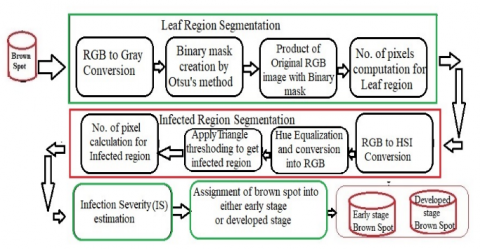
3.3 Infection severity (IS) estimation and dataset partition
In this section, all leaf images of the dataset are segmented 2 times in sequential manner. First segmentation is done using Otsu’s global thresholding method to get the leaf region in the image. The second segmentation process takes the segmented leaf region as input and performs triangle thresholding to get the area of interest (infected regions). The number of pixels in the whole leaf region and infected regions is computed respectively. The severity of infection (IS) is calculated using Eq. (1):
$I S=N i / N L$ (1)
where, Ni is number of pixels in infected region and NL is number of pixels in whole Leaf region.
Based on estimated infection severity, brown spot diseased image is either kept in early-stage brown spot subset or developed stage brown spot subset. These two subsets along with healthy leaves work as a new derived dataset for the early-stage disease detection model. The precise detail of Infection Severity estimation and dataset Partition method is discussed in algorithm 1 that is organized in sub-section 3.3.4. The flow graph of this method is shown in Figure 5.
Figure 5. Infection Severity estimation and dataset partition
3.3.1 Brown spot image acquisition
Brown spot leaves are chosen from the rice leaf dataset [40] for the study in the present article. Out of 4000 images of brown spot only 3008 good quality images are acquired by removing duplicate and dull images. We have utilized acquired brown spot images to create 2 new datasets named as early-stage brown spot and developed stage brown spot. These newly generated datasets in addition to 4000 healthy leaves obtained from the rice leaf dataset are utilized to conduct the experiment of the proposed early-stage brown spot disease detection model.
3.3.2 Leaf region segmentation
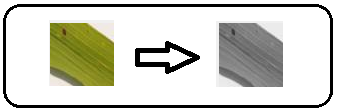
Image processing is utilized to resize the images in the dimension of 64*64. Each RGB image is converted into a Grayscale image by applying the image conversion technique. A sample RGB to Grayscale converted image is depicted in Figure 6. Binary mask creation is done by applying Otsu’s global thresholding method [42]. Firstly, the Grayscale image is converted into an image histogram. Then Otsu’s thresholding technique computes all possible threshold values by computing and evaluating the within-class variance based on the histogram. The optimal threshold is determined concerning the minimal within-class variance. Pixels with intensities less than the optimal threshold are turned off while intensities of the remaining pixels are set as 1. Here pixels with intensities 0 are part of the background and pixels with intensities 1 are part of rice leaf (foreground). This type of achieved image with pixels having intensities of either 1 or 0 is known as a binary mask. Flood-fill operation is utilized to remove noisy artifacts from the binary image. The binary mask of a sample grayscale image is shown in Figure 7. Now the original RGB image is multiplied with Otsu’s binary mask to achieve a segmented leaf region of brown spot image. The segmented leaf region is depicted in Figure 8.
Figure 6. A sample of RGB to grayscale converted image
Figure 7. Binary image achieved by Otsu’s method
Figure 8. Segmented leaf image of a sample brown spot image
3.3.3 Infected region segmentation
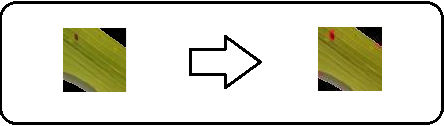
To get correct location of infected region in leaf, some appropriate image pre-processing steps are required. For good results of experimentation, it is necessary to have accurate segmentation of infected region. In the early days of the disease, segmentation results may not be good because of the fade color of the lesion. Also due to the effect of several environmental factors such as water and light, lesions show different symptoms at various stages of the disease. This situation creates problems for the segmentation. To avoid these difficulties, RGB image obtained in leaf image segmentation is firstly converted into HSI image that is more intuitive visual system for human. Hue component is found to be capable to decrease the complexity of color variations. Therefore, this component is used to eliminate glare, reflection, shades, and other light-related issues in color image segmentation. To address these issues, we have designed a module that utilized some image pre-processing steps in sequence. This module takes RGB image (Segmented Leaf Image) as input, convert it in HSI format, select Hue component, apply histogram equalization on Hue, finally convert Hue equalized image in RGB format. Histogram equalization is applied on Hue component to enhance the contrast of the Hue image. Conversion of Segmented Leaf Image into Hue Equalized RGB image by designed module is shown in Figure 9. RGB equivalent of Hue Equalized image act as input for triangle thresholding technique [43].
Figure 9. Conversion of segmented leaf image into hue equalized RGB image
Figure 10. Binary image achieved by triangle thresholding [43]
Figure 11. Flow chart of triangle thresholding process
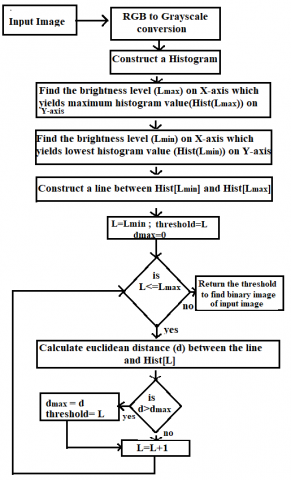
Hue Equalized RGB image is first converted in a grayscale image, then Triangle thresholding is applied on the grayscale image. In Triangle thresholding, a line is drawn between the histogram's highest and lowest values. For each value of brightness level L from L=Lmin to L=Lmax, the separation between the line and the histogram hist [L] is determined. Here Lmin represents the brightness level on X-axis corresponding to histogram's lowest value (lowest value that is significantly more than 0) and Lmax represents the brightness level on X-axis corresponding to the histogram's highest value. Separation is computed as Euclidean distance between the line and hist [L]. The brightness Level L that corresponds to the maximum separation between hist [L] and the line is chosen as the threshold value. This method is especially useful when the object pixels yield a weak peak.
The binary image achieved by triangle thresholding is shown in Figure 10. This image is consisting of the infected region in black color along with a black background. Triangle thresholding process is shown in Figure 11.
3.3.4 Severity calculation and dataset partition
Severity calculation is done using the formula IS=Ni/NL mentioned in Eq. (1) under sub-section 3.3.1. The number of pixels in the whole leaf region (NL) is determined by computing the number of white pixels in the binary mask created by Otsu’s method (Figure 7). The binary image mentioned in Figure 10. is used to find the number of pixels in the infected region (Ni) using Eq. (2):
$(N i)=N_{b t}-N_{b o}$ (2)
where, Nbt is Number of black pixels determined in binary image obtained by triangle thresholding (Figure 10) and Nbo is Number of black pixels determined in binary mask obtained by Otsu’s method (Figure 7).
After estimation of infection severity for input brown spot leaf image, this input image is assigned in one of the two classes named as Early-stage brown spot and Developed stage brown spot. Here we have decided the severity threshold as 0.01(1%) to categorize the brown spot disease in one of the two mentioned classes (Early-stage brown spot and Developed stage brown spot). This categorization is done by the following rule:
For the input brown spot leaf image
if (IS<= 0.01)
then Assign input image in Early-stage brown spot class.
Otherwise, Assign input image in the Developed stage brown spot class
For early-stage brown spot detection, we try to keep the severity threshold as minimum as possible. We have done several experiments for other possible thresholds less than 1%, in these cases, we observed that near about all images of the input dataset is categorized as developed stage brown spot. Therefore, we have chosen the severity threshold as 1%.
Algorithm 1: Infection Severity (IS) estimation and dataset Partition
INPUT: Brown spot diseased dataset
OUTPUT: Early-stage brown spot class and Developed stage brown spot
Start ()
1. Perform first segmentation to get leaf region from the acquired image
1.1 Resize the image
1.2 Create Gray-scale image for acquired RGB image
1.3 Create a binary mask using Otsu’s global thresholding method
1.4 Multiply original RGB image with the binary mask to get leaf region
1.5 Compute number of pixels for whole leaf region
2. Perform second segmentation on segmented leaf region achieved in step 1 to get infected regions.
2.1 Create HSI image for segmented leaf region
2.2 Apply Hue equalization and convert Hue equalized image into RGB
2.2 Apply Triangle thresholding on Hue equalized RGB image to get segmentation of infected regions
2.4 Compute number of pixels for infected regions
3. Estimate the infection severity
3.1 Calculate infection severity using:
$IS
$=($ Number of pixels in infected region $(\mathrm{Ni}))$
/(Number of pixels in whole leaf regions(NL))$
4. Create a new dataset
4.1 If (IS <= .01)
then assign input brown spot image to a new Early-stage brown spot class
otherwise, assign input brown spot image to a new Developed stage brown spot class
5. Repeat the steps from 1 to 4 for each and every image of acquired brown spot diseased dataset
3.4 Automatic features extraction and disease recognition
In several computer vision and image processing applications, CNN has been recognized as a vital system for performing classification and image recognition tasks. In this article, a fully connected Convolution Neural Network (CNN) architecture is proposed to automatically extract the relevant features from input images. The objective of using the CNN model is to take advantage of CNN's incredible learning abilities in the area of object recognition and classification. Healthy rice leaves, Early-stage brown spot, and Developed stage brown spot classes are used to train the model. The basic building block of fully connected CNN consists of one input layer, multiple combinations of convolution (CL) and pooling layer (PL) connected in a pipelined fashion, and fully connected layers (FC layer) placed at end of the network. Multiple combinations of convolution and pooling layers act as hidden layers in the network.
The convolution layer (CL) is an important part of the network responsible for features learning. Each input sample passes through a pipeline consisting of the input layer, sequence of convolution layers along with ReLU and pooling, and FC layers. Each CL performs convolution operation on input matrix (input image) to compute features map by using stride, and two-dimensional filter or kernel. Stride is the number of pixels required to slide the kernel over the input matrix at a time when computing the feature map. The kernel is applied to the input in a systematic left-to-right and top-to-bottom manner, resulting in a two-dimensional feature map. One feature map is created for each kernel.
Convolution operation creates a feature map of size (R-Kr+1)×(C-Kc+1)×1 if the size of the image matrix is R×C×d and the size of kernel matrix is Kr×Kc×d. The output of the convolution layer is computed by Eq. (3) [44].
$O_{n}^{l}=\left(\sum_{m \in X_{n}} O_{m}^{l-1} * K_{m n}^{l}+B_{n}^{l}\right)$ (3)
where, $o_{n}^{l}$ is the output of present lth layer, $O_{m}^{l-1}$ is the output of previous layer, $K_{m n}^{l}$ is the convolution filter of present layer, $B_{n}^{l}$ is bias of present layer, and Xn shows input maps. A ReLU layer (RL) is used between convolution and pooling layers. RL imposes nonlinearity in the output of CL. It changes the negative value of convolved matrix to zero and keep the other value as the same. This layer uses ReLU non-linear activation function that is mathematically computed by Eq. (4):
ReLU(v)=maximum (0, v) (4)
where, v is input value.
The pooling layer is used to consolidate the features that exist in the feature map coming from the ReLU layer. The pooling layer is responsible for reducing the size of the features map, and hence reducing the number of relevant features required to classify the diseases.
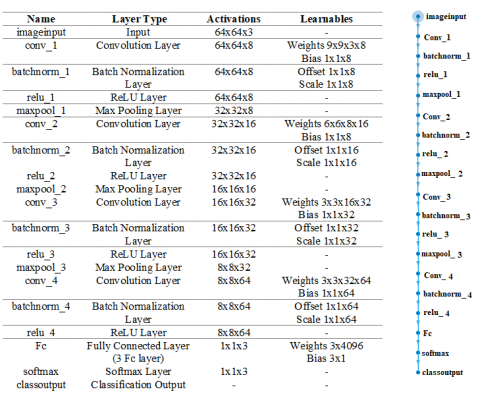
Figure 12. Structure of the deep convolution neural network
We have used 4 convolution layers in CNN architecture. The architecture of the deep network consists of CL, batch normalization layer (BNL), RL, and max-pooling layer (MPL) in sequence as hidden layers. The first CL takes each resized image of dimension 64×64×3 and applies 8 filters of 9×9 size with a stride of 1 pixel. Then BNL is utilized to normalize the input channel across a given mini-batch size. Batch normalization helps to speed up the training process and provides regularization to avoid overfitting problems in the network. The Output of BNL is given to RL. RL performs non-linear activation by computing the simple mathematics specified in Eq. (4). The Output of RL is given to MPL of pool size 2×2. MPL chooses the maximum value from an area of 2×2 of the input feature map. After completion of the max-pooling operation, it returns 8 feature maps each of size 32×32.
The second CL takes 32×32 sized feature maps coming from the first MPL and performs the filtering operation with sixteen 6 × 6 sized filters with stride as 1. This is followed by second BNL, then second RL, and lastly second MPL to reduce the dimension of feature maps from 32×32 to 16×16. Second MPL generates 16 feature maps each of size 16×16.
The third CL takes 16×16 sized input feature maps and applies 32 filters of size 3×3 with stride 1. Then it is followed by a combination of BNL, RL, and MPL to generate 32 feature maps of size 8×8.
Similarly, the fourth and last CL takes 8×8 sized input feature maps and applies 64 filters of size 3×3 with stride 1 to perform the filtering operation. Final CL with the combination of BNL and RL generates 64 feature maps of size 8×8. Then 3 FC layers followed by softmax layer work as a classifier to classify input image in one of the 3 classes (Healthy, Early- brown spot, and developed brown spot). Softmax activation provides probabilities for each labelled class. Cross-entropy loss is utilized as a cost function during the model's learning to adjust the weights of the network. Cross-Entropy is used to calculate the separation of predicted labels from actual labels by using SoftMax’s computed probabilities. Probability computation for jth class by SoftMax is given in Eq. (5):
$P\left(v_{j}\right)=\frac{e^{v_{j}}}{\sum_{k}^{N} e^{v_{k}}}$ (5)
where, vj is the input vector for jth class and N is the number of classes in the training dataset.
Cross entropy loss (CE) is computed using the formula given in Eq. (6):
$C E=-\sum_{i=1}^{N} t_{i} \log \left(P_{i}\right)$ (6)
where, ti is the truth label and Pi is the probability of ith class computed by the SoftMax activation.
The structure of suggested deep convolution neural network is shown in Figure 12.
The experimental setup and performance evaluation of the suggested model is depicted in Section 4. This section presents the dataset used for training and validation, hardware and software details required for the experiment, and result from analysis.
4.1 Experimental setup
We are using Healthy leaves, Early-stage brown spot, and Developed stage brown spot classes as input data set to perform the experiment. These three classes are derived from the rice leaf disease dataset taken from Kaggle [40] using the dataset partition process discussed in sub-section 3.3.4. This new data set generation process is also illustrated in Figure 5. The derived new dataset consists of 4000 images of Healthy rice leaves, 3008 images of Early-stage brown spot diseased rice leaves, and 986 images of Developed stage brown spot diseased rice leaves. The description of the derived dataset is shown in Table 2. 80% of images of each class are used for the training process and the remaining 20% images are utilized for the validation process. The number of instances used for training and validation is outlined in Table 3. The experiments and result analysis are performed using Core i5 processor@ 1.80 GHz on a DELL laptop. This laptop has Windows 10 operating system with 4GB DDRAM, 250 GB SSD. MATLAB 2019a is used as a programming tool to implement the experiment.
Table 2. Description of derived dataset used as input dataset
|
Leaves class |
Total images |
|
Healthy |
4000 |
|
Early-stage Brown spot |
3008 |
|
Developed stage Brown spot |
986 |
Table 3. Data partition of derived dataset into training and validation sets
|
Leaves class |
Training samples |
Validation samples |
|
Healthy |
3200 |
800 |
|
Early-stage Brown spot |
2406 |
602 |
|
Developed stage Brown spot |
789 |
197 |
4.2 Performance metrices used to evaluate the model
Evaluation of classification and the predictive model is done using several evaluation factors [45, 46]. We are using such 4 performance matrices to assess the performance of our proposed method. A short description of these two metrics is given here.
(1) Accuracy(A): The ratio of the number of samples correctly classified to the total number of samples used in classification is known as the accuracy of the classification model.
$A=\frac{T P+T N}{T P+F P+T N+F N}$ (7)
(2) Recall(R): It is defined as the proportion of number of True Positive found in a class.
$R=T P /(T P+F N)$ (8)
(3) Precision (P): It is defined as fraction of truly positive of a specific class out of total positive prediction of that class.
$\mathrm{P}=\mathrm{TP} /(\mathrm{TP}+\mathrm{FP})$ (9)
(4) Overall Accuracy: It is average of true positives of all classes.
where, TP or True Positive=right instances that are correctly classified as right (Expected), FP or False Positive=wrong instances that are misclassified as right (Unexpected), TN or True Negative=wrong instances that are correctly classified as wrong (Expected), FN or False Negative=right instances that are misclassified as wrong (Unexpected).
4.3 Experimental observation of system model
The first experiment is deployed by taking brown spot images (Table 1) to perform an image processing task to estimate the infection severity of brown spot disease. In continuation, this experiment uses estimated infection severity to perform dataset partition to get the early stage and developed stage brown spot from input brown spot leaves. This early-stage and developed stage brown spot along with original healthy leaves are known as the derived dataset.
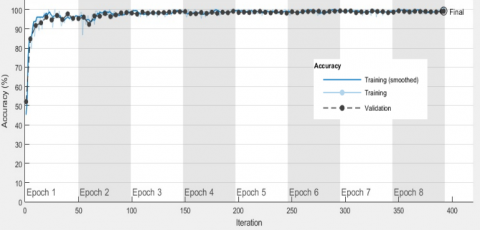
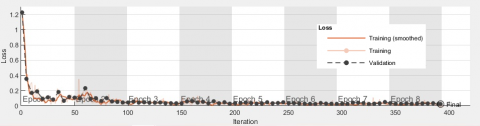
The second Experiment is done to build the classification model. This experiment is implemented by providing a derived dataset to the CNN architecture for early-stage brown spot detection. In the second experiment, we observed the classification performance of the system model. Training and validation samples outlined within Table 4 are used to train and validate the classification model. We implemented 8 epochs at the rate of 49 iterations per epoch. Total 392 iterations were implemented to analyze the result of the experiment. Validation frequency is tuned at 5 iterations during validation of the model. Training-Validation observation is shown in Figure 13(a). Figure 13(a) depicts the training and validation processes of the proposed method by illustrating accuracy variation with the number of epochs. The loss graph showing loss variation with the number of epochs is depicted in Figure 13(b). The performance of classification is illustrated by the confusion matrix. The confusion matrix represents class-wise right and wrong classifications performed by the proposed model. The confusion matrix obtained in the experiment is shown in Figure 14. Recall of corresponding classes are shown in the bottom row and precision of corresponding class is shown in the rightmost column of the confusion matrix. The overall accuracy of the model is shown in the bottom-rightmost cell.
(a) Observation of accuracy in training and validation progress
(b) Observation of loss rate in training and validation progress
Figure 13. Performance of the proposed model
Figure 14. Result analysis of proposed model using Confusion matrix
It is observed that the derived dataset enhances the learning of the model in such a well manner that precision of healthy class is obtained 100% and the precisions of Early-stage brown spot and Developed stage brown spot are obtained near about same as 98.5%. Recall of the healthy class is observed as 100%, while recalls of early-stage brown spot and developed stage brown spot are observed as 99.5% and 95.4% respectively. Only 3 instances of early-stage brown spot out of 608 are misclassified as developed stage brown spot, and 9 instances of developed stage brown spot out of 201 are falsely classified as early-stage brown spot. These misclassifications are the noted errors of the model. It is noted that as a classification model, our model is fast and accurate. The training process of the model takes only 20 minutes 17 seconds. Result analysis demonstrates that an overall accuracy of 99.20% is achieved by the proposed method.
4.4 Comparison with the existing works
We have performed a comparative analysis of the accuracy of our suggested model with the other existing disease classification model that had used color, shape, and size features of the lesion from the leaf images to classify the diseases. All the existing models compared here used deep CNN architecture for automatic features extraction and disease classification. Most of the compared methods utilized image segmentation to locate the lesions in the plant leaves. Most of the approaches have addressed disease recognition and severity computation separately in different articles. But our approach combines both disease recognition and severity estimation in one unit. The suggested model is able to alarm the farmers about brown spot infection at the very initial stage.
As shown in Table 4, the approach introduces in this article performs better than other compared methods. Only model [34] outperforms the proposed method with very less margin (0.5% accuracy), but it is not able to classify the early stage and developed stage of the disease as the proposed model does.
Table 4. Accuracy comparison of suggested model with related methods
|
S.No. |
Authors |
Methods |
Plant |
Accuracy |
|
1 |
Chen et al. [29] |
Image segmentation and VGGNet and Inception based transfer learning approach |
Rice |
92% |
|
2 |
Patidar et al. [33] |
Residual neural network |
Rice |
95.83 |
|
3 |
Upadhyay and Kumar [34] |
Fully connected CNN architecture |
Rice |
99.1% |
|
4 |
Upadhyay and Kumar [34] |
Fully connected CNN architecture with Otsu’s method |
Rice |
99.7% |
|
5 |
2021 |
Proposed Early-stage disease recognition using 2 phase segmentation and CNN architecture |
Rice |
99.2% |
The proposed method can easily handle large data sets and is able to extract the features automatically. The beauty of the proposed system is its ability to recognize the disease at an early stage. Early-stage brown spot detection helps the farmer to take preventive measures well in advance in time. The use of pesticides can be reduced by identifying the disease at an early stage. Limited use of pesticide not only save money but also reduce pollutants.
This study is done to develop a fast and effective method to recognize early-stage brown spot disease in paddy using image processing and deep learning techniques. The proposed method can easily handle large data sets and is able to extract the features automatically. The beauty of the proposed system is its ability to recognize the disease at an early stage. Early-stage brown spot detection helps the farmer to take preventive measures well in advance in time. The use of pesticides can be reduced by identifying the disease at an early stage. Limited use of pesticides not only saves money but also reduces pollutants. In this system, Otsu’s thresholding technique is applied to brown spot diseased image data set to segment the leaf region. Then Triangle thresholding segmentation is used on the leaf region to segment the infected regions. After segmentation, pixel counts of the total leaf region and infected regions are calculated. Infection severity is computed as the ratio of infected pixel count to total leaf pixel count. The Brown spot diseased data set is divided into two parts named as early-stage brown spot and developed stage brown spot based on infection severity. These two parts along with healthy leaves are utilized as a derived new dataset. Finally, fully connected CNN architecture is developed and applied to this derived dataset to recognize the early-stage brown spot. Result analysis demonstrates that the proposed method behaves well with an accuracy of 99.20%.
For future work, the proposed system can be extended to recognize several other types of diseases found in paddy at an early stage. The present work may be applied to the leaf dataset collected directly from the fields of different types of plants. The developed CNN architecture may be utilized to classify diseases by using different information like fruit, grain, stem, and seedling images.
[1] Gavhale, K.R., Gawande, U. (2014). An overview of the research on plant leaves disease detection using image processing techniques. IOSR Journal of Computer Engineering (IOSR-JCE), 16(1): 10-16. https://doi.org/10.9790/0661-16151016
[2] Agriculture Sector in India. http://www.ibef.org/industry/agriculture-india.aspx. Accessed 28 Aug. 2021.
[3] Gianessi, L.P. (2014). Importance of pesticides for growing rice in South and South East Asia. International Pesticide Benefit Case Study, 108.
[4] Kulkarni, A.H., Patil, A. (2012). Applying image processing technique to detect plant diseases. International Journal of Modern Engineering Research, 2(5): 3661-3664.
[5] Khairnar, K., Dagade, R. (2014). Disease detection and diagnosis on plant using image processing–A review. International Journal of Computer Applications, 108(13): 36-38.
[6] Phadikar, S., Sil, J. (2008). Rice disease identification using pattern recognition techniques. In 2008 11th International Conference on Computer and Information Technology, Khulna, Bangladesh, pp. 420-423. https://doi.org/10.1109/ICCITECHN.2008.4803079
[7] Barbedo, J.G.A. (2013). Digital image processing techniques for detecting, quantifying and classifying plant diseases. SpringerPlus, 2(1): 1-12. https://doi.org/10.1186/2193-1801-2-660
[8] Kamilaris, A., Prenafeta-Boldú, F. (2018). A review of the use of convolutional neural networks in agriculture. The Journal of Agricultural Science, 156(3): 312-322. https://doi.org/10.1017/s0021859618000436
[9] Shah, J.P., Prajapati, H.B., Dabhi, V.K. (2021). Rice leaf diseases data set. https://archive.ics.uci.edu/ml/datasets/Rice+Leaf+Diseases. Accessed 28 Aug. 2021.
[10] Tadeusiewicz, R., Tylek, P., Adamczyk, F., Kielbasa, P., Jablonski, M., Pawlik, P., Pilat, A., Walczyk, J., Szczepaniak, J., Juliszewski, T., Szaroleta, M. (2017). Automation of the acorn scarification process as a contribution to sustainable forest management, case study: Common oak. Sustainability, 9(12): 2276. https://doi.org/10.3390/su9122276
[11] Barbedo, J.G.A. (2013). Digital image processing techniques for detecting, quantifying and classifying plant diseases. SpringerPlus, 2(1): 1-12. https://doi.org/10.1186/2193-1801-2-660
[12] Dhingra, G., Kumar, V., Joshi, H.D. (2018). Study of digital image processing techniques for leaf disease detection and classification. Multimedia Tools Appl, 77(15): 19951-20000. https://doi.org/10.1007/s11042-017-5445-8
[13] Kurniawati, N.N., Abdullah, S.N.H.S., Abdullah, S., Abdullah, S. (2009). Texture analysis for diagnosing paddy disease. 2009 International Conference on Electrical Engineering and Informatics, Bangi, Malaysia, pp. 23-27. https://doi.org/10.1109/ICEEI.2009.5254824
[14] Yao, Q., Guan, Z., Zhou, Y., Tang, J., Hu, Y., Yang, B. (2009). Application of support vector machine for detecting rice diseases using shape and color texture features. In 2009 International Conference on Engineering Computation, Hong Kong, China, pp. 79-83. https://doi.org/10.1109/ICEC.2009.73
[15] Liu, Z.Y., Shi, J.J., Zhang, L.W., Huang, J.F. (2010). Discrimination of rice panicles by hyperspectral reflectance data based on principal component analysis and support vector classification. Journal of Zhejiang University Science B, 11(1): 71-78. https://doi.org/10.1631/jzus.B0900193
[16] Pugoy, R.A.D., Mariano, V.Y. (2011). Automated rice leaf disease detection using color image analysis. In Third international conference on digital image processing (ICDIP 2011), Vol. 8009, p. 80090F. https://doi.org/10.1117/12.896494
[17] Gulhane, V.A., Gurjar, A.A. (2011). Detection of diseases on cotton leaves and its possible diagnosis. International Journal of Image Processing (IJIP), 5(5): 590-598.
[18] Al-Hiary, H., Bani-Ahmad, S., Reyalat, M., Braik, M., Alrahamneh, Z. (2011). Fast and accurate detection and classification of plant diseases. International Journal of Computer Applications, 17(1): 31-38.
[19] Valliammal, N., Geethalakshmi, S.N. (2012). Plant leaf segmentation using nonlinear K means clustering. International Journal of Computer Science Issues (IJCSI), 9(3): 212.
[20] Phadikar, S., Sil, J., Das, A.K. (2012). Classification of rice leaf diseases based on morphological changes. International Journal of Information and Electronics Engineering, 2(3): 460-463.
[21] Pujari, J.D., Yakkundimath, R., Byadgi, A.S. (2013). Classification of fungal disease symptoms affected on cereals using color texture features. International Journal of Signal Processing, Image Processing and Pattern Recognition, 6(6): 321-330. https://www.earticle.net/Article/A214484
[22] Orillo, J.W., Cruz, J.D., Agapito, L., Satimbre, P.J., Valenzuela, I. (2014). Identification of diseases in rice plant (oryza sativa) using back propagation Artificial Neural Network. In 2014 International Conference on Humanoid, Nanotechnology, Information Technology, Communication and Control, Environment and Management (HNICEM), Palawan, Philippines, pp. 1-6. https://doi.org/10.1109/HNICEM.2014.7016248
[23] Rishi, N., Gill, J.S. (2015). An overview on detection and classification of plant diseases in image processing. International Journal of Scientific Engineering and Research (IJSER), 3(5): 114-117.
[24] Xiao, M., Ma, Y., Feng, Z., Deng, Z., Hou, S., Shu, L., Lu, Z. (2018). Rice blast recognition based on principal component analysis and neural network. Computers and Electronics in Agriculture, 154: 482-490. https://doi.org/10.1016/j.compag.2018.08.028
[25] Saleem, M.H., Potgieter, J., Arif, K.M. (2020). Plant disease classification: A comparative evaluation of convolutional neural networks and deep learning optimizers. Plants, 9(10): 1319. https://www.mdpi.com/848486
[26] Kabir, M.M., Ohi, A.Q., Mridha, M.F. (2021). A multi-plant disease diagnosis method using convolutional neural network. In Computer Vision and Machine Learning in Agriculture, pp. 99-111. https://doi.org/10.1007/978-981-33-6424-0_7
[27] Kumbhar, S., Nilawar, A., Patil, S., Mahalakshmi, B., Nipane, M. (2019). Farmer buddy-web based cotton leaf disease detection using CNN. International Journal of Applied Engineering Research, 14(11): 2662-2666.
[28] Karlekar, A., Seal, A. (2020). SoyNet: Soybean leaf diseases classification. Computers and Electronics in Agriculture, 172: 105342. https://doi.org/10.1016/j.compag.2020.105342
[29] Chen, J., Chen, J., Zhang, D., Sun, Y., Nanehkaran, Y.A. (2020). Using deep transfer learning for image-based plant disease identification. Computers and Electronics in Agriculture, 173: 105393. https://doi.org/10.1016/j.compag.2020.105393
[30] Guo, Y., Zhang, J., Yin, C., Hu, X., Zou, Y., Xue, Z., Wang, W. (2020). Plant disease identification based on deep learning algorithm in smart farming. Discrete Dynamics in Nature and Society, 2020: 2479172. https://doi.org/10.1155/2020/2479172
[31] Jadhav, S.B., Udupi, V.R., Patil, S.B. (2020). Identification of plant diseases using convolutional neural networks. International Journal of Information Technology, 1-10. https://doi.org/10.1007/s41870-020-00437-5
[32] Sembiring, A., Away, Y., Arnia, F., Muharar, R. (2021). Development of concise convolutional neural network for tomato plant disease classification based on leaf images. In Journal of Physics: Conference Series, 1845(1): 012009. https://doi.org/10.1088/1742-6596/1845/1/012009
[33] Patidar, S., Pandey, A., Shirish, B.A., Sriram, A. (2020). Rice plant disease detection and classification using deep residual learning. In International Conference on Machine Learning, Image Processing, Network Security and Data Sciences, pp. 278-293. https://doi.org/10.1007/978-981-15-6315-7_23
[34] Upadhyay, S.K., Kumar, A. (2021). A novel approach for rice plant diseases classification with deep convolutional neural network. International Journal of Information Technology, 1-15. https://doi.org/10.1007/s41870-021-00817-5
[35] Patil, S.B., Bodhe, S.K. (2011). Leaf disease severity measurement using image processing. International Journal of Engineering and Technology, 3(5): 297-301.
[36] Powbunthorn, K., Abudullakasim, W., Unartngam, J. (2012). Assessment of the severity of brown leaf spot disease in cassava using image analysis. In The International conference of the Thai Society of Agricultural Engineering, pp. 4-5.
[37] Islam, R., Islam, M.R. (2015). An image processing technique to calculate percentage of disease affected pixels of paddy leaf. International Journal of Computer Applications, 123(12).
[38] Chen, S., Zhang, K., Zhao, Y., Sun, Y., Ban, W., Chen, Y., Zhuang, H., Zhang, X., Liu, J., Yang, T. (2021). An approach for rice bacterial leaf streak disease segmentation and disease severity estimation. Agriculture, 11(5): 420. https://doi.org/10.3390/agriculture11050420
[39] Liang, Q., Xiang, S., Hu, Y., Coppola, G., Zhang, D., Sun, W. (2019). PD2SE-Net: Computer-assisted plant disease diagnosis and severity estimation network. Computers and Electronics in Agriculture, 157: 518-529. https://doi.org/10.1016/j.compag.2019.01.034
[40] https://www.kaggle.com/bahribahri/riceleaf, accessed on 28 August 2021.
[41] Bodapati, J.D., Veeranjaneyulu, N. (2018). Feature extraction and classification using deep convolutional neural networks. Journal of Cyber Security and Mobility, 8(2): 261-276. https://doi.org/10.13052/jcsm2245-1439.825
[42] Otsu, N. (1979). A threshold selection method from gray-level histograms. IEEE Transactions on Systems, Man, and Cybernetics, 9(1): 62-66. https://doi.org/10.1109/TSMC.1979.4310076
[43] Zhou, H., Wu, J., Zhang, J. (2010). Digital image processing: Part II, (2nd edition). London: Bookboon.
[44] Liu, B., Zhang, Y., He, D.J., Li, Y. (2017). Identification of apple leaf diseases based on deep convolutional neural networks. Symmetry, 10(1): 11. https://doi.org/10.3390/sym10010011
[45] Hossin, M., Sulaiman, M.N. (2015). A review on evaluation metrices for data classification evaluations. International Journal of Data Mining and Knowledge Management Process, 5(2): 1-11. https://doi.org/10.5121/ijdkp.2015.5201
[46] Novakovic, J.D., Veljovic, A., Ilic, S.S., Papic, Z., Tomovic, M. (2017). Evaluation of classification models in machine learning. Theory and Applications of Mathematics and Computer Science, 7(1): 39-46.