Farid Ayeche | Adel Alti*
© 2021 IIETA. This article is published by IIETA and is licensed under the CC BY 4.0 license (http://creativecommons.org/licenses/by/4.0/).
OPEN ACCESS
Facial expressions can tell a lot about an individual’s emotional state. Recent technological advances opening avenues for automatic Facial Expression Recognition (FER) based on machine learning techniques. Many works have been done on FER for the classification of facial expressions. However, the applicability to more naturalistic facial expressions remains unclear. This paper intends to develop a machine learning approach based on the Delaunay triangulation to extract the relevant facial features allowing classifying facial expressions. Initially, from the given facial image, a set of discriminative landmarks are extracted. Along with this, a minimal landmark connected graph is also extracted. Thereby, from the connected graph, the expression is represented by a one-dimensional feature vector. Finally, the obtained vector is subject for classification by six well-known classifiers (KNN, NB, DT, QDA, RF and SVM). The experiments are conducted on four standard databases (CK+, KDEF, JAFFE and MUG) to evaluate the performance of the proposed approach and find out which classifier is better suited to our system. The QDA approach based on the Delaunay triangulation has a high accuracy of 96.94% since it only supports non-zero pixels, which increases the recognition rate.
facial image, Delaunay triangulation, shape features, facial expressions, QDA, emotion
During the past decades, there is a lot of research interest in the development of efficient Facial Expression Recognition (FER) systems intending to improve quality of life. The range of FER applications varies from robotics, e-health, enhanced learning and e-crimes that analyze facial expressions and estimate serious tendencies. On the other hand, FER can benefit medical applications by assisting patients with facial paralysis during rehabilitation treatment. Although a robotics teacher can provide a better learning experience to students and can help them build a well understanding of their feelings. For security and surveillance at airports, several FER systems still face several challenges such as reliability and robustness to ensure the safety of drivers due to huge variability in facial appearance such as changes of light, sunglasses, and masks, placement of head and partial occlusions caused to hairs.
Indeed, facial expressions play a very important role in social communication between humans to convey energies, emotions and information without using any words. However, understanding the internal states of a person without seeing their face or facial expressions can be complex and difficult task. There are various channels for conveying non-verbal information to observers such as body gestures, face and voice, but facial expressions remain one of the best mediums in terms of capturing emotional state and signal pain, alertness, intentions and personality traits. In addition, verbal and vocal parts only contribute 7% and 38% respectively, to the impact of the spoken message while facial expression contributes 55% [1]. Thus, the face reflects much more ability to communicate emotions and the recognition of facial expression offers a very effective way to measure the different emotional states of human beings.
The human face is capable of generating many different facial expressions. In the field of scientific research, only six of these expressions are identified according to work-in-depth of behavioral specialist Ekman [2] called Anger (AN), Disgust (DI), Fear (FE), Happiness (HA), Sadness (SA), and Surprise (SU) as “atomic expressions” [2-4]. They also proved that these six expressions are unique among different races, religions, cultures and groups [4]. Some researchers consider the neutral face as a standard set of seven emotions [5-7]. Classifying facial images using the discriminative features of facial expressions can be a complicated task for machines. Machines need to discover and correctly classify numerical facial expressions. However, we need well-designed and adopted systems, which can be achieved through a wide variety of special textural expressions and significant positions of landmarks.
Despite the rapid growth of FER applications, FER system suffers from the main real challenge to find the reliable and efficient feature extraction method that reduces and extracts relevant discriminative features of facial expressions, that giving very appreciable accuracy rate, a complete description of facial expression and fast classification time. Several extraction techniques of features emotions [8-16] can make a significant contribution to classifying facial images. We can distinguish between two types: geometric techniques as well as non-geometric techniques, and hard to pin down for multiple reasons. Several emotional expressions cannot be distinguished only by subtle discriminative features in facial expression images like jupons and china. These facial images are often expressed in very smoothest ways.
In this paper, we propose a new approach addressing some important issues in the recognition of facial expressions through interesting facial positions with less complexity in terms of computation time. The approach is mainly based on landmarks based on the Delaunay triangulation technique to extract only the discriminative features of facial emotions in the face image as a one-dimensional vector. This vector will be transmitted to machine learning and be classified among six facial expressions. Most machine learning techniques are applied to evaluate the performance of the proposed approach and find out which one is better suited to our FER system. This paper seeks to achieve the following contributions:
(1) To the best of our knowledge, few studies have investigated the problem of facial expression features extraction and FER classification and recognition in the context of smoothest textural regions using the enhanced Delaunay Triangulation of landmark performance and machine learning techniques;
(2) The proposed approach is based on the enhanced Delaunay Triangulation of landmark for reduced and relevant facial features extraction and six machine learning techniques for expression’s recognition;
(3) Experiments that are conducted on four standard facial databases showed that the proposed approach achieves a precision of 96.94% for FER recognition.
The rest of this paper is organized as follows. Section 2 presents related works for features extraction and FER recognition. Section 3 details the proposed approach. Section 4 presents the results obtained from our experiments. Finally, Section 4 concludes the paper and provides potential future work.
Many works have been proposed in the past to develop efficient solutions to the tricky problem of facial expression recognition. Below is the result of the analysis of some significant works that have addressed the issue of facial expression with their objectives, advantages and weaknesses.
Tang et al. [8] proposed an efficient system for recognizing facial expressions using geometrical features based on psychology and physiology. Liang et al. [9] examined naturel fine-grained facial expressions. They extended the six standard classes to 33 classes and built a new benchmark FG-facial emotion. They proposed a new end-to-end Multi-Scale Action Unit-based Network (MSAU-Net) for facial expression recognition.
Zhang et al. [10] extract a geometry shape of facial images to synthesize facial images. This work proposes a method for pose-invariant facial expression recognition using a deep learning model. Despite the results being very remarkable, the approach is heavy in terms of reliability and robustness of the recognition which is greatly influenced by correct detection of landmarks; otherwise, the recognition accuracy will be decreased.
Mandal et al. [11] uses SVM for the recognition of facial expressions. They extract adaptive thresholds for a facial image. They based on a technique to adjust threshold parameters in the local neighborhood in an adaptive manner for different images then multi-distance magnitude features are encoded.
Supta et al. [12] used the well-known descriptor Histogram oriented Gradients (HOG) to detect deformation features according to facial expressions. Barman and Dutta [13] used Active Appearance Models (AAM) model to define a shape and calculate a distance signature with statistical features. Their objective is to create a smaller-scale, low-cost method of analyzing, monitoring and predicting traffic conditions. The use of a Multilayer Perceptron (MLP) for classification leads to boost up expression recognition performance. Barman and Dutta [14] have introduced a texture signature method capable of generating landmarks. These landmarks and with the adaptation of the distance signature, the AMM will be generated.
Golzadeh et al. [15] proposed an automatic emotion recognition system based on spatiotemporal feature extraction by tracking facial landmarks. The features are trained using multiple classification methods to verify whether they are discriminative enough for good recognition. Avishek et al. [16] proposed an AAM model with a new triangular structure using three points: Circumcenter, Incenter, and Centroid that are considered as geometric primitives to extract relevant emotion’s features. A Multi-Layer Perceptron (MLP) classifier is applied on various benchmark databases to evaluate the efficiency of this approach. This approach has high accuracy since it covers the main face’s features, which increases the recognition rate. Recently, Nasir and Paramartha [17] extend this work for a map construction using a triangulation mechanism. This mechanism gets accurate results, even considering a pair of circles, viz, incircle and circumcircle took from the landmark points of the face images. These geometric features arising out of such a pair ensured efficient classification of different emotional transitions from various face image sequences.
This process of extracting relevant and discriminative landmarks in facial images is based on the Delaunay triangulation by localizing the face, applying an active appearance model, adapting and normalizing the face’s model, triangularization landmarks and constructing the feature vector in the face images as illustrated in Figure 1.
Figure 1. Obtained results of landmarks on six well-known facial expressions
This process is necessary before machine training and test algorithms to achieve high accuracy and increase performance of the system. In the next subsections, the different phases composing the proposed approach are detailed.
3.1 Face detection phase
For this phase, the input is an image of and the output is an image enclosing the detected face. This phase is automated by applying the Viola and Jones algorithm which solves the complex problems of edge and changes in brightness [18]. Our choice of Viola and Jones algorithm is justified by its noise invariant and good scaling in detecting objects from images in several different applications. To detect faces from facial images, the Adaboost of the Viola-Jones algorithm consists of two successive steps: (1) Extraction of HAAR features; (2) classification using Adaboost.
3.2 Building the active appearance model (AAM)
The active appearance model (AAM) [13, 14, 16, 18] aims to create a face model and describe the main features of the face namely nose, mouth, eyes and eyebrows by representing faces images labeled with landmarks that define the general geometric shape of a face. Shape models are essential to generate a statistical model in order to customize and control the variations in the shape of a face. In face representation phase, the AAM model is approximated with any new example. The AAM model is constituted of three main phases: 1 Shape model-building phase; 2) Texture model-building phase; 3) Combined appearance model.
Phase 1. Building the Shape Model [19]. Apply shape model L of 2-dimensional including n=68 points. The points are placed in face regions that contain rich textural information. Each instance s of the shape model can be described as a vector consisting of 2n elements:
$s=\left(x_{1}, x_{2}, \ldots, x_{n}, y_{1}, y_{2}, \ldots, y_{n}\right)^{T}$ (1)
To detect these points from face images, the process of the shape model consists of four successive steps:
(1) First, the Generalized Orthogonal Procrustes Analysis (GPA) [20] is applied to shape model to eliminate the geometric effect caused by translation, rotation and scaling. In addition, the GPA algorithm generates additional shapes by mirroring the learning shapes horizontally as its goal is to achieve a reliable, efficient, and robust recognition system. This returns new shapes for training of 2N examples.
(2) The mean shape $\bar{s}$ can be computed on new learning data set as follows:
$\bar{s}=\frac{1}{2 N} \sum_{i=1}^{2 N} L_{i}^{\prime}$ (2)
where, $L_{i}^{\prime}$ denotes a new training data set.
(3) The Principal Component Analysis (PCA) is applied to this data set to calculate Eigen-vectors and Eigen-values. This allows us to build the AAM model and subsequently to generate new shapes according to the constructed model. The m components with the biggest Eigen-values will be selected as the shape components L1 to Lm.
$s=\bar{s}+\sum_{i=1}^{m} p_{i} * b_{i}$ (3)
where, $\bar{s}$ denotes the average form; pi denotes a set of orthogonal modes of grey variation; bi denotes a set of grey-level parameters
Phase 2. Building the texture model [19]. The second main phase in AAM model is to build the texture model that transforms the input images of large dimensions into a linear subspace of cleaned faces to reduce the representation space of the information. Steps that are used in the texture model are listed below:
(1) Image-Texture piecewise transformation: The first step of building texture Model consists of converting each image I(x) into a basic form $\bar{s}$. This transformation is performed by applying apiece wise function I(W(x, p)) [16], which transforms an input image I(x) with the shape s and parameters p to the basic form $\bar{s}$ as shown in Eq. (3) The average of the texture images A0(x) can be calculated as follows:
$A_{0}(x)=\frac{1}{N} \sum_{i=1}^{N} I(W(x, p))$ (4)
(2) Image-eigenvalues transformation: In this step, the texture images are converted into components using PCA (Principal Components Analysis). We keep only k components of appearance with the biggest eigenvalues A1(x) to Ak(x). Finally, the AAM model A(x) can be represented as an average appearance A0(x) and a linear combination of the one-appearance vectors Ai(x).
$A(x)=A_{0}(x)+\sum_{i=1}^{m} \lambda_{i} * A_{i}(x)$ (5)
Phase 3. Building the combination appearance model [19]. The AAM appearance model is the combination of the shape model and the texture model. For this, we combine the appearance parameters λ=(λ1, λ2, ..., λm) and the shape parameters p=(p1, p1, ..., pm).Using Eq. (5). The image A(x) in the form of the base shape S0 can be calculated. After that, the image A(x) can be transformed into the form S using the warp function W(x, p).
3.3 Model adaptation phase
After the AAM model phase, the adaptation of the AAM model is necessary before identifying the landmark points. This step allows adapting the trained model to an unknown input image I(x). We solve the optimization problem of Eq. (6) and find the optimal parameters p and λ.
$\arg \min _{p, \lambda} \sum_{x \in s_{0}}\left[A_{0}(x)+\sum_{i=1}^{m} \lambda_{i} A_{i}(x)-I(W(x, p))\right]^{2}$ (6)
3.4 Shape normalization phase
This phase aims to eliminate the effects of scale, rotation and translation between all shapes using the ASM model to identify the relevant facial information that will greatly increase and improve the recognition rate of the proposed system. The Generalized Procrustes Analysis (GPA) [20] is applied to normalize the different shapes that will greatly influence the quality and reliability of the FER system.
Figure 2 shows an example of shapes before and after the application of GPA.
Figure 2. Shapes before and after the application of GPA
3.5 The Delaunay triangulation phase
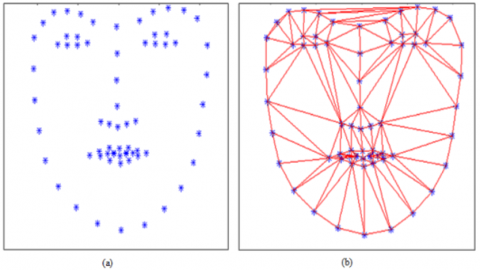
At this phase, faces are represented by geometric shapes. Each shape contains68 facial landmarks. It is detected using the positions of eyebrows, eyes, nose, lips and the contour of the face. These facial landmarks change over time according to continuous movements of facial muscles. These landmarks are then connected to obtain a graph. The density of the graphics varies in each facial expression due to facial movements. We use the famous Delaunay triangulation to connect a set of landmarks to construct a triangular mesh. Therefore, after the graph is connected, we obtain 109 triangles formed on the human face as shown in Figure 3.
Figure 3. A triangular mesh (a) Facial landmarks, (b) C among landmarks
The proposed system deals with the recognition of facial expressions. The difference between the facial expressions of an individual or several individuals naturally occurs on facial movements. At the first step, we use the AAM model to locate landmarks of facial components as named eyes, eyebrows, nose, and mouth. Then, we use Generalized Procrustes Analysis (GPA) [20] for face normalization to reduce as much as possible the difference in geometric shapes. The obtained results are represented by Delaunay's triangulation as a connected graph composed of triangles that simulate the geometric shape of facial expression. Finally, we apply machine learning to classify the facial expressions to improve the reliability and robustness of face recognition method.
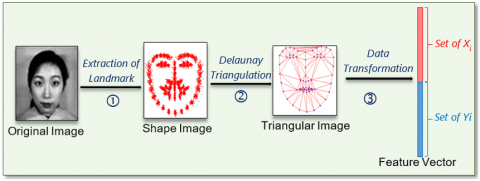
3.6 Feature vector construction phase
This phase begins with a geometric representation of the features extracted from a face image to design a connected graph composed of several triangles as illustrated in Figure 4. Each triangle has three points called Centroid, Incenter, and Circumcenter. Two different approaches can be used to define the final representation of the data. The first is to use the distances and slopes between the different points of a triangle including Centroid, Incenter, and Circumcenter. The second only uses the coordinates of points (its abscissas and ordinates) as an information tool. We choose to apply the localization of points for final data representation that provides a higher recognition rate compared to the first approach based on several test results. After testing the two approaches used, we can decide to perform the second approach with three points of the triangle as well as Centroid point to find the best results. Now, a one-dimensional feature vector is used to represent each expression in a face image. All the feature vectors are finally constructed are stored in a database representing all the facial expressions of the face images of the initial database. Let F be the database containing feature vectors defined by:
$F=\left(q_{1} ; q_{2} ; \ldots ; q_{m}\right)$ (7)
where, qi denotes the shape vector; m is the number of shapes.
Figure 4. Construction of features vector
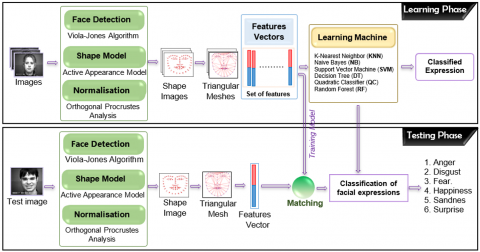
This section proposes a new approach for the automatic facial expression features extraction and recognition of facial expressions. This approach consists of two fundamental and successive phases as shown in Figure 5. These phases are training and testing.
4.1 Training phase
This phase allows extracting the features and landmarks from all facial images after detecting their faces image. We choose to apply AAM/ASM model for face’s shape feature extraction. The AAM model is used to find relevant regions that contain characters of the license plate. The ASM is then used to find out series of valley points separating characters. The face’s shape is normalized and aligned to remove all components caused by geometric transformations (translations, rotation, and scaling). After the normalization, the system extracts landmarks of all facial images as feature vectors. Then, a connected graph that represents the shape is defined using the Delaunay triangulation technique to handle the facial expression as an integral entity. Each facial expression is represented as a one-dimensional vector, which groups all triangles and their point of the barycenter. All vectors are finally stored in the same database.
Figure 5. General architecture of the proposed framework
4.2 Classification learning
Likewise, the test process extracts the characteristics and landmarks of the test image and will be compared to those formed from the vectors extracted in the database to identify its classes of emotions using six of the most popular classifiers in the field of facial expression recognition. In the next subsections, the different phases composing the proposed approach are detailed. Each image is then represented by a one-dimensional shape vector composed of two parts the abscissas and the ordinates of the points representing the set of Delaunay triangle for each triangle we have added the barycenter point of the triangle to give more discrimination to our characteristic vector. All the one-dimensional vectors thus constructed are grouped in the same database representing all the images of faces used. Then we subdivide our new database into two parts learning and testing. Our goal is to select the best classifier among the most standard classifiers that can be used in the recognition of facial expressions:
|
Algorithm 1. A training algorithm for FER. |
|
Inputs: A set of N expression images of size n×m. Outputs: Classified expression level for input image database. Begin Step 1: Extract the Landmark points using AAM. Step 2: Each shape is represented by landmark points $L=\left[\left(x_{1}, y_{1}\right),\left(x_{2}, y_{2}\right) \ldots\left(x_{L}, y_{L}\right)\right]$ Step 3: Generate the set of Triangulation Delaunay T using Landmark points, where $T=\left[\left(x_{i}, y_{i}\right),\left(x_{j}, y_{j}\right),\left(x_{k}, y_{k}\right)\right]$ and $i, j, k \in[1..L]$ Step 4: For ti in T Compute the barycenter p=(p1, p2) of triangle. End For Step 5: Combine the points of a triangle with barycenter point: $\left[\left(x_{i}, y_{i}\right),\left(x_{j}, y_{j}\right),\left(x_{k}, y_{k}\right),\left(p_{1}, p_{2}\right)\right]$ Step 6: Divide the dataset into 80% and 20% ratios for training and testing. Step 7: Train six machine learning classifiers with training data and use validation overfitting. Step 8: Test the six Classifiers based on tested databases. End. |
In this section, we will detail the implementation of the proposed work and the obtained results using the proposed approach.
5.1 Data sets
To validate the proposed facial expression recognition approach, we have tested our proposed framework on four well-known facial expressions databases:
(1) Extended Cohn-Kanade (CK+) dataset is a complete dataset for action unit and emotion-specified expression which contains 593 sequences from 123 subjects [27];
(2) Japanese Female Facial Expression (JAFFE) dataset contains 213 expressions of 10 Japanese females with each object posed four examples for each of the seven basic expressions (six emotional expressions plus neutral face) [28];
(3) Karolinska Directed Emotional Faces (KDEF) dataset consists of 4900 images of human facial expressions. The set of images contains 70 individuals displaying seven different emotional expressions [29];
(4) Multimedia Understanding Group (MUG) dataset contains 1462 images and provides a set of landmark point annotations for 1222 images [30].
All experiments were carried out on Intel(R) Core (TM) i5-3217U CPU @ 1.80GHz with 4GB RAM Laptop, using Windows 8 (64 bit) stem. We have used Dlib prediction model library for extracting 68 facial landmark points using open CV and Python [31]. Note that AAM model achieved 100% detection accuracy in CK+, JAFFE, MUG database, and 99.2% in KDEF database.
5.2 Splitting the data
We divide the data set into two parts: the first part uses the training data set with a size of 80%, the test part has a size of 20%. We have carried out several performance experiments using the most used learning algorithms. Our work is based on the applications of the Delaunay triangulation of landmark and six classifiers to validate the accuracy and execution time of each one to find out which one gives high accuracy and short execution time.
5.3 Evaluation metrics
We evaluated and compared the performance in automatically recognizing facial expressions in terms of effectiveness and efficiency.
5.3.1 Effectiveness metrics
Accuracy (A) to measure how a classifier can expect the correct predictions.
Precision (P) to identify the number of relevant faces among the classified ones.
Recall (R) to identify the number of corrected classified faces images over all the faces images.
F1-score to evaluate a weighted Precision and Recall.
$A=\frac{T P+T N}{T P+T N+F P+F N}$ (8)
$P=\frac{T P}{T P+F P}$ (9)
$R=\frac{T P}{T P+F N}$ (10)
$F_{1}=2 \times \frac{P \times R}{P+R}$ (11)
where, TP, True Positive, is the number of facial expressions which are correctly recognized; FP, False Positive, is the number of facial expressions which are incorrectly recognized; TN, True Negative, is the number of correct facial expressions that are incorrectly recognized; FN, False Negative, is the number of correct facial expressions that are incorrectly recognized.
PSNR [29] is a logarithmic function of Mean Square Error (MSE) interpreted as a corrected version of the Signal-to-Noise Ratio. A perfect similarity between two images is expressed when PSNR→∞, which means that the two images are perfectly identical. The PSNR is calculated using Eq. (12):
$\operatorname{PSNR}(X, Y)=10 \log _{10}\left(\frac{255^{2}}{\frac{1}{\mathrm{M} \times \mathrm{N}} \sum_{i=1}^{M} \sum_{j=1}^{N}\left(X_{i j}-Y_{i j}\right)^{2}}\right)$ (12)
where, xij, y are the pixel (i, j) in the original image x and the watermarked imagey respectively. M×N is the size of the image.
Average difference (AD) [32] expresses the similarity between the original image and the distorted one. Good classification means having the lowest difference value. Usually, it can be considered good if AD is close to or equal to zero. This metric is computed as follows:
$A D(x, y)=\frac{1}{N M} \sum_{i=1}^{N} \sum_{j=1}^{M}\left|x_{i, j}-y_{i, j}\right|$ (13)
Maximum difference (MD) [32] provides the maximum difference between the original image and the distorted one. It is used to measure the maximum accuracy of the proposed descriptors and it is defined as follows:
$M D(x, y)=\max \left|x_{i, j}-y_{i, j}\right|$ (14)
Structural content (SC) [32] is expressed as follows:
$\operatorname{SC}(x, y)=\frac{\sum_{i=1}^{N} \sum_{j=1}^{M} \quad x_{i, j}{ }^{2}}{\sum_{i=1}^{N} \sum_{j=1}^{M} \quad y_{i, j}{ }^{2}}$ (15)
Normalized absolute error (NAE) [32] expresses the similarity between the original image and the distorted one. A lower NAE value shows that image is of good classification. It is defined as follows:
$\operatorname{NAE}(x, y)=\frac{\sum_{i=1}^{N} \sum_{j=1}^{M} \quad \left|x_{i, j}-y_{i, j}\right|}{\sum_{i=1}^{N} \sum_{j=1}^{M} \quad \left|x_{i, j}\right|}$ (16)
5.3.2 Efficiency metrics
We also use execution time for comparing the presented approach using six classifiers. In the next section, we explain different experiments and the results
5.4 Experiments on CK + database
The CK+ expression dataset is a combination of posed and spontaneous expressions. The resolution of all images for training, validation and testing of size 256×256. The images set ranging from18 to 50 years old age consisting of 69 female, 81Euro-American, 13 Afro-American, and 6 other groups have 326 images of peak facial expressions for seven emotion categories are anger (AN), contempt (CO), disgust (DI), fear (FE), happiness (HA), sadness (SA), and surprise (SU), varying between posed and non-posed facial expressions of 210 adults. We consider the best quality to consider these properties of a good dataset. Figure 6 demonstrates samples of CK + database.
Figure 6. Samples of CK + database
5.4.1 Evaluation and comparison regarding accuracy
Table 1 shows the comparison of the precision, recall, and F1-score of the proposed approach using the most standard classification approaches (KNN [21], NB [22], SVM [23], DT [24], QDA [25], RF [26]). The QDA [25] based on Delaunay triangulation of landmark attains a promising precision as compared to other classifiers with 100% on CK+ database. Besides, QDA with the Delaunay triangulation achieves 100% Recall and demonstrates a higher F1 score rate of 100%.
Table 1. Accuracy comparison for different classification approaches on CK+ database
|
Classifier |
Accuracy |
Recall |
F1-Score |
|
KNN |
95.24% |
95.97% |
95.60% |
|
NB |
95.24% |
95.56% |
95.39% |
|
DT |
80.95% |
86.39% |
83.58% |
|
QDA |
100% |
100% |
100% |
|
RF |
92.06% |
93.25% |
92.65% |
|
SVM |
87.30% |
88.49% |
87.89% |
Table 2. Confusion matrix of CK+ database of KNN and Delaunay triangulation
|
|
AN |
CO |
DI |
FE |
HA |
SA |
SU |
|
AN |
88.89 |
0.00 |
11.11 |
0.00 |
0.00 |
0.00 |
0.00 |
|
CO |
0.00 |
88.89 |
0.00 |
0.00 |
0.00 |
11.11 |
0.00 |
|
DI |
0.00 |
0.00 |
100 |
0.00 |
0.0 |
0.00 |
0.00 |
|
FE |
0.00 |
0.00 |
0.00 |
88.8 |
0.0 |
11.11 |
0.00 |
|
HA |
0.00 |
0.00 |
0.00 |
0.00 |
100 |
0.00 |
0.00 |
|
SA |
0.00 |
0.00 |
0.00 |
0.00 |
0.0 |
100 |
0.00 |
|
SU |
0.00 |
0.00 |
0.00 |
0.00 |
0.0 |
0.00 |
100 |
Table 3. Confusion matrix of CK+ database using NB and Delaunay triangulation
|
|
AN |
CO |
DI |
FE |
HA |
SA |
SU |
|
AN |
100 |
0.00 |
0.00 |
0.00 |
0.00 |
0.00 |
0.00 |
|
CO |
0.00 |
100 |
0.00 |
0.00 |
0.00 |
0.00 |
0.00 |
|
DI |
11.11 |
0.00 |
88.8 |
0.00 |
0.0 |
0.00 |
0.00 |
|
FE |
0.00 |
0.00 |
0.00 |
88.89 |
0.0 |
11.11 |
0.00 |
|
HA |
0.00 |
0.00 |
0.00 |
0.00 |
100 |
0.00 |
0.00 |
|
SA |
0.00 |
11.11 |
0.00 |
0.00 |
0.0 |
88.89 |
0.00 |
|
SU |
0.00 |
0.00 |
0.00 |
0.00 |
0.0 |
0.00 |
100 |
Table 4. Confusion matrix of CK+ database of KNN using DT and Delaunay triangulation
|
|
AN |
CO |
DI |
FE |
HA |
SA |
SU |
|
AN |
55.56 |
0.00 |
44.44 |
0.00 |
0.00 |
0.00 |
0.00 |
|
CO |
0.00 |
88.89 |
0.00 |
0.00 |
0.00 |
0.00 |
11.11 |
|
DI |
0.00 |
0.00 |
100 |
0.00 |
0.00 |
0.00 |
0.00 |
|
FE |
0.00 |
11.11 |
0.00 |
88.89 |
0.00 |
0.00 |
0.00 |
|
HA |
0.00 |
0.00 |
11.11 |
0.00 |
88.89 |
0.00 |
0.00 |
|
SA |
0.00 |
44.44 |
0.00 |
11.11 |
0.00 |
44.44 |
0.00 |
|
SU |
0.00 |
0.00 |
0.00 |
0.00 |
0.00 |
0.00 |
100 |
Table 5. Confusion matrix of CK+ database of KNN using QDA and Delaunay triangulation
|
|
AN |
CO |
DI |
FE |
HA |
SA |
SU |
|
AN |
100 |
0.00 |
0.00 |
0.00 |
0.00 |
0.00 |
0.00 |
|
CO |
0.00 |
100 |
0.00 |
0.00 |
0.00 |
0.00 |
0.00 |
|
DI |
0.00 |
0.00 |
100 |
0.00 |
0.00 |
0.00 |
0.00 |
|
FE |
0.00 |
0.00 |
0.00 |
100 |
0.00 |
0.00 |
0.00 |
|
HA |
0.00 |
0.00 |
0.00 |
0.00 |
100 |
0.00 |
0.00 |
|
SA |
0.00 |
0.00 |
0.00 |
0.00 |
0.00 |
100 |
0.00 |
|
SU |
0.00 |
0.00 |
0.00 |
0.00 |
0.00 |
0.00 |
100 |
Confusion matrix are measured between the predicted facial expressions and actual facial expressions. The results of our proposed approach on CK+ Dataset are shown in Tables 2, 3, 4, 5 and 6 and noticeably outweigh seven of well-known facial expressions. According to Table 2, 3, 4, 5, 6 and 7, SVM and QDA based on Delaunay triangulation show close results with respect to expression facial features and even QDA is a bit better. The reason comes from the relevant feature extraction in the Delaunay triangulation algorithms and the powerful classifier QDA. QDA considers the highest importance to the most interesting point of high texture.
Table 6. Confusion matrix of CK+ dataset of KNN using RF and Delaunay triangulation
|
|
AN |
CO |
DI |
FE |
HA |
SA |
SU |
|
AN |
100 |
0.00 |
0.00 |
0.00 |
0.00 |
0.00 |
0.00 |
|
CO |
0.00 |
66.67 |
0.00 |
33.33 |
0.00 |
0.00 |
0.00 |
|
DI |
11.11 |
0.00 |
88.89 |
0.00 |
0.00 |
0.00 |
0.00 |
|
FE |
0.00 |
0.00 |
0.00 |
88.89 |
0.00 |
11.11 |
0.00 |
|
HA |
0.00 |
0.00 |
0.00 |
0.00 |
100 |
0.00 |
0.00 |
|
SA |
0.00 |
0.00 |
0.00 |
0.00 |
0.00 |
100 |
0.00 |
|
SU |
0.00 |
0.00 |
0.00 |
0.00 |
0.00 |
0.00 |
100 |
Table 7. Confusion matrix of CK+ database of KNN using SVM and Delaunay triangulation
|
|
AN |
CO |
DI |
FE |
HA |
SA |
SU |
|
AN |
100 |
0.00 |
0.00 |
0.00 |
0.00 |
0.00 |
0.00 |
|
CO |
0.00 |
77.78 |
0.00 |
0.00 |
0.00 |
0.00 |
22.22 |
|
DI |
0.00 |
0.00 |
100 |
0.00 |
0.00 |
0.00 |
0.00 |
|
FE |
0.00 |
0.00 |
0.00 |
66.67 |
0.00 |
22.22 |
11.11 |
|
HA |
0.00 |
0.00 |
0.00 |
11.11 |
88.89 |
0.00 |
0.00 |
|
SA |
0.00 |
0.00 |
0.00 |
11.11 |
0.00 |
88.89 |
0.00 |
|
SU |
0.00 |
0.00 |
0.00 |
11.11 |
0.00 |
0.00 |
88.89 |
5.4.2 Evaluation and comparison regarding similarity measures
The similarity is evaluated through all mentioned measures needed for classifying an input image. Tables 8 shows a comparison of the similarity measures on CK+ Dataset for six classifiers. From that Table 8, it is noted that the value of similarity of QDA based on Delaunay triangulation is better than other classifiers (KNN [21], NB [22], SVM [23], DT [24], RF [26]). Such high similarity measure and low error indicated that the proposed Delaunay triangulation will achieve higher similarity values (100%) and is therefore suitable for facial expression recognition.
Table 8. Comparison of the similarity measures on the CK+ database for six classifiers
|
Method |
MSE |
PSNR |
MNCC |
AD |
SC |
MD |
NAE |
|
KNN |
0.122 |
57.25 |
0.952 |
0.122 |
1.09 |
1 |
0.09 |
|
NB |
0.122 |
57.25 |
0.952 |
0.122 |
1.09 |
1 |
0.09 |
|
DT |
1.632 |
46.00 |
0.809 |
0.489 |
1.31 |
5 |
0.38 |
|
QDA |
0.000 |
99.00 |
1.000 |
0.000 |
1.00 |
0 |
0.00 |
|
RF |
0.449 |
51.60 |
0.920 |
0.204 |
1.13 |
3 |
0.15 |
|
SVM |
0.571 |
50.56 |
0.873 |
0.326 |
1.25 |
3 |
0.25 |
5.5 Experiments on KDEF database
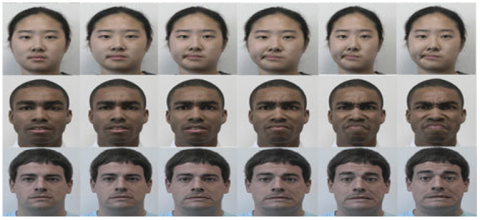
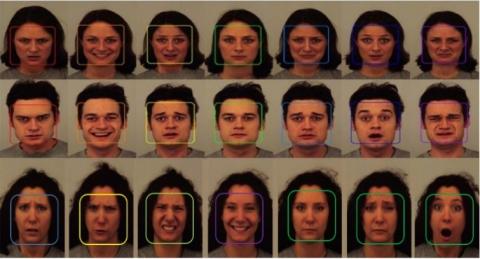
KDEF database regroups facial expression images from 140 amateur actors (70 men and 70 women) all of them between 20-30 years old, at five different view angles. In our work, we have only considered frontal images. We have conducted the experiments in 490 facial expression images (70 Surprise, 70 Disgust, 70 Happy, 70 Sad, 70 Angry, 70 Fear, and 70 Neutral). All images are in the size of 128x128 and divided into 8x8 = 64 equally blocks. Figure 7 illustrates samples of KDEF dataset.
Figure 7. Samples of KDEF database
5.5.1 Evaluation and comparison regarding accuracy
According to the results of Table 9, QDA shows best accuracy of 96.94%, recall 97.26% and F1-score 97.10% than other classifiers (KNN [18], NB [19], SVM [20], DT [21], RF [23]). The reason goes to the introduction of shape normalization as well as localization of face’s components points.
Tables 10-15 indicate remarkable outcomes of the proposed method with the most standard machine learning in the recognition of facial expressions. As it is shown in Table 13-15 in comparison of QDA, SVM, and DT with other classifiers, values of the confusion matrix of these classifiers are high, while the other classifiers KNN, NB, and RF for FER, are low.
Table 9. Accuracy comparison for different classification approaches on KDEF database
|
Classifier |
Accuracy |
Recall |
F1-Score |
|
KNN |
79.59% |
79.75% |
79.67% |
|
NB |
83.67% |
86.03% |
84.84% |
|
DT |
75.51% |
79.30% |
77.36% |
|
QDA |
96.94% |
97.26% |
97.10% |
|
RF |
88.78% |
88.10% |
87.41% |
|
SVM |
80.61% |
84.35% |
82.44% |
Table 10. Confusion matrix of KDEF database of KNN and Delaunay triangulation
|
|
AN |
CO |
DI |
FE |
HA |
SA |
SU |
|
AN |
28.57 |
0.00 |
0.00 |
0.00 |
0.00 |
28.57 |
42.86 |
|
CO |
0.00 |
78.57 |
0.00 |
0.00 |
21.43 |
0.00 |
0.00 |
|
DI |
0.00 |
0.00 |
100 |
0.00 |
0.00 |
0.00 |
0.00 |
|
FE |
0.00 |
0.00 |
0.00 |
100 |
0.00 |
0.00 |
0.00 |
|
HA |
0.00 |
0.00 |
0.00 |
0.00 |
100 |
0.00 |
0.00 |
|
SA |
14.29 |
0.00 |
0.00 |
0.00 |
14.29 |
64.29 |
7.14 |
|
SU |
7.14 |
0.00 |
0.00 |
0.00 |
0.00 |
7.14 |
85.71 |
Table 11. Confusion matrix of KDEF database using NB and Delaunay triangulation
|
|
AN |
CO |
DI |
FE |
HA |
SA |
SU |
|
AN |
42.86 |
0.00 |
0.00 |
0.00 |
0.00 |
21.43 |
35.71 |
|
CO |
0.00 |
64.29 |
0.00 |
0.00 |
35.71 |
0.00 |
0.00 |
|
DI |
0.00 |
0.00 |
100 |
0.00 |
0.00 |
0.00 |
0.00 |
|
FE |
0.00 |
0.00 |
0.00 |
100 |
0.00 |
0.00 |
0.00 |
|
HA |
0.00 |
0.00 |
0.00 |
0.00 |
100 |
0.00 |
0.00 |
|
SA |
7.14 |
0.00 |
0.00 |
0.00 |
0.00 |
92.86 |
0.00 |
|
SU |
0.00 |
0.00 |
0.00 |
0.00 |
0.00 |
14.29 |
85.71 |
Table 12. Confusion matrix of KDEF database of KNN using DT and Delaunay triangulation
|
|
AN |
CO |
DI |
FE |
HA |
SA |
SU |
|
AN |
57.14 |
0.00 |
0.00 |
0.00 |
0.00 |
7.14 |
35.71 |
|
CO |
0.00 |
71.43 |
0.00 |
7.14 |
21.43 |
0.00 |
0.00 |
|
DI |
0.00 |
0.00 |
100 |
0.00 |
0.00 |
0.00 |
0.00 |
|
FE |
14.29 |
0.00 |
0.00 |
85.71 |
0.00 |
0.00 |
0.00 |
|
HA |
14.29 |
7.14 |
0.00 |
0.00 |
78.57 |
0.00 |
0.00 |
|
SA |
28.57 |
0.00 |
0.00 |
0.00 |
0.00 |
71.43 |
0.00 |
|
SU |
35.71 |
0.00 |
0.00 |
0.00 |
0.00 |
0.00 |
64.29 |
Table 13. Confusion matrix of KDEF database of KNN using QDA and Delaunay triangulation
|
|
AN |
CO |
DI |
FE |
HA |
SA |
SU |
|
AN |
100 |
0.00 |
0.00 |
0.00 |
0.00 |
0.00 |
0.00 |
|
CO |
0.00 |
92.86 |
0.00 |
0.00 |
7.14 |
0.00 |
0.00 |
|
DI |
0.00 |
0.00 |
100 |
0.00 |
0.00 |
0.00 |
0.00 |
|
FE |
0.00 |
0.00 |
0.00 |
100 |
0.00 |
0.00 |
0.00 |
|
HA |
0.00 |
0.00 |
0.00 |
0.00 |
100 |
0.00 |
0.00 |
|
SA |
7.14 |
0.00 |
0.00 |
0.00 |
0.00 |
92.86 |
0.00 |
|
SU |
7.14 |
0.00 |
0.00 |
0.00 |
0.00 |
0.00 |
92.86 |
Table 14. Confusion matrix of KDEF database of KNN using RF and Delaunay triangulation
|
|
AN |
CO |
DI |
FE |
HA |
SA |
SU |
|
AN |
50 |
0.00 |
0.00 |
7.14 |
0.00 |
14.29 |
28.57 |
|
CO |
0.00 |
78.57 |
0.00 |
0.00 |
21.43 |
0.00 |
0.00 |
|
DI |
0.00 |
0.00 |
100 |
0.00 |
0.00 |
0.00 |
0.00 |
|
FE |
0.00 |
0.00 |
0.00 |
100 |
0.00 |
0.00 |
0.00 |
|
HA |
0.00 |
0.00 |
0.00 |
0.00 |
100 |
0.00 |
0.00 |
|
SA |
0.00 |
0.00 |
0.00 |
0.00 |
14.29 |
85.71 |
0.00 |
|
SU |
7.14 |
0.00 |
0.00 |
0.00 |
0.00 |
0.00 |
92.86 |
Table 15. Confusion matrix of KDEF database of KNN using SVM and Delaunay triangulation
|
|
AN |
CO |
DI |
FE |
HA |
SA |
SU |
|
AN |
7.14 |
28.57 |
0.00 |
0.00 |
0.00 |
21.43 |
42.86 |
|
CO |
0.00 |
78.57 |
0.00 |
0.00 |
21.43 |
0.00 |
0.00 |
|
DI |
0.00 |
0.00 |
100 |
0.00 |
0.00 |
0.00 |
0.00 |
|
FE |
0.00 |
0.00 |
0.00 |
100 |
0.00 |
0.00 |
0.00 |
|
HA |
0.00 |
0.00 |
0.00 |
0.00 |
100 |
0.00 |
0.00 |
|
SA |
0.00 |
14.29 |
0.00 |
0.00 |
0.00 |
85.71 |
0.00 |
|
SU |
0.00 |
0.00 |
0.00 |
0.00 |
0.00 |
7.14 |
92.86 |
5.5.2 Evaluation and comparison regarding similarity measures
In Table 16, values concerning PSNR, NAE, and MSE of the QDA classifier are around 57.25, 0.0612 and0.1224 respectively. They are the highest relatively those of (KNN [21], NB [22], SVM [23], DT [24], and RF [26]).
Table 16. Comparison of the similarity measures on the KDEF database for several classifiers
|
Method |
MSE |
PSNR |
MNCC |
AD |
SC |
MD |
NAE |
|
KNN |
4.285 |
41.81 |
0.795 |
0.816 |
1.34 |
10 |
0.40 |
|
NB |
3.224 |
43.04 |
0.836 |
0.653 |
1.26 |
8 |
0.32 |
|
DT |
3.918 |
42.19 |
0.755 |
0.979 |
1.53 |
6 |
0.48 |
|
QDA |
0.122 |
57.25 |
0.969 |
0.122 |
1.06 |
1 |
0.06 |
|
RF |
2.000 |
45.12 |
0.867 |
0.530 |
1.24 |
7 |
0.26 |
|
SVM |
5.265 |
40.91 |
0.806 |
0.775 |
1.24 |
13 |
0.38 |
5.6 Experiments on JAFFE database
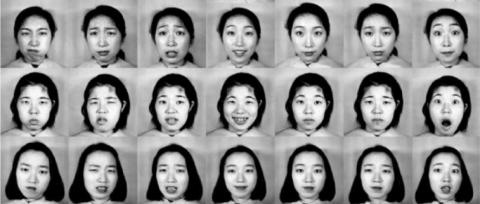
In this experiment, JAFFE database is exploited. This dataset includes 213 peak facial expressions from ten subjects. Seven emotion categories are considered, happiness, sadness, surprise, anger, disgust, and natural. The gray level images are of size 256×256. We used the fdlibmex library, free code available for MATLAB for face detection. We normalized all the evaluated face images before the experimentation in size of 128×128 pixels. Figure 8 presents samples of the JAFEE database.
Figure 8. Simples of JAFFE database
5.6.1 Evaluation and comparison regarding accuracy
In Table 17, accuracy, recall, and F1-score values are computed for all six classifiers based on Delaunay triangulation during the classification phase. The obtained results of SVM are slightly better than other classifiers (KNN [21], NB [22], DT [24], RF [26]) as their higher values are respectively 71.43, 73.57 and 33.61. SVM succeed on JAFEE database.
Table 17. Comparison of the similarity measures on the KDEF database for several classifiers
|
Classifier |
Accuracy |
Recall |
F1-Score |
|
KNN |
64.29% |
62.82% |
63.54% |
|
NB |
50.00% |
52.91% |
51.41% |
|
DT |
47.62% |
55.60% |
51.30% |
|
QDA |
71.43% |
69.39% |
70.39% |
|
RF |
71.43% |
69.13% |
70.26% |
|
SVM |
71.43% |
73.57% |
72.48% |
Table 18, 19, 20, 21, 22, and 23 describes the classification performance based on the proposed Delaunay triangulation for facial feature extraction with the most standard classifiers. It shows that proposed Delaunay triangulation features with QA and SVM predict better results for all classes of facial expressions.
Table 18. Confusion matrix of JAFFE database using KNN and Delaunay triangulation
|
|
AN |
CO |
DI |
FE |
HA |
SA |
SU |
|
AN |
66.67 |
16.67 |
0.00 |
0.00 |
0.00 |
0.00 |
16.67 |
|
CO |
0.00 |
50.00 |
33.33 |
16.67 |
0.00 |
0.00 |
0.00 |
|
DI |
0.00 |
16.67 |
83.33 |
0.00 |
0.00 |
0.00 |
0.00 |
|
FE |
0.00 |
0.00 |
0.00 |
66.67 |
0.00 |
33.33 |
0.00 |
|
HA |
0.00 |
0.00 |
16.67 |
0.00 |
83.33 |
0.00 |
0.00 |
|
SA |
0.00 |
50.00 |
16.67 |
0.00 |
0.00 |
0.00 |
33.33 |
|
SU |
0.00 |
0.00 |
0.00 |
0.00 |
0.00 |
0.00 |
100 |
Table 19. Confusion matrix of JAFFE database using NB and Delaunay triangulation
|
|
AN |
CO |
DI |
FE |
HA |
SA |
SU |
|
AN |
50.00 |
16.67 |
0.00 |
33.33 |
0.00 |
0.00 |
0.00 |
|
CO |
0.00 |
50.00 |
0.00 |
50.00 |
0.00 |
0.00 |
0.00 |
|
DI |
0.00 |
50.00 |
50.00 |
0.00 |
0.00 |
0.00 |
0.00 |
|
FE |
0.00 |
33.33 |
0.00 |
66.67 |
0.00 |
0.00 |
0.00 |
|
HA |
0.00 |
16.67 |
0.00 |
0.00 |
83.33 |
0.00 |
0.00 |
|
SA |
16.67 |
50.00 |
0.00 |
0.00 |
0.00 |
0.00 |
33.33 |
|
SU |
50.00 |
0.00 |
0.00 |
0.00 |
0.00 |
0.00 |
50.00 |
Table 20. Confusion matrix of JAFFE database using DT and Delaunay triangulation
|
|
AN |
CO |
DI |
FE |
HA |
SA |
SU |
|
AN |
33.33 |
16.67 |
0.00 |
33.33 |
0.00 |
16.67 |
0.00 |
|
CO |
0.00 |
83.33 |
16.67 |
0.00 |
0.00 |
0.00 |
0.00 |
|
DI |
0.00 |
16.67 |
33.33 |
0.00 |
50.00 |
0.00 |
0.00 |
|
FE |
0.00 |
0.00 |
0.00 |
66.67 |
0.00 |
33.33 |
0.00 |
|
HA |
0.00 |
0.00 |
33.33 |
0.00 |
66.67 |
0.00 |
0.00 |
|
SA |
0.00 |
16.67 |
50.00 |
0.00 |
0.00 |
16.67 |
16.67 |
|
SU |
0.00 |
16.67 |
50.00 |
0.00 |
0.00 |
0.00 |
33.33 |
Table 21. Confusion matrix of JAFFE database using QDA and Delaunay triangulation
|
|
AN |
CO |
DI |
FE |
HA |
SA |
SU |
|
AN |
100 |
0.00 |
0.00 |
0.00 |
0.00 |
0.00 |
0.00 |
|
CO |
0.00 |
83.33 |
0.00 |
0.00 |
0.00 |
0.00 |
16.67 |
|
DI |
0.00 |
0.00 |
66.67 |
0.00 |
16.67 |
16.67 |
0.00 |
|
FE |
0.00 |
0.00 |
0.00 |
100 |
0.00 |
0.00 |
0.00 |
|
HA |
0.00 |
0.00 |
0.00 |
0.00 |
100 |
0.00 |
0.00 |
|
SA |
0.00 |
33.33 |
33.33 |
0.00 |
0.00 |
16.67 |
16.67 |
|
SU |
0.00 |
50.00 |
0.00 |
0.00 |
0.00 |
16.67 |
33.33 |
Table 22. Confusion matrix of JAFFE database using RF and Delaunay triangulation
|
|
AN |
CO |
DI |
FE |
HA |
SA |
SU |
|
AN |
50.0 |
0.00 |
0.00 |
50.00 |
0.00 |
0.00 |
0.00 |
|
CO |
0.00 |
100 |
0.00 |
0.00 |
0.00 |
0.00 |
0.00 |
|
DI |
0.00 |
0.00 |
100 |
0.00 |
0.00 |
0.00 |
0.00 |
|
FE |
0.00 |
0.00 |
0.00 |
83.33 |
0.00 |
16.67 |
0.00 |
|
HA |
0.00 |
0.00 |
0.00 |
0.00 |
100 |
0.00 |
0.00 |
|
SA |
0.00 |
16.67 |
16.67 |
0.00 |
0.00 |
16.67 |
50.00 |
|
SU |
50.00 |
0.00 |
0.00 |
0.00 |
0.00 |
0.00 |
50.00 |
Table 23. Confusion matrix of database of JAFFE Dataset using SVM and Delaunay triangulation
|
|
AN |
CO |
DI |
FE |
HA |
SA |
SU |
|
AN |
66.67 |
0.00 |
0.00 |
33.33 |
0.00 |
0.00 |
0.00 |
|
CO |
0.00 |
100 |
0.00 |
0.00 |
0.00 |
0.00 |
0.00 |
|
DI |
0.00 |
33.33 |
50.00 |
0.00 |
0.00 |
16.67 |
0.00 |
|
FE |
0.00 |
0.00 |
0.00 |
100 |
0.00 |
0.00 |
0.00 |
|
HA |
0.00 |
0.00 |
0.00 |
0.00 |
100 |
0.00 |
0.00 |
|
SA |
0.00 |
66.67 |
0.00 |
0.00 |
0.00 |
16.67 |
16.67 |
|
SU |
0.00 |
0.00 |
33.33 |
0.00 |
0.00 |
0.00 |
66.67 |
5.6.2 Evaluation and comparison regarding similarity measures
Table 24 reports some calculated similarity measures, those of the proposed PSNR are very high and tend to 43 db. Furthermore, Table 24 demonstrates higher PSNR values and lower NAE values of 46.7077 and 0.5714 correlation in QDA based on Delaunay triangulation.
Table 24. Comparison of the similarity measures on the JAFFE database for several classifiers
|
Method |
MSE |
PSNR |
MNCC |
AD |
SC |
MD |
NAE |
|
KNN |
1.673 |
45.89 |
0.642 |
0.612 |
1.63 |
6 |
0.71 |
|
NB |
2.612 |
43.96 |
0.500 |
0.857 |
1.96 |
6 |
1.00 |
|
DT |
2.612 |
43.96 |
0.476 |
0.898 |
2.17 |
5 |
1.04 |
|
QDA |
1.387 |
46.70 |
0.714 |
0.489 |
1.43 |
5 |
0.57 |
|
RF |
1.510 |
46.34 |
0.714 |
0.489 |
1.38 |
5 |
0.57 |
|
SVM |
1.469 |
46.45 |
0.714 |
0.489 |
1.40 |
5 |
0.57 |
5.7 Experiments on mug database
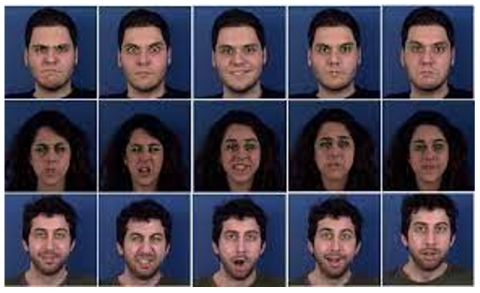
The MUG [30] Facial Expression database contains 86 subjects performing facial expressions. The background was a blue screen. In this dataset participated 86 people, all of Caucasian origin between 20 and 35 years of age, 35 women and 51 men. But only 52 subject images are accessible to authorized users. A total we have 50 to 160 images sequence are available, For each expression. Each image was saved with a jpg format, 896×896 pixels and a size ranging from 240 to 340 KB. we have used 1260 images of the MUG database, 180 images for each facial expression. Figure 9 illustrates samples of MUG database.
Figure 9. Samples of MUG database
5.7.1 Evaluation and comparison regarding accuracy
In Table 25, accuracy, recall and F1-score concerning QSA based Delaunay triangulation are 100%. They are the highest relatively those of other classifiers.
Table 25. Accuracy comparison for different classification approaches on MUG database
|
Classifier |
Accuracy |
Recall |
F1-Score |
|
KNN |
74.13% |
76.43% |
75.26% |
|
NB |
55.98% |
57.73% |
56.84% |
|
DT |
57.53% |
56.75% |
57.14% |
|
QDA |
100% |
100% |
100% |
|
RF |
76.83% |
76.85% |
76.84% |
|
SVM |
74.13% |
76.43% |
75.26% |
Table 26. Confusion matrix of MUG database using and Delaunay triangulation
|
|
AN |
CO |
DI |
FE |
HA |
SA |
SU |
|
AN |
70.27 |
0.00 |
0.00 |
02.70 |
27.03 |
0.00 |
0.00 |
|
CO |
0.00 |
97.30 |
0.00 |
0.00 |
0.00 |
02.70 |
0.00 |
|
DI |
0.00 |
00.00 |
89.19 |
0.00 |
0.00 |
0.00 |
10.81 |
|
FE |
37.84 |
5.41 |
0.00 |
35.14 |
21.62 |
0.00 |
0.00 |
|
HA |
16.22 |
2.70 |
0.00 |
10.81 |
70.27 |
0.00 |
0.00 |
|
SA |
0 |
8.11 |
0.00 |
02.70 |
2.70 |
86.49 |
0.00 |
|
SU |
18.92 |
2.70 |
2.70 |
02.70 |
2.70 |
0.00 |
70.27 |
Tables 26, 27, 28, 29, 30, and 31 are respectively confusion matrix of the MUG database using KNN, NB, DT, QDA, RF and SVM.
Comparing confusing matrix results of the proposed Delaunay triangulation in Tables 26, 27, 28, 29, 30, and 31 illustrates QDA has higher matched values. Although RF demonstrates weaker values in this database.
Table 27. Confusion matrix of MUG database using NB and Delaunay triangulation
|
|
AN |
CO |
DI |
FE |
HA |
SA |
SU |
|
AN |
43.24 |
0.00 |
0.00 |
16.21 |
35.14 |
0.00 |
5.41 |
|
CO |
00.00 |
72.97 |
0.00 |
13.51 |
0.00 |
13.51 |
0.00 |
|
DI |
02.70 |
0.00 |
62.16 |
0.00 |
0.00 |
0.00 |
35.14 |
|
FE |
27.03 |
0.00 |
0.00 |
24.32 |
35.14 |
8.11 |
5.41 |
|
HA |
02.70 |
0.00 |
0.00 |
8.11 |
83.78 |
2.701 |
2.70 |
|
SA |
0.00 |
5.41 |
0.00 |
8.11 |
8.11 |
78.38 |
0.00 |
|
SU |
45.95 |
2.70 |
10.81 |
5.41 |
8.11 |
0.00 |
27.03 |
Table 28. Confusion matrix of CK+ database of KNN and Delaunay triangulation
|
|
AN |
CO |
DI |
FE |
HA |
SA |
SU |
|
AN |
32.43 |
08.11 |
0.00 |
08.11 |
29.73 |
0.00 |
21.62 |
|
CO |
8.11 |
83.78 |
0.00 |
02.70 |
0.00 |
5.41 |
0.00 |
|
DI |
0.00 |
0.00 |
94.59 |
0.00 |
0.00 |
0.00 |
05.41 |
|
FE |
40.54 |
10.81 |
0.00 |
35.14 |
08.11 |
5.41 |
0.00 |
|
HA |
13.51 |
2.70 |
0.00 |
27.03 |
40.54 |
13.51 |
02.70 |
|
SA |
0.00 |
18.92 |
0.00 |
08.11 |
08.11 |
64.86 |
0.00 |
|
SU |
13.51 |
0.00 |
27.03 |
02.70 |
05.41 |
0.00 |
51.35 |
Table 29. Confusion matrix of MUG database using QDA and Delaunay triangulation
|
|
AN |
CO |
DI |
FE |
HA |
SA |
SU |
|
AN |
100 |
0.00 |
0.00 |
0.00 |
0.00 |
0.00 |
0.00 |
|
CO |
0.00 |
100 |
0.00 |
0.00 |
0.00 |
0.00 |
0.00 |
|
DI |
0.00 |
0.00 |
100 |
0.00 |
0.00 |
0.00 |
0.00 |
|
FE |
0.00 |
0.00 |
0.00 |
100 |
0.00 |
0.00 |
0.00 |
|
HA |
0.00 |
0.00 |
0.00 |
0.00 |
100 |
0.00 |
0.00 |
|
SA |
0.00 |
0.00 |
0.00 |
0.00 |
0.00 |
100 |
0.00 |
|
SU |
0.00 |
0.00 |
0.00 |
0.00 |
0.00 |
0.00 |
100 |
Table 30. Confusion matrix of MUG database of KNN and Delaunay triangulation
|
|
AN |
CO |
DI |
FE |
HA |
SA |
SU |
|
AN |
62.16 |
0.00 |
0.00 |
16.22 |
13.51 |
0.00 |
8.11 |
|
CO |
0.00 |
89.19 |
0.00 |
08.11 |
0.00 |
02.70 |
0.00 |
|
DI |
0.00 |
0.00 |
94.60 |
0.00 |
0.00 |
0.00 |
05.41 |
|
FE |
24.32 |
05.41 |
0.00 |
43.24 |
27.03 |
0.00 |
0.00 |
|
HA |
0.00 |
05.41 |
0.00 |
08.11 |
83.78 |
02.70 |
0.00 |
|
SA |
0.00 |
02.70 |
0.00 |
05.41 |
02.70 |
89.19 |
0.00 |
|
SU |
5.41 |
02.70 |
08.10 |
08.11 |
0.00 |
0.00 |
75.68 |
Table 31. Confusion matrix of MUG database of KNN and Delaunay triangulation
|
|
AN |
CO |
DI |
FE |
HA |
SA |
SU |
|
AN |
62.16 |
0.00 |
0.00 |
16.22 |
13.51 |
0.00 |
8.11 |
|
CO |
0.00 |
89.19 |
0.00 |
08.11 |
0.00 |
02.70 |
0.00 |
|
DI |
0.00 |
0.00 |
94.60 |
0.00 |
0.00 |
0.00 |
05.41 |
|
FE |
24.32 |
05.41 |
0.00 |
43.24 |
27.03 |
0.00 |
0.00 |
|
HA |
0.00 |
05.41 |
0.00 |
08.11 |
83.78 |
02.70 |
0.00 |
|
SA |
0.00 |
02.70 |
0.00 |
05.41 |
02.70 |
89.19 |
0.00 |
|
SU |
5.41 |
02.70 |
08.10 |
08.11 |
0.00 |
0.00 |
75.68 |
5.7.2 Evaluation and comparison regarding similarity measures
Table 32 describes the similarity results based on the triangulation feature with six well-known classifiers. It shows that the proposed Delaunay triangulation feature with QDA predicts the better result for all the measures, which is MSE, PSNR, MNCC, AD, SC, and NAE.
Table 32. Comparison of the similarity measures on the MUG database for several classifiers
|
Method |
MSE |
PSNR |
MNCC |
AD |
SC |
MD |
NAE |
|
KNN |
30.20 |
33.33 |
0.7413 |
2.734 |
1.56 |
24 |
0.51 |
|
NB |
69.67 |
29.70 |
0.5598 |
4.653 |
2.10 |
28 |
0.88 |
|
DT |
62.08 |
30.20 |
0.5753 |
4.489 |
2.13 |
25 |
0.84 |
|
QDA |
0.00 |
99.00 |
1.00 |
0.00 |
1.00 |
0.00 |
0.00 |
|
RF |
22.48 |
34.61 |
0.7683 |
2.449 |
1.53 |
21 |
0.46 |
|
SVM |
30.20 |
33.33 |
0.7413 |
2.734 |
1.56 |
24 |
0.51 |
5.8 Discussion
The comparative analysis of six classification approaches used for facial expression recognition reveals the following important points:
(1) Among the six classification approaches, QDA based on the Delaunay triangulation gives the highest accuracy, recall and F1-score for facial expression recognition. However, DT approach gives lowest accuracy. (2) In addition, the QDA based on the Delaunay triangulation shows highest value of similarity between the predicted facial expressions and actual facial expressions with 100% in the CK+ and MUG dataset. (3) Among the six classification approaches, QDA based on the Delaunay triangulation presents the best algorithm for facial expressions recognition with highest PSNR values and lowest error rate.
However, QDA based on the Delaunay triangulation offers the best facial expressions recognition approach with the highest accuracy and recall rates and good similarity measures.
We have presented in this paper a new approach for recognizing the facial expressions as well as the extraction of relevant discriminative facial expression features based on the Delaunay triangulation that makes it imperative to determine expression class. We have exploited six well-known classifiers, K-Nearest Neighbors (KNN), Naive Bayesian Classification (NB), Support Vector Machine (SVM), Decision Tree (DT), Quadratic Discriminant Analysis (QDA) and Random Forest (RF). The key findings of this study are outlined as follows:
(1) One of the main challenges of this work is the correct localization of the different components of face, namely eyes, eyebrows, nose and mouth, to this end; we used the ASM/AAM shape models. Thanks to the proposed approach based on geometric approaches, which used reduced and relevant features vectors compared to existing texture methods to represent the most dominant face information.
(2) The analyzed results show that the facial expressions classified by six machine learning using the proposed approach are effective and efficient. This is due to the distinctive geometric features extracted from facial images.
(3) A relatively high degree of accuracy is obtained by different databases CK+, KDEF, JAFFE and MUG, particularly for the classifier QDA.
(4) The comparison results show that the accuracy of classifier QDA are better than other tested classifiers.
(5) The classifier QDA p the best results in most faces databases, while its accuracy in CK+ and MUG datasets is high.
To sum up, QDA demonstrates marked results in all experiments regarding the accuracy, recall, F1-score, and PSNR, particularly based on four face databases. In future work, we will apply the proposed approach to recognize facial expressions and facial micro-expressions in real-time. In addition, we will investigate Deep Learning (DL) approaches for multi-scale classification of facial images.
[1] Mehrabian, A. Ferris, S.R. (1967). Inference of attitudes from nonverbal communication in two channels. Journal of Consulting Psychology, 31(3): 248-252. https://doi.org/10.1037/h0024648
[2] Ekman, P. (2004). Book reviews: Emotions revealed. Bmj, 328: Suppl S5. https://doi.org/10.1136/sbmj.0405184
[3] Ekman, P., Friesen, W.V. (1971). Constants across cultures in the face and emotion. Journal of Personality and Social Psychology, 17(2): 124-129. https://doi.org/10.1037/h0030377
[4] Ekman, P. (1992). An argument for basic emotions. Cognition & Emotion, 6(3-4): 169-200. https://doi.org/10.1080/02699939208411068
[5] Tian, Y.I., Kanade, T., Cohn, J.F. (2001). Recognizing action units for facial expression analysis. IEEE Transactions on Pattern Analysis and Machine Intelligence, 23(2): 97-115. https://doi.org/10.1109/34.908962
[6] Michel, P., El Kaliouby, R. (2003). Real-time facial expression recognition in video using support vector machines. In Proceedings of the 5th International Conference on Multimodal Interfaces, pp. 258-264. https://doi.org/10.1145/958432.958479
[7] Chuang, C.F., Shih, F.Y. (2006). Recognizing facial action units using independent component analysis and support vector machine. Pattern Recognition, 39(9): 1795-1798. https://doi.org/10.1016/j.patcog.2006.03.017
[8] Tang, Y., Zhang, X.M., Wang, H. (2018). Geometric-convolutional feature fusion based on learning propagation for facial expression recognition. IEEE Access, 6: 42532-42540. https://doi.org/10.1109/ACCESS.2018.2858278
[9] Liang, L., Lang, C., Li, Y., Feng, S. Zhao, J. (2021). Fine-grained facial expression recognition in the wild. IEEE Transactions on Information Forensics and Security, 16: 482-494. https://doi.org/10.1109/TIFS.2020.3007327
[10] Zhang, F., Zhang, T., Mao, Q., Xu, C. (2020). Geometry-guided pose-invariant facial expression recognition. IEEE Transactions on Image Processing, 29: 4445-4460. https://doi.org/10.1109/TIP.2020.2972114
[11] Mandal, M., Verma, M., Mathur, S., Vipparthi, S.K. Murala, S., Kranthi Kumar, D. (2019). Regional adaptive affinitive patterns (RADAP) with logical operators for facial expression recognition. IET Image Processing, 13(5): 850-861. https://doi.org/10.1049/iet-ipr.2018.5683
[12] Supta, S.R., Sahriar, M.R., Rashed, M.G., Das, D., Yasmin, R. (2020). An effective facial expression recognition system. In 2020 IEEE International Women in Engineering (WIE) Conference on Electrical and Computer Engineering, pp. 66-69. https://doi.org/10.1109/WIECON-ECE52138.2020.939
[13] Barman, A., Dutta, P. (2019). Facial expression recognition using distance and texture signature relevant features. Applied Soft Computing, 77: 88-105. https://doi.org/10.1016/j.asoc.2019.01.011
[14] Barman, A., Dutta, P. (2019). Influence of shape and texture features on facial expression recognition. IET Image Processing, 13(8): 1349-1363. https://doi.org/10.1049/iet-ipr.2018.5481
[15] Golzadeh, H., Faria, D.R., Manso, L.J., Ekárt, A., Buckingham, C.D. (2018). Emotion recognition using spatiotemporal features from facial expression landmarks. IEEE Conference on Intelligent Systems, 2018): 789-794. https://doi.org/10.1109/IS.2018.8710573
[16] Avishek, N., Paramartha, D., Nasir, M. (2020), Recognizing human emotions from facial images by landmark triangulation: A combined circumcenter-incenter-centroid trio feature-based method. In: Mandal J., Mukhopadhyay S., Dutta P., Dasgupta K. (eds) Algorithms in Machine Learning Paradigms. Studies in Computational Intelligence, vol 870. Springer, Singapore. https://doi.org/10.1007/978-981-15-1041-0_9
[17] Nasir, M., Paramartha, D. (2020). Tracking changing human emotions from facial image sequence by landmark triangulation: An incircle-circumcircle duo approach. In: Mandal J., Mukhopadhyay S., Dutta P., Dasgupta K. (eds) Algorithms in Machine Learning Paradigms. Studies in Computational Intelligence, vol 870. Springer, Singapore. https://doi.org/10.1007/978-981-15-1041-0_8
[18] Viola, P., Jones, M. (2001). Robust real-time object detection. International Journal of Computer Vision, 4(34-47): 4.
[19] Frey, B.J., Kannan, A., Jojic, N. (2001). Product analysis: Learning to model observations as products of hidden variables. In NIPS, pp. 729-735.
[20] Ross, A. (2004). Procrustes analysis. Course report, Department of Computer Science and Engineering, University of South Carolina, 26. http://www.cse.sc.edu.
[21] Pedriag, C., Delany S.J. (2021). K-nearest neighbour classifiers-A tutorial. ACM Computing Surveys, 54(128): 1-25. https://doi.org/10.1145/3459665
[22] Berrar, D. (2019). Bayes’ theorem and naive bayes classifier. Encyclopedia of Bioinformatics and Computational Biology, 1: 403-412. https://doi.org/10.1016/B978-0-12-809633-8.20473-1
[23] Zhou, Z.H. (2021). Support vector machine. Machine Learning, Singapore, pp. 129-153.
[24] Naylor, M. (2020). Decision tree. Mathematics Teacher: Learning and Teaching, 113(7): 612-612. https://doi.org/10.5951/MTLT.2020.0081
[25] Ghosh, A., SahaRay, R., Chakrabarty, S., Bhadra, S. (2021). Robust generalised quadratic discriminant analysis. Pattern Recognition, 117: 107981. https://doi.org/ 10.1016/j.patcog.2021.107981
[26] Arora, A., Lin, T.S., Rebello, N.J., Av-Ron, S.H., Mochigase, H., Olsen, B.D. (2021). Random forest predictor for diblock copolymer phase behavior. ACS Macro Letters, 10(11): 1339-1345. https://doi.org/10.1021/acsmacrolett.1c00521
[27] Lucey, P., Cohn, J.F., Kanade, T., Saragih, J., Ambadar, Z., Matthews, I. (2010). The extended Cohn-Kanade dataset (ck+): A complete dataset for action unit and emotion-specified expression. In 2010 IEEE Computer Society Conference on Computer Vision and Pattern Recognition-Workshops, pp. 94-101. https://doi.org/10.1109/CVPRW.2010.5543262
[28] Lyons, M., Akamatsu, S., Kamachi, M., Gyoba, J. (1998) Coding facial expressions with Gabor wavelets. In 3rd IEEE International Conference on Automatic Face and Gesture Recognition, pp. 200-205. https://doi.org/10.1109/AFGR.1998.670949
[29] Goeleven, E., De Raedt, R., Leyman, L., Verschuere, B. (2008). The Karolinska directed emotional faces: A validation study. Cognition and Emotion, 22(6): 1094-1118. https://doi.org/10.1109/AFGR.1998.670949
[30] Aifanti, N., Papachristou, C., Delopoulos, A. (2010). The MUG facial expression database. In 11th IEEE International Workshop on Image Analysis for Multimedia Interactive Services WIAMIS 10, pp. 1-4. https://doi.org/10.1109/AFGR.1998.670949
[31] Dlib Corporation. DLIB – prediction model, https://github.com/davisking/dlib-models /, accessed on June. 17, 2021.
[32] Eskicioglu, A.M., Fisher, P.S. (1995). Image quality measures and their performance. IEEE Transactions on Communications, 43(12): 2959-2965. https://doi.org/10.1109/26.477498