Wei Huang
© 2021 IIETA. This article is published by IIETA and is licensed under the CC BY 4.0 license (http://creativecommons.org/licenses/by/4.0/).
OPEN ACCESS
Depression leads to a high suicide rate and a high death rate. But the disease can be cured if recognized in time. At present, there are only a few low-precision methods for recognizing mental health or mental disorder. Therefore, this paper attempts to recognize elderly depression by extracting facial micro-expressions. Firstly, a micro-expression recognition model was constructed for elderly depression recognition. Then, a jump connection structure and a feature fusion module were introduced to VGG-16 model, realizing the extraction and classification of micro-expression features. After that, a quantitative evaluation approach was proposed for micro-expressions based on the features of action units, which improves the recognition accuracy of elderly depression expressions. Finally, the advanced features related to the dynamic change rate of depression micro-expressions were constructed, and subjected to empirical modal decomposition (EMD) and Hilbert analysis. The effectiveness of our algorithm was proved through experiments.
micro-expression, expression feature extraction, elderly depression recognition, deep learning (DL)
The growing social pressure has increased the proportion of depression patients, especially among the elderly [1-4]. Depression leads to a high suicide rate and a high death rate. But the disease can be cured if recognized in time [5-9]. Therefore, it is especially important to build an objective and effective depression recognition system. Depression patients differ significantly from normal people in emotional experience or emotional state. The huge difference is manifested in their facial expressions [10-13]. The micro-expressions, which characterize the real emotional changes of depression patients, have the following features: the duration is short, centralized samples are few, and recognition is inaccurate. To identify depression accurately, it is of paramount importance to design an effective micro-expression recognition network.
At present, micro-expressions are mainly recognized through deep learning (DL). However, DL networks often involve many parameters, and require lots of samples to ensure recognition accuracy. Based on time-frequency analysis and convolutional neural network (CNN), Liu et al. [14] proposed a dual-mode voice-video fusion model, and verified the effectiveness of the model through cross validation, using the voice and video dataset of 292 participants. Othmani et al. [15] designed a new structure of deep neural network, which recognizes emotions and depression from voices by learning from the time-frequency representation of audio signals and the visual representation of the frequency spectrum. He et al. [16] developed an integrated framework for depression identification, and adopted attention-based CNN and weighted spatial pyramid pooling (SPP) to learn deep and global representations. Chen et al. [17] provided a sequence fusion method for facial recognition of depression, and introduced chain fusion mechanism to learn facial appearance and dynamics under a unified framework. Xu et al. [18] created an intelligent human-computer interaction (HCI) system for depression recognition, in which an audio-depression regression model determines the prevalence rate of depression based on CNN and long short-term memory (LSTM) network, and put forward a differential regression features extraction algorithm for multiscale audios to describe the features of non-personalized audios. Akbari et al. [19] proposed a novel depression detection approach based on reconstructed phase space (RPS) and geometric features of electroencephalogram (EEG) signals, plotted the RPS maps of the EEG signals of 22 normal people and 22 depression patients in two-dimensional (2D) space, and extracted 34 geometric features according to the map shapes. It was learned that, compared with the RPS of depression patients’ EEG signals, the RPS of normal people’s EEG signals has a high regularity, limited changes, and predictable shapes. Rejaibi et al. [20] evaluated EEG features through machine learning and statistical analysis, and drew a conclusion by analyzing the optimal feature set: the top of occipital lobe in high-frequency band has a great impact on depression recognition.
At present, there are many feature extraction algorithms for image processing. However, none of them can effectively recognize mental health or mental disorder. The key of accurate depression recognition lies in extracting more effective micro-expression features. Therefore, this paper attempts to recognize elderly depression by extracting facial micro-expressions. The main contents are as follows: (1) building a micro-expression recognition model for elderly depression recognition; (2) constructing a neural network with a jump connection structure and a feature fusion module, which realizes the extraction and classification of micro-expression features; (3) proposing a quantitative evaluation approach for micro-expressions based on the features of action units, which improves the recognition accuracy of elderly depression expressions; (4) creating the advanced features related to the dynamic change rate of depression micro-expressions, and performing empirical modal decomposition (EMD) and Hilbert analysis of these features. The proposed algorithm was proved effective through experiments.
Figure 1. Structure of micro-expression recognition model
With the development of artificial intelligence (AI), the CNN enjoys an unparalleled advantage in image classification and recognition. This paper constructs a micro-expression recognition network (Figure 1) to fully utilize different layers of the CNN to extract image features. The network processes the micro-expression video sequence into an optical flow image, which reflects the changes in facial micro-expressions, and imports the image into the network embedded with jump connection and feature fusion module, thereby realizing the extraction and classification of micro-expression features. The working principles of each part of the model are detailed as follows.
2.1 Image preprocessing
Optical flow calculation needs two basic assumptions: the brightness is constant, and the object motion is continuous. To extract facial micro-expression features of the elderly in a video sequence, the first step is to gray the initial frame. Let (a, b) be the position of pixel l in the initial frame of the video; HD(a, b, h) be the gray value of the pixel; Δa and Δb be the moving distances of pixel l in directions A and B over a period Δh, respectively. Since the brightness is constant, HD(a, b, h) satisfies:
$HD\left( a+\Delta a,b+\Delta b,h+\Delta h \right)=HD\left( a,b,h \right)$ (1)
Suppose σ is an infinitely small parameter, which can be neglected. Since the object motion is continuous, the left side of formula (1) can undergo first-order Taylor expansion:
$\begin{align}& HD\left( a,b,h \right)+\frac{\partial HD}{\partial a}\Delta a \\ & +\frac{\partial HD}{\partial b}\Delta b+\frac{\partial HD}{\partial h}\Delta h+\sigma =HD\left( a,b,h \right) \\\end{align}$ (2)
Suppose a pixel changes by s and t along axes A and B, respectively. Formula (2) can be simplified as:
$\frac{\partial G}{\partial x}u+\frac{\partial G}{\partial y}v+\frac{\partial G}{\partial t}=0$$\frac{\partial HD}{\partial a}s+\frac{\partial HD}{\partial b}t+\frac{\partial HD}{\partial h}=0$ (3)
Then, the optical flow sl can be expressed as:
${{s}_{l}}=\left[ s=\frac{\Delta a}{\Delta h},t=\frac{\Delta b}{\Delta h} \right]$ (4)
Further, the optical flow of pixel l can be calculated by:
$OF{{I}_{l}}=\sqrt{{{s}^{2}}+{{t}^{2}}}$ (5)
The regularized direction of pixel l can be calculated by:
${{\alpha }_{l}}=\frac{1}{\pi }arctan\frac{t}{s}$ (6)
Based on the acquired optical flow data, an optical flow image can be generated. In the optical flow image, the value of pixel l at (a, b) of channel d can be expressed as:
$\left\{ \begin{matrix} FI\left( a,b,d \right)=CS\left( \alpha _{l}^{*},OFI_{l}^{*},d \right) \\ \alpha _{l}^{*}=\frac{{{\alpha }_{l}}+1}{2}\times \left( {{N}_{C}}-1 \right)+1 \\ OFI_{l}^{*}=\frac{OF{{I}_{l}}}{\underset{1\le j\le {{N}_{P}}}{\mathop{\max OF{{I}_{j}}}}\,} \\\end{matrix} \right.$ (7)
where, CS is the color system; NC is the number of colors; NP is the total number of pixels in the image.
The moving direction and change amplitude of the elderly’s facial micro-expressions are respectively described by the color and its depth of the optical flow image. In other words, the elderly’s facial micro-expressions appear in the region with the most significant change changes, among the start and vertex frames of different micro-expressions, as well as the optical flow image generated from these frames.
2.2 Network structure
Micro-expressions change rapidly with a small amplitude, and move in a small range. To recognize micro-expressions, it is difficult for the proposed model to train effective features. VGG-16 is a superior model for image classification (Figure 2). But this deep network might lose some image features through repeated convolutions and pooling operations. To solve the problem, the jump connection structure was introduced to VGG-16, and feature fusion was performed on the outputs of convolution blocks 3-5. The fused result was imported to a fully-connected layer to recognize the micro-expressions of the depressed elderly.
Let A, B, and C be the feature maps obtained through scale unification of the outputs of convolution blocks 3, 4, and 5, respectively; ⨁ be the addition of the eigenvalues of the corresponding channels. Then, the fused result of A, B, and C can be expressed as:
$S=A\oplus B\oplus C$ (8)
The above feature map fusion effectively increases the feature information in each channel, without changing the number of parameters. Then, the fused result was transmitted to the fully-connected layer for feature mapping. To reduce the risk of overfitting, the number of nodes on the fully-connected layer was reduced. Let ri be the output of node i in fully-connected layer; D be the number of nodes. This paper classifies the elderly’s depression micro-expression features based on softmax activation function:
$U\left( {{r}_{i}} \right)=\frac{{{e}^{{{r}_{i}}}}}{\sum\nolimits_{d=1}^{D}{{{e}^{{{r}_{d}}}}}}$ (9)
The cross-entropy function was adopted as the loss function to enable the fast convergence of the network during the training. Let bl be the predicted result of sample l outputted by the network; bl* be the actual label of the input data. Then, the loss function can be expressed as:
$LOSS=-\sum\nolimits_{l=1}^{M}{b_{l}^{*}ln\left( {{b}_{l}} \right)}$ (10)
Figure 2. Structure of VGG-16
2.3 Structure of feature fusion module
In the proposed neural network, different convolution blocks can extract the details about the various changing features of the optical flow image. The feature information extracted by low-level convolution blocks might get lost as the network layer deepens.
Therefore, this paper designs a feature fusion module, capable of capturing micro-expression features with different amplitudes based on the fusion of features on different layers. Figure 3 explains the flow of feature fusion module. Let aik be the activation layer after the calculation of the i-th channel on layer k of the network. The activated feature map of that layer can be expressed as:
${{A}^{k}}=\left\{ a_{i}^{k} \right\}_{i=k}^{d}$ (11)
The fifth layer was fused with the second, third, and fourth layers, separately, such that the model can effectively utilize the feature information extracted from different network layers, in the presence of detail losses. Before fusion, the feature maps from different layers were dimensionally unified. Let d be the number of channels of the input feature map, and d' be that of the output feature map after convolution. After linear transformation by a l×l convolution kernel, the feature map can be expressed as:
${{A}^{k}}=\left\{ a_{j}^{k'}|a_{j}^{k'}=\sum\nolimits_{i=1}^{d}{a_{i}^{k}\times {{\omega }_{i,j}}+{{\varepsilon }_{j}},j=1,...,d'} \right\}_{i=k}^{d}$ (12)
Next, the convolution outputs of feature map Ak on layer k and feature map A5 on layer 5 were processed to obtain the fused feature:
${{A}^{n}}={{A}^{k'}}\oplus {{A}^{5'}},{{A}^{n}}\in {{\Re }^{{{X}_{5}}\times {{Y}_{5}}\times {{Z}_{5}}}}$ (13)
To reduce the probability of over-fitting, ReLU function was introduced to selectively activate the features: χ(ad, on)=max(0, ad, on). The resulting features can be expressed as:
${{\tilde{A}}^{n}}=\left\{ \tilde{a}_{i}^{n} \right\}_{i=k}^{{{Z}_{5}}}$ (14)
Then, the activated features were dimensionally reduced on the max pooling layer. The extracted more salient features can be described as:
${{\psi }^{n}}\in {{\Re }^{{{X}_{n}}\times {{Y}_{n}}\times {{Z}_{n}}}}$ (15)
To effectively improve the feature fitting ability of the feature fusion module, the subsequent fully-connected layer adopts softmax as the activation function, in order to further recognize the emotional labels of micro-expressions of the depressed elderly. Let FC(ψn) be the results of the fully-connected layer; Q be the weight vector of learning; NM be the number of classes of micro-expressions in the sample set; yjmbjn be the prediction results on class j. Then, we have:
$b_{j}^{n}=\frac{{{e}^{{{Q}_{j}}\cdot FC\left( {{\psi }^{n}} \right)}}}{\sum\nolimits_{l=1}^{{{N}_{M}}}{{{e}^{{{Q}_{l}}\cdot FC\left( {{\psi }^{n}} \right)}}}}$ (16)
To further improve the recognition performance of our network, two methods were selected to fuse the predicted results of feature fusion module and the backbone network. The final predicted result b can be defined as the mean of the backbone network output bt and the output bF of F feature fusion modules:
$b=\frac{1}{F+1}C,C={{b}^{{{F}_{1}}}}\oplus {{b}^{{{F}_{2}}}}\oplus {{b}^{{{F}_{3}}}}\oplus {{b}^{{{F}_{t}}}}$ (17)
The final predicted result b can also be defined as the result of softmax normalization of C. Let j be the class label of micro-expressions in the sample set. The predicted results of class j can be expressed as:
${{b}_{j}}=\frac{{{e}^{{{C}_{j}}}}}{\sum\nolimits_{l=1}^{{{N}_{M}}}{{{e}^{{{C}_{l}}}}}}$ (18)
Figure 3. Flow of feature fusion module
The facial coding system can divide the human face into various action units in the light of facial muscles. The action units correspond with facial micro-expressions, and their features could be used to recognize the basic emotions of the elderly. To improve the recognition accuracy of the elderly’s depression expressions, this paper proposes a quantitative evaluation method for micro-expressions based on action unit features.
The L-2 norm of multiple action unit features was calculated, i.e., the Euclidean distance between these features. To prevent the number of action units from affecting the result of quantitative evaluation, this paper divides the L-2 norm with the root of the number of action units. Based on action unit features, the micro-expressions can be quantified by:
$QA=\frac{\left| {{\delta }'} \right|}{\sqrt{n}}=\frac{\sqrt{{{\left( {{\delta }_{1}} \right)}^{2}}+{{\left( {{\delta }_{2}} \right)}^{2}}+...+{{\left( {{\delta }_{n}} \right)}^{2}}}}{\sqrt{n}}$ (19)
Let |δ| be the L-2 norm about the amplitude of action units for depression micro-expressions; n be the total number of relevant action units. Among the expression collected by Kinect, the positive expressions correspond to action units δ1, δ6, and δ7; negative expressions correspond to action units δ8, δ9, δ14, and δ15; non-expression covers all action units. Figure 4 shows the action units related to some Kinect expressions. This paper computes the action unit values of primary and secondary facial expressions in video frames. To identify the primary facial expression in each frame, it is necessary to minimize the effect of secondary expressions. The action unit value of a positive expression can be calculated by:
$PE=\frac{\sqrt{{{\left( {{\delta }_{1}} \right)}^{2}}+{{\left( {{\delta }_{6}} \right)}^{2}}+{{\left( {{\delta }_{7}} \right)}^{2}}}}{\sqrt{3}}$ (20)
The action unit value of a negative expression can be calculated by:
$NE=\frac{\sqrt{{{\left( {{\delta }_{8}} \right)}^{2}}+{{\left( {{\delta }_{9}} \right)}^{2}}+{{\left( {{\delta }_{14}} \right)}^{2}}+{{\left( {{\delta }_{15}} \right)}^{2}}}}{2}$ (21)
The action unit value of non-expression can be calculated by:
$EX=\frac{\sqrt{{{\left( {{\delta }_{1}} \right)}^{2}}+{{\left( {{\delta }_{2}} \right)}^{2}}+...+{{\left( {{\delta }_{16}} \right)}^{2}}+{{\left( {{\delta }_{17}} \right)}^{2}}}}{\sqrt{17}}$ (22)
According to empirical conditions, this paper sets a threshold λ for different facial micro-expressions. The actual class label RL of an expression can be expressed as:
$R L=\left\{\begin{array}{l}
\text { if } \quad \mathrm{EX}<\lambda, R L \in E X \\
\text { elseif } \begin{cases}\text { if } & P E>N E, R L \in P E \\
\text { if } & N E>P E, R L \in N E\end{cases}
\end{array}\right.$ (23)
According to formula (23), the first step is to judge whether the facial expression in a frame is non-expression. Only when the value of non-expression is smaller than the preset threshold, non-expression is the primary expression of the frame. In other cases, when the value of positive expression is greater than that of negative expression, positive expression is the primary expression of the frame; when the value of negative expression is greater than that of positive expression, negative expression is the primary expression of the frame.
Figure 4. Action units related to Kinect expressions
The elderly’s depression behaviors can be measured by the dynamic variation rate of their negative expressions. This paper solves the mean gradient of the amplitude-time sequence corresponding to each action unit speed. Let g be the instantaneous gradient of the amplitude-time sequence of the action unit; a and b be time coordinate and amplitude coordinate, respectively. Then, we have:
$g=\frac{\Delta b}{\Delta a}=\frac{{{b}_{2}}-{{b}_{1}}}{{{a}_{2}}-{{a}_{1}}}$ (24)
Let τ be the length of the video sequence. Then, the mean gradient gAV of the amplitude-time sequence can be calculated by:
${{g}_{AV}}=\frac{\sum\limits_{i=1}^{i}{{{l}_{i}}}}{\tau }=\frac{{{l}_{1}}+{{l}_{2}}+...+{{l}_{\tau }}}{\tau }$ (25)
Let |p'| be the L2 norm of the eigenvalues of multiple action units; p be the eigenvalues of relevant action units. The eigenvalues of different action units can be fused by:
$FFU=\frac{\left| {{p}'} \right|}{\sqrt{m}}=\frac{\sqrt{{{\left( {{p}_{1}} \right)}^{2}}+{{\left( {{p}_{2}} \right)}^{2}}+...+{{\left( {{p}_{n}} \right)}^{2}}}}{\sqrt{m}}$ (26)
where, FFU is the eigenvalue obtained through comprehensive analysis of different action units. It can be used to characterize the dynamic change rate of micro-expressions.
The key to recognizing elderly depression is to extract effective features from the original video sequence. Let there be a video sequence for the extraction of facial micro-expressions of the elderly. In most of the periods of the video, the depressed do differ significantly in expression difference from normal people; the difference in the corresponding action unit values is also very small. Hence, this paper treats the maximum points extracted from action unit features as secondary features, and then compiles advanced features associated with the dynamic change rate of depression micro-expressions.
In the amplitude-time signals of action units, the maximum points are not uniformly distributed along the amplitude axis or along the time axis. Firstly, the sequence i of extreme points was established, and τ was defined as the difference between adjacent maximum points on the time axis:
${{\tau }_{i}}={{a}_{i+1}}-{{a}_{i}}$ (27)
In addition, ξ was defined as the amplitude difference between adjacent maximum points:
${{\xi }_{i}}={{b}_{i+1}}-{{b}_{i}}$ (28)
Finally, the ratio γ of |ξ| to τ was calculated to characterize the process for the elderly’s facial action units in a period to change from one extreme of the corresponding maximum points to the other extreme:
${{\gamma }_{i}}=\frac{\left| {{\xi }_{i}} \right|}{{{\tau }_{i}}}$ (29)
Further, the gradient sequence was obtained as Φ={γ1, γ2, ..., γi}. The mean gradient cmean of action units can be expressed as:
$AG=\frac{\sum\limits_{i}{{{\gamma }_{i}}}}{i}=\frac{{{\gamma }_{1}}+{{\gamma }_{2}}+...+{{\gamma }_{i}}}{i}$ (30)
This paper carries out EMD and Hilbert analysis on signals, aiming to further parse the features of action units’ amplitude-time signals in the frequency domain.
EMD can decompose the action units’ amplitude-time signals into several empirical modal functions. The number of empirical modal functions varies with signals. Next, each empirical modal function undergoes Hilbert transform to obtain the corresponding Hilbert spectrum. Based on the spectrum, the sub band energy and central frequency of each empirical modal function can be calculated. Observations show that each function has a unique energy ratio. To ensure the accuracy of experiments, this paper fully considers the problem of energy ratio, and combines the energy and frequency of each empirical modal function into the formula of frequency characteristic index.
Let i be the serial number of empirical modal function; NFC be the total number of empirical modal functions; FCP-I be the mean power of action units’ amplitude-time signal of function i. Then, the energy ratio ηi of function i can be calculated by:
${{\eta }_{i}}=\frac{F{{C}_{P-i}}}{\sum\limits_{i=1}^{{{N}_{FC}}}{F{{C}_{P-i}}}}=\frac{F{{C}_{P-i}}}{F{{C}_{P-1}}+F{{C}_{P-2}}+...+F{{C}_{P-{{N}_{FC}}}}}$ (31)
Let FCF-i be the mean power of action units’ amplitude-time signal of function i. The frequency characteristic index of action units’ amplitude-time signal can be obtained by multiplying the energy ratio ηi of each function with FCF-i:
$\begin{align}& \varphi =\sum\limits_{i}^{{{N}_{FC}}}{{{\eta }_{i}}\times F{{C}_{F-i}}}={{\eta }_{1}}\times F{{C}_{F-1}} \\ & +{{\eta }_{2}}\times F{{C}_{F-2}}+...+{{\eta }_{{{N}_{FC}}}}\times F{{C}_{F-{{N}_{FC}}}} \\\end{align}$ (32)
Table 1 lists the parameter setting of the backbone network of our model. The micro-expression features, which are used to generate the optical flow image, were obtained through the five convolutional layers in the network. The max pooling mainly reduces the dimension of features, and minimize the impact of redundant information on model training. The fully-connected layers fuse the output of the previous layer. Compared with VGG-16, our model has eight fewer convolutional layers, and fewer parameters.
To disclose how the number of feature fusion modules on the micro-expression recognition effect of our model, the dataset and the number of modules were adjusted, without changing the structure of the other components in the network. The model performance was evaluated by metrics like weightless F1-score and mean recall. Four datasets were used, including SMIC dataset 1, VAM corpus dataset 2, SFEW dataset 3, and CASEME II dataset 4. Figure 5 presents the influence of the number of feature fusion modules on model performance on different datasets. On different datasets, the two metrics of our model increased in different degrees, with the growing number of feature fusion modules. The optimal model performance was achieved, when there were 3 feature fusion modules.
To further extract the changing features of specific facial expressions of the depressed elderly, the proposed micro-expression quantification algorithm, which is driven by action unit features, was adopted to compute the time-frequency ratio and dynamic change rate of micro-expressions in the collected experimental data. Firstly, the facial micro-expressions in the video frames were divided, and given class labels. The emotional degree characterized by facial micro-expressions was divided into four levels: I, II, III, and IV. To ensure the thoroughness and completeness of the recognition results, this paper performs data analysis on the emotional degrees of different genders and on different levels. Tables 2 and 3 present the time-frequency and ratio of micro-expressions in the entire video under different genders and different levels, respectively. To compare the difference between normal and depressed elderlies, this paper also carries out a t-test on the standard deviation of the time-frequency of the elderly’s micro-expressions (Tables 4 and 5).
Table 1. Parameters of the backbone network of our model
|
Type |
Convolution window |
Convolution step length |
Output |
|
Input |
/ |
/ |
225×225×5 |
|
Convolution 1 |
12×12 |
5 |
48×48×35 |
|
Max pooling 1 |
4×4 |
3 |
22×22×35 |
|
Convolution 2 |
6×6 |
2 |
22×22×56 |
|
Max pooling 2 |
4×4 |
3 |
11×11×56 |
|
Convolution 3 |
4×4 |
1 |
11×11×56 |
|
Convolution 4 |
4×4 |
1 |
11×11×56 |
|
Convolution 5 |
4×4 |
2 |
11×11×56 |
|
Max pooling 3 |
4×4 |
1 |
5×5×128 |
|
Fully-connected layer 1 |
/ |
/ |
256×1 |
|
Fully-connected layer 2 |
/ |
/ |
256×1 |
|
Fully-connected layer 3 |
/ |
/ |
3×1 |
(a) Weightless F1-score
(b) Weightless mean recall
Figure 5. Influence of the number of feature fusion modules on model performance on different datasets
Table 2. Time-frequency of micro-expressions under different genders (male)
|
Type of expressions |
Positive |
Negative |
||||
|
Group |
Normal |
Depressed |
p-value |
Normal |
Depressed |
p-value |
|
Ⅰ |
1023(45%) |
926(36%) |
0.0363 |
482(45%) |
586(27%) |
0.2326 |
|
Ⅱ |
863(34%) |
835(31%) |
0.4523 |
921(41%) |
763(35%) |
0.3154 |
|
Ⅲ |
514(26%) |
651(28%) |
0.2672 |
976(48%) |
1157(46%) |
0.0471 |
|
Ⅳ |
439(18%) |
452(19%) |
0.2146 |
892(53%) |
891(35%) |
0.0532 |
Table 3. Time-frequency of micro-expressions under different genders (female)
|
Type of expressions |
Positive |
Negative |
||||
|
Group |
Normal |
Depressed |
Group |
Normal |
Depressed |
Group |
|
Ⅰ |
1085(53%) |
908(38%) |
0.0923 |
482(21%) |
593(25%) |
0.2356 |
|
Ⅱ |
851(37%) |
852(32%) |
0.8676 |
946(35%) |
771(37%) |
0.3108 |
|
Ⅲ |
471(23%) |
675(24%) |
0.5372 |
992(42%) |
1023(45%) |
0.0435 |
|
Ⅳ |
376(15%) |
467(18%) |
0.6125 |
1023(37%) |
1072(48%) |
0.2763 |
It can be learned that the elderly has individual differences in the time-frequency of micro-expressions. The differences arise from various factors: gender, living environment, physical health, and family. Overall, the standard deviation was rather small for the time-frequency of the elderly’s micro-expressions. This means the depressed elderly has a smaller individual difference than normal people, owing to the damages of emotional feedback function and decline of feedback ability.
For convenience, Figures 6 and 7 provide the bar charts of the above data. The following conclusions can be drawn from the research assumptions and analysis results.
Table 4. Standard deviation of time-frequency of micro-expressions under different types of expressions (male)
|
Type of expressions |
Positive |
Non-expression |
Negative |
|||
|
Group |
Normal |
Depressed |
Group |
Normal |
Depressed |
Group |
|
Ⅰ |
206.73 |
185.76 |
304.34 |
275.32 |
168.25 |
254.89 |
|
Ⅱ |
97.26 |
126.34 |
225.67 |
176.75 |
85.76 |
86.75 |
|
Ⅲ |
241.35 |
108.25 |
281.75 |
113.54 |
135.64 |
254.61 |
|
Ⅳ |
189.23 |
104.17 |
276.53 |
108.26 |
124.12 |
189.57 |
Table 5. Standard deviation of time-frequency of micro-expressions under different types of expressions (female)
|
Type of expressions |
Positive |
Non-expression |
Negative |
|||
|
Group |
Normal |
Depressed |
Group |
Normal |
Depressed |
Group |
|
Ⅰ |
185.34 |
251.08 |
285.34 |
167.54 |
112.75 |
103.45 |
|
Ⅱ |
315.26 |
161.54 |
272.96 |
235.79 |
465.38 |
231.76 |
|
Ⅲ |
197.48 |
116.47 |
319.63 |
262.36 |
89.46 |
165.82 |
|
Ⅳ |
147.59 |
135.29 |
294.75 |
274.98 |
85.23 |
124.64 |
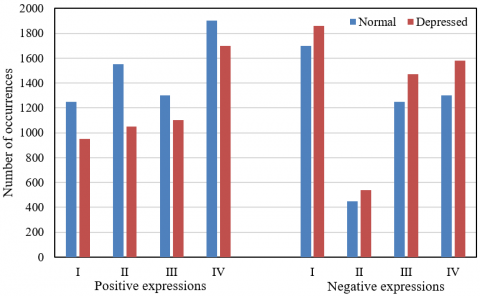
Figure 6. Time-frequency of micro-expressions for different types of expressions (male)
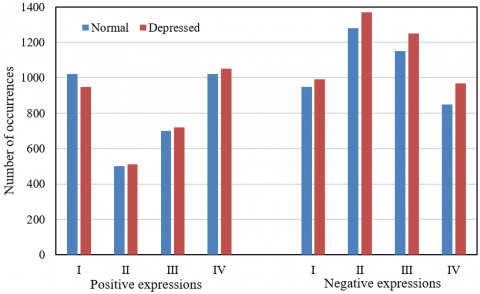
Figure 7. Time-frequency of micro-expressions for different types of expressions (female)
The positive emotional feedback from the depressed elderly was weakened, and the corresponding positive expressions appeared less frequently. It can be learned from Figures 6 and 7 that, whether male or female, the depressed elderly has a lower time-frequency of positive expressions than normal people. This is because the depressed elderly is weak in perceiving the surroundings, and not good at generate positive emotions and get positive emotional feedbacks. That is why they have much less frequency positive expressions than normal people. Meanwhile, the depressed elderly faces an enhanced feedback mechanism of negative emotions, resulting in more frequent negative micro-expressions.
Due to the loss of emotional cognition function, the depressed elderly made much fewer calm expression than normal people. The significance test shows that, whether male or female, the depressed elderly differed significantly from the normal people in the occurrences of positive and negative expressions at any level. This verifies the assumption that the depressed elderly becomes weaker in positive emotional feedback, and stronger in negative emotional feedback.
This paper explores the recognition of elderly depression based on facial micro-expression extraction. Specifically, the micro-expression features were extracted and classified by introducing a jump connection structure and a feature fusion module to VGG-16 model. Besides, a quantitative evaluation approach was proposed for micro-expressions based on the features of action units, which improves the recognition accuracy of elderly depression expressions. Further, the advanced features related to the dynamic change rate of depression micro-expressions were constructed, and subjected to EMD and Hilbert analysis. Experiments were carried out to disclose the influence of the number of feature fusion modules on model performance on different datasets. The time-frequency and ratio of micro-expressions in the entire video were obtained under different genders and different levels, and a t-test was carried out on standard deviation. The conclusions were drawn from the research assumptions and analysis results.
[1] Turliuc, M.N., Măirean, C., Boca-Zamfir, M. (2020). The relation between cyberbullying and depressive symptoms in adolescence. The moderating role of emotion regulation strategies. Computers in Human Behavior, 109: 106341. https://doi.org/10.1016/j.chb.2020.106341
[2] Dong, Y., Yang, X. (2021). A hierarchical depression detection model based on vocal and emotional cues. Neurocomputing, 441: 279-290. https://doi.org/10.1016/j.neucom.2021.02.019
[3] Valstar, M., Gratch, J., Schuller, B., Ringeval, F., Cowie, R., Pantic, M. (2016). Summary for AVEC 2016: Depression, mood, and emotion recognition workshop and challenge. Proceedings of the 24th ACM international conference on Multimedia, New York, United States, pp. 1483-1484. https://doi.org/10.1145/2964284.2980532
[4] Yang, S., Zhou, P., Duan, K., Hossain, M.S., Alhamid, M.F. (2018). emHealth: Towards emotion health through depression prediction and intelligent health recommender system. Mobile Networks and Applications, 23(2): 216-226. https://doi.org/10.1007/s11036-017-0929-3
[5] Qureshi, S.A., Dias, G., Hasanuzzaman, M., Saha, S. (2020). Improving depression level estimation by concurrently learning emotion intensity. IEEE Computational Intelligence Magazine, 15(3): 47-59. https://doi.org/10.1109/MCI.2020.2998234
[6] Kandilarova, S., Stoyanov, D., Stoeva, M., Latypova, A., Kherif, F. (2020). Functional MRI in depression—multivariate analysis of emotional task. Journal of Medical and Biological Engineering, 40(4): 535-544. https://doi.org/10.1007/s40846-020-00547-2
[7] Shinohara, S., Toda, H., Nakamura, M., et al. (2020). Evaluation of the severity of major depression using a voice index for emotional arousal. Sensors, 20(18): 5041. https://doi.org/10.3390/s20185041
[8] Valstar, M., Schuller, B., Smith, K., Eyben, F., Jiang, B., Bilakhia, S., Schnieder, S., Cowie, R., Pantic, M. (2013). Avec 2013: The continuous audio/visual emotion and depression recognition challenge. Proceedings of the 3rd ACM international workshop on Audio/visual emotion challenge, New York, United States, pp. 3-10. https://doi.org/10.1145/2512530.2512533
[9] Paulus, M.P., Angela, J.Y. (2012). Emotion and decision-making: affect-driven belief systems in anxiety and depression. Trends in Cognitive Sciences, 16(9): 476-483. https://doi.org/10.1016/j.tics.2012.07.009
[10] Pampouchidou, A., Pediaditis, M., Kazantzaki, E., Sfakianakis, S., Apostolaki, I. A., Argyraki, K., ..., Simos, P. (2020). Automated facial video-based recognition of depression and anxiety symptom severity: Cross-corpus validation. Machine Vision and Applications, 31(4): 1-19. https://doi.org/10.1007/s00138-020-01080-7
[11] Zhou, X., Jin, K., Shang, Y., Guo, G. (2018). Visually interpretable representation learning for depression recognition from facial images. IEEE Transactions on Affective Computing, 11(3): 542-552. https://doi.org/10.1109/TAFFC.2018.2828819
[12] Cai, H., Qu, Z., Li, Z., Zhang, Y., Hu, X., Hu, B. (2020). Feature-level fusion approaches based on multimodal EEG data for depression recognition. Information Fusion, 59: 127-138. https://doi.org/10.1016/j.inffus.2020.01.008
[13] Kumar, A.R., Aditya, K., Raj, S.A.J., Nandhakumar, V. (2020). Depression detection using optical characteristic recognition and natural language processing in SNS. In 2020 4th International Conference on Computer, Communication and Signal Processing (ICCCSP), Chennai, India, pp. 1-5. https://doi.org/10.1109/ICCCSP49186.2020.9315254
[14] Liu, Z., Wang, D., Ding, Z., Chen, Q. (2021, March). A novel bimodal fusion-based model for depression recognition. In 2020 IEEE International Conference on E-health Networking, Application & Services (HEALTHCOM), Shenzhen, China, pp. 1-4. https://doi.org/10.1109/HEALTHCOM49281.2021.9399033
[15] Othmani, A., Kadoch, D., Bentounes, K., Rejaibi, E., Alfred, R., Hadid, A. (2021). Towards robust deep neural networks for affect and depression recognition from speech. International Conference on Pattern Recognition, pp. 5-19. https://doi.org/10.1007/978-3-030-68790-8_1
[16] He, L., Chan, J.C.W., Wang, Z. (2021). Automatic depression recognition using CNN with attention mechanism from videos. Neurocomputing, 422: 165-175. https://doi.org/10.1016/j.neucom.2020.10.015
[17] Chen, Q., Chaturvedi, I., Ji, S., Cambria, E. (2021). Sequential fusion of facial appearance and dynamics for depression recognition. Pattern Recognition Letters, 150: 115-121. https://doi.org/10.1016/j.patrec.2021.07.005
[18] Xu, L., Hou, J., Gao, J. (2021). A novel smart depression recognition method using human-computer interaction system. Wireless Communications and Mobile Computing. https://doi.org/10.1155/2021/5565967
[19] Akbari, H., Sadiq, M.T., Rehman, A.U., et al. (2021). Depression recognition based on the reconstruction of phase space of EEG signals and geometrical features. Applied Acoustics, 179: 108078. https://doi.org/10.1016/j.apacoust.2021.108078
[20] Rejaibi, E., Komaty, A., Meriaudeau, F., Agrebi, S., Othmani, A. (2022). MFCC-based Recurrent Neural Network for automatic clinical depression recognition and assessment from speech. Biomedical Signal Processing and Control, 71: 103107. https://doi.org/10.1016/j.bspc.2021.103107